An XMM-Newton observation of the
globular cluster Omega Centauri
We report on a deep XMM-Newton EPIC observation of the globular cluster Omega Cen performed on August 13th, 2001. We have detected 11 and 27 faint X-ray sources in the core and half mass radii, searching down to a luminosity of 1.3 ergs s-1 in the 0.5-5 keV range. Most sources have bolometric X-ray luminosities between ergs s-1. We present the color-color and hardness-intensity diagrams of the source sample, as well as high-quality EPIC spectra of the brightest objects of the field; including the two candidate Cataclysmic Variables (CVs) in the core and the quiescent neutron star low-mass X-ray binary candidate. The spectra of the latter objects fully support their previous classification. We show that the bulk of sources are hard and spectrally similar to CVs. The lack of soft faint sources might be related to the absence of millisecond pulsars in the cluster. The XMM-Newton observations reveal the presence of an excess of sources well outside the core of the cluster where several RS CVn binaries have already been found. We have also analyzed a publicly available Chandra ACIS-I observation performed on January 24-25th, 2000, to improve the XMM-Newton source positions and to search for source intensity variations between the two data sets. 63 XMM-Newton sources have a Chandra counterpart, and 15 sources within the half-mass radius have shown time variability. Overall, the general properties of the faint X-ray sources in Cen suggest that they are predominantly CVs and active binaries (RS CVn or BY Dra).
Key Words.:
globular clusters : individuals (Omega Centauri) – X-ray : binaries – Stars : neutron – Novae, cataclysmic variables – binaries : general1 Introduction
Omega Centauri (NGC 5139, Cen) is one of the best studied objects of our galaxy. It is the most massive globular cluster (5.1 M☉, Meylan et al. 1995). It is characterized by large core and half mass radii (154.88 and 250.8 respectively, Harris 1996). Binaries are expected to be present in Cen either as a result of the evolution of primordial binaries, or through close encounters between stars in the cluster (Di Stefano & Rappaport 1992, 1994; Davies & Benz 1995; Verbunt 2002a). Binaries such as CVs, low mass X-ray binaries either with a neutron star or a black hole, or active X-ray binaries (RS CVn or BY Dra systems), millisecond pulsars could thus form. Some of these binaries have already been found as faint X-ray sources in Cen (Verbunt 2001).
Faint X-ray sources were first detected in Cen by the EINSTEIN X-ray satellite. EINSTEIN detected 5 faint point sources (one in the core, Hertz & Grindlay 1983) and a possible extended emission region, within the half mass radius (Hartwick et al. 1982). A decade after EINSTEIN, ROSAT detected 22 faint sources in the line of sight of Cen (Johnston et al. 1994; Verbunt & Johnston 2000). ROSAT confirmed the EINSTEIN sources, and resolved the core source into three components (Verbunt & Johnston 2000). However, ROSAT did not find any evidence for the diffuse emission seen by EINSTEIN (Johnston et al. 1994).
More recently, Chandra observed Cen and detected over 140 faint X-ray sources (Cool et al. 2002). From follow-up observations using the accurate Chandra positions, Cool et al. (2002) claimed that there were at least three classes of binaries present in the detected sample. Two of the three ROSAT core sources (ROSAT R9a and R9b) may be CVs (Carson et al. 2000). The third ROSAT core source (R20, Verbunt & Johnston 2000) was associated with a main sequence optical counterpart, showing weak H emission, suggesting a BY Dra system rather than a CV. In addition, two more Chandra core sources were detected with HST/WFPC2, with properties matching those of RS CVn or active-corona binaries (Cool et al. 2002). Finally, Cool et al. (2002) found the X-ray counterparts of two variable binaries discovered far out from the cluster center by Kaluzny et al. (1996). Based on their light curve properties, these two systems are proposed to be RS CVn binaries (Kaluzny et al. 1996, 2002). Beside these three classes of binaries, by looking at the spectral characteristics of the Chandra sources, Rutledge et al. (2002) noticed that one relatively bright object had an extremely soft X-ray spectrum. This spectrum was found to be consistent with those observed from field quiescent neutron star binaries (Rutledge et al. 2002). X-rays would then come from the neutron star surface maintained at a high temperature by episodic mass accretion from a binary companion. In total, up to four different types of binaries may have already been found in the cluster.
We have initiated a survey of nearby globular clusters with XMM-Newton (M22, Webb et al. 2002a, M13, NGC 6366, Gendre et al., in preparation and Cen). Because of the limited angular resolution of XMM-Newton, we have selected nearby clusters with large core radii. Taking advantage of the large collecting area of XMM-Newton ( 6 times that of Chandra), we wish to obtain the best possible spectral and timing information for the widest possible sample of faint X-ray sources.
In this paper, we present the first results of our deep XMM-Newton observation of Cen. We describe the general properties of the population of faint X-ray sources detected in the cluster (section 2). Using the publicly available Chandra observation, we have correlated the XMM-Newton and Chandra data (sections 3 and 4) to improve the XMM-Newton positions and search for intensity variations between the two data sets (section 5). We also present the spectra of the brightest objects in the field, with the emphasis on those for which an identification already exists (section 6). We briefly discuss the implications of our findings in section 7.
2 General properties of the faint X-ray sources in Omega Cen
2.1 The XMM-Newton observation
We observed Cen on 2001 August 13 with the XMM-Newton EPIC MOS (Turner et al. 2001) and PN (Strüder et al. 2001) cameras, using a full frame window mode and a medium filter. The observation was 40 kilosecond long with a low and stable background. The data were analyzed with the latest version (5.3.3) of the XMM-Newton Science Analysis Software (SAS). We used the calibration chains of the EPIC cameras, emchain and epchain, using the embadpixfind task to flag bad pixels and bad columns. We filtered the event files produced for good time intervals and non astrophysical events (electronic noise, cosmic rays). We used the predefined patterns, keeping only patterns 0-12 for the MOS detectors and patterns 0-4 for the PN, and we rejected all the events flagged as ’bad’ by the calibration chains. Finally, we also rejected events with energies below 0.4 keV and above 10 keV, because of a high number of bad patterns.
2.2 Source detection
Sources were searched between 0.5 and 5.0 keV, a range which encloses the peak of the effective area of the EPIC cameras. A wavelet detection algorithm was used111see the ewavelet documentation available at http://xmm.vilspa.esa.es/external/xmm_user_support/documentation/sas_pkg_frame.shtml. It is better suited to crowded fields than the sliding box algorithm. Given the early development stage of the task, we used a conservative 4 as the detection threshold. For each camera, the source list so obtained was used as an input to the task emldetect. emldetect computes for each source a maximum likelihood, taking into account the point spread function of the instrument. For each source, the task returns its best fit position, the statistical errors on this position ( or 68% confidence level), its count rate, and a maximum likelihood detection value. We used a maximum likelihood threshold of 12. In order to estimate the statistical error at the 90% confidence level for the source positions, we modified the public version of emldetect following the recommendation of the task author (for a two parameter fit, the 90 % confidence limit level is given by likelihood + 6.18, G. Lamer, private communication). Three PN sources were removed because their best fit positions fell onto bad columns. The cleaned PN, MOS1 and MOS2 source lists were then correlated using a customized version of the task srcmatch. srcmatch returns the positions of the correlated sources weighted by their statistical errors as derived for each instrument separately. The maximum likelihood of a correlated source is the sum of the individual maximum likelihoods.
The majority of the correlated sources are detected by the PN camera because it is more sensitive than the MOS cameras. There are however some sources missed by the PN, due to CCD gaps, or bad columns and the smaller field of view of the PN compared to the MOS; these sources are marked MOS only in Tables 1 and 2.
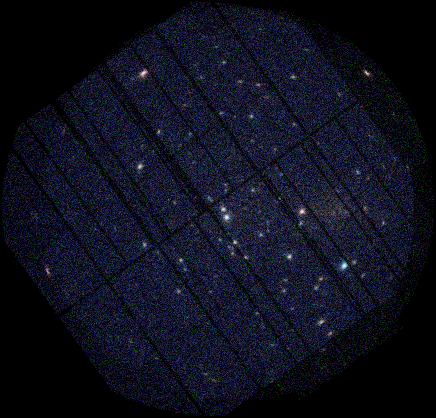
146 sources were detected by the EPIC cameras; 59 are seen only by the PN, 9 are MOS only (and all of them are seen in MOS 1 and MOS 2), and the remaining 78 are detected in the PN and at least one MOS camera. We present a false color combined PN and MOS image of the field of view in Fig. 1. The positions and statistical errors given at the 90% confidence level, the 0.5-5.0 keV source count rate and associated error are listed in Table 1 for those sources lying within the half mass radius and in Table 2 for the remaining sources. In EPIC-PN, a count rate of counts s-1 corresponds to an unabsorbed flux of ergs s-1 cm-2 for a 0.6 keV blackbody model absorbed through the interstellar absorption derived from the optical extinction (NH = cm-2, Djorgovski 1993; Predehl & Schmitt 1995). Assuming a 3 keV thermal Bremsstrahlung and a power law of photon index 2, the corresponding fluxes are ergs s-1 cm-2 and ergs s-1 cm-2 respectively.
2.3 Background sources
Some of the sources listed in Tables 1 and 2 are extragalactic background sources unrelated to the cluster. In order to estimate their number, we used the statistical Log N-Log S relationship of extragalactic sources derived from the Lockman Hole XMM-Newton data (Hasinger et al. 2001). To account for the vignetting function of the XMM-Newton mirrors, we have computed limiting count rates (for source detection) within different annuli (all centered on the cluster center), using an approach similar to Cool et al. (2002). The radius of each annulus is computed such that the annulus contains a large ( 25) number of sources (the radius varies between 2.5 and 4.2′). This allows us to set the limiting count rate to the count rate of the weakest source detected in that annulus. The limiting count rate is a factor of larger in the outer annulus than in the inner annulus. For direct comparison with the Log N - Log S curve of Hasinger et al. (2001), these count rates have then been converted into unabsorbed 0.5-2.0 keV fluxes using a power law model of index 2.0 absorbed through the cluster NH. Following this procedure, after a proper surface normalization, one expects 4, 9, 35 and 65 background sources within the core, half mass, twice the half mass and a 12.5′ radii (the values so obtained were rounded to the nearest integer). Beyond 12.5′, where we do not expect any cluster sources, the number of detected sources matched the one estimated with this procedure.
As an indication, we have computed the error on the above estimates assuming a 10% uncertainty on the limiting count rate estimate and a 10% uncertainty in the XMM-Newton calibration (note that the Log N-Log S relationship was derived from a processing of the Lockman hole data with the SAS prior to its first public release). This gives an error of 1 and 2 on the estimated number of background sources within the core and half mass radii.
2.4 Color-color and hardness-intensity diagrams
In order to investigate the general properties of the sources detected by XMM-Newton, we have computed X-ray color-color and hardness-intensity diagrams. For this purpose, we have produced PN images in three adjacent energy bands: 0.5-1.5 keV, 1.5-3.0 keV, 3.0-10.0 keV (similar bands were used by Grindlay et al. 2001). From these images, we have computed the net exposure corrected source count rate. To produce meaningful diagrams we have considered only sources detected with more than 3 counts in each band. There are 71 sources fitting this criteria. Two sets of diagrams have been computed: one for the sources found within a region of radius equal to twice the half mass radius and one for the whole field of view. They are presented in Fig. 2 and 3.


3 Cross-correlation with a previous Chandra observation
The mean statistical error on the positions of the sources detected by XMM-Newton is of the order of ″ (see Tables 1 and 2). To get the final positional error, one must add quadratically, the systematic error on the pointing direction of the XMM-Newton satellite, which is about 4″ (Jansen et al. 2001). This means that on average the position error will be around 6″.


However, this can be improved by using the most accurate positions provided by Chandra. For this purpose, we have analyzed the publicly available Chandra observation. The Chandra observation took place on 2000 January 24-25, in imaging mode using the ACIS-I detector placed in the focus of the telescope. The observation was 70 kiloseconds long. These data have already been presented by Cool et al. (2002) and Rutledge et al. (2002)
We retrieved the data from the archives and used CIAO version 2.2.1 and CALDB version 2.12 to calibrate the event files (using the CIAO task acis_process_events). During the Chandra observation, the background was low and stable. We then filtered the events file for non astrophysical events using the ASCA grades 0, 2, 3, 4, 6, and for good time intervals using the provided GTI222This is the standard choice for filtering the data; see the Chandra Proposers Observatory Guide available from the Chandra web site for details.. We also rejected events with energies below 0.2 keV. We made a basic detection scheme, using the CIAO task wavdetect. As recommended in the CIAO detect manual, we used a conservative spurious detection threshold of as input to wavdetect. As for XMM-Newton, sources were searched in the 0.5-5.0 keV range.
We found 129 sources within the ACIS-I field of view, to be compared to 146 in Cool et al. (2002) (Rutledge et al. 2002, used a sliding box algorithm and a very conservative detection threshold and reported 40 sources only). Even if we take into account a 1″ systematic error in the attitude reconstruction of Chandra, the mean error on the source positions remains very small, typically ″.
The Chandra positions were then used to compute the astrometric correction for the XMM-Newton observation. We have selected three XMM-Newton sources (sources 2, 8, and 15, see Tables 1 and 2), properly spaced within the field of view, far away from CCD gaps and bad columns, and among the brightest sources (i.e. with a small statistical error on their position). These sources are also clearly detected by Chandra. The astrometric correction was then computed with the three reference positions provided by Chandra, using the starast Interactive Data Language tools of the astrolib library. The positions listed in Tables 1 and 2 reflect this correction.
With this correction applied, 11 and 27 sources are detected by XMM-Newton within the core and half mass radii. For comparison, Chandra detected 22 and 46 sources within the same regions.
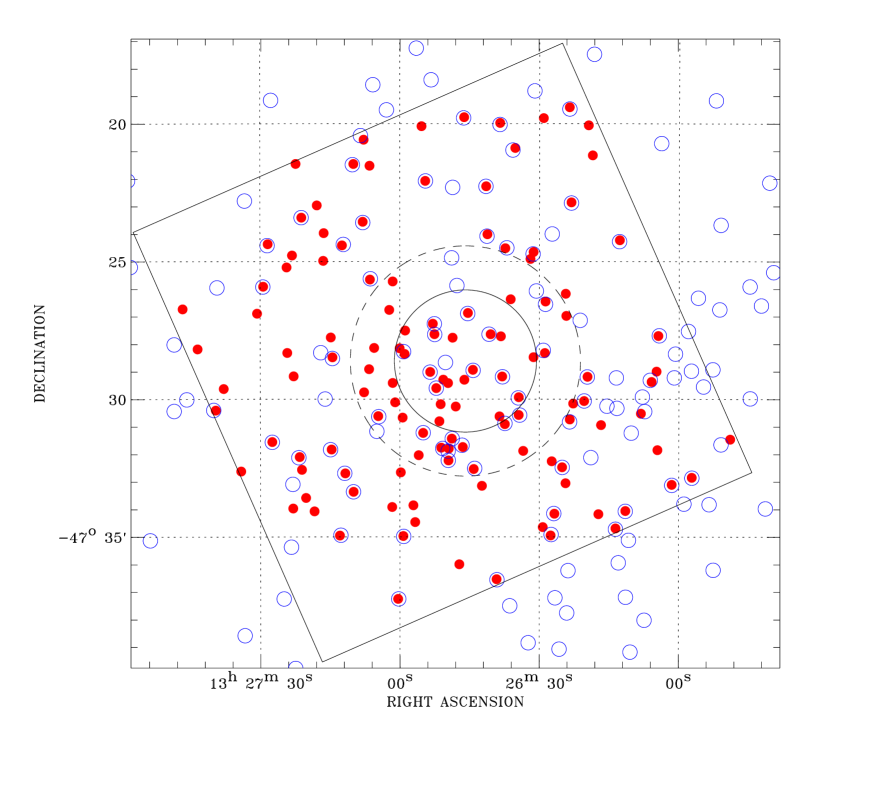
This correction further allows us to get rid of the systematic error and to cross-correlate the Chandra and XMM-Newton source positions. The positions of the Chandra sources found within the statistical error box of the XMM-Newton sources are given in Table 3. Sixty three XMM-Newton sources have a Chandra counterpart. We present in Fig. 4 the Chandra field of view and sources overlaid with the XMM-Newton image.
It is beyond the scope of this paper to investigate the error box content of each XMM-Newton source, and we have focussed the present paper on sources for which a previous identification has been reported. Two EINSTEIN sources were detected by both XMM-Newton and Chandra (sources B and C), and due to its larger field of view, XMM-Newton also detected the EINSTEIN sources A and D (these ones were missed by Chandra). EINSTEIN sources A and D (XMM-Newton sources 3 and 7) are associated with foreground M dwarfs (Cool et al. 1995). The source EINSTEIN C was resolved into sources R9a and R9b in ROSAT (Verbunt & Johnston 2000). These two core sources which are detected as XMM-Newton sources 2 and 5 are the two CV candidates (Carson et al. 2000; Cool et al. 2002). The ROSAT source R20 (detected by Chandra and proposed to be a BY Dra system, Cool et al. 2002) is not detected by XMM-Newton. The proposed quiescent neutron star binary is detected as source 4 by XMM-Newton. Finally, the source identified by Verbunt & Johnston (2000) as HD116789 is detected as source 28 (see Table 3).
We have estimated the limiting count rate of the XMM-Newton observation as the count rate needed for a detection of a source placed at a mean off-axis angle of 7.5′ which is half the radius of the EPIC-PN field of view. In the 0.5-5.0 keV band, the limiting count rate is counts s-1. For comparison the limiting count rate of a source on-axis is counts s-1. For Chandra, the limiting count rate estimated with the same method is counts s-1 for an on-axis source and counts s-1 for a source at 7.5′.
The limiting count rates have been converted into limiting fluxes using two spectral models; a blackbody of 0.6 keV and a thermal Bremsstrahlung of 3 keV. This gives ergs s-1 cm-2 and ergs s-1 cm-2 respectively for XMM-Newton and ergs s-1 cm-2 and ergs s-1 cm-2 for Chandra. At the distance of 5.3 kpc, these fluxes translate to 0.5-5.0 keV bolometric luminosities of ergs s-1 and ergs s-1 for XMM-Newton and Chandra respectively for the blackbody model.
As said above XMM-Newton detected 146 sources, and 63 of them have a Chandra counterpart. Of the 83 remaining XMM-Newton sources, 55 were outside the field of view of Chandra. Of the remaining 28, 2 were missed by ACIS-I because of CCD gaps and noisy columns (one is in the core). This leaves a total of 26 sources detected by XMM-Newton and not detected by Chandra. We have reprocessed the Chandra data with a less conservative spurious detection threshold () to search for fainter objects. The above number decreases from 26 to 23. Since the Chandra observations were more sensitive than the XMM-Newton one, one needs to investigate why 26 sources seen by XMM-Newton were not detected by Chandra. Part of the discrepancy resides in the presence of a region of extended emission.
4 Region of extended emission
Hartwick et al. (1982) found a region of extended emission in the EINSTEIN images. This region extended from the core to the west and the east of the cluster up to outside the half mass radius. However, ROSAT did not confirm the presence of such emission (Johnston et al. 1994). The XMM-Newton image presented in Fig. 5 with the Chandra sources shows that there is a region outside the half mass radius which contains 16 point sources superposed on a residual extended emission (on the right of the image). It is contained in a circle of 100 radius and centered at = , = . It is also present, though with less significance in the Chandra image. A zoom on this region with the detected Chandra and XMM-Newton sources is shown in Fig 5 (right). It shows that only 6 of the 16 XMM-Newton sources are also detected by Chandra. It is therefore likely that the 10 additional XMM-Newton sources may not be real point sources, but instead fluctuations of the extended emission which confused the detection algorithm. This and the origin of this emission will be discussed elsewhere. If we take out these 10 sources, there remains 16 XMM-Newton sources which would have been detected by Chandra; had their luminosity remained constant between the two observations. As we will show later, we have found evidence for variable sources in other regions of the images, including the cluster core.
The extended emission region seen by EINSTEIN also included the core of the cluster. The core now contains many faint X-ray sources as shown in Fig. 5, and we have no evidence for any residual extended emission.
5 Search for short and long term time variability
5.1 Variable sources within the XMM-Newton observation
We have extracted the light curves of the 26 strongest X-ray sources within the EPIC-PN field of view. The bin time of the light curve was chosen to ensure a sufficient number of count within each bin (typically larger than ). The light curves were searched for variability using the lcstat FTOOLs. Using a test, we found that 4 sources have a probability of being constant of less than 0.1%. The light curves of these 4 objects are shown in Fig 6. Only one lies in the core (source 24). The three others lie outside the half mass radius.

5.2 Variable sources between the Chandra and XMM-Newton observations
As shown above, all XMM-Newton sources should have been detected by Chandra, providing that their X-ray intensity had remained constant. In the core this is the case, as the only XMM-Newton source not detected by Chandra fell on an ACIS-I CCD gap. Within the half mass radius, 4 XMM-Newton sources were not detected by Chandra and must have therefore varied by at least a factor of .
We have converted the count rate of the Chandra sources to XMM-Newton count rates for comparison with our count rate detection threshold. We have found that 7 Chandra sources that lie within the half mass radius should have been detected by XMM-Newton and were not (this number rises to 20 if one considers the whole field of view). Finally, within the half mass radius there are 4 sources (13 in the whole field of view) detected by both Chandra and XMM-Newton but with different luminosities (a factor of two or higher variations). These sources are listed in Table 4. From this we conclude that 15 sources contained in the half mass radius have shown variability between the XMM-Newton and Chandra observations spaced by year.
5.3 Variable sources between the XMM-Newton and ROSAT observations
Cen was observed between August 1992 and January 1997 by ROSAT (Verbunt & Johnston 2000). The luminosity limit of the ROSAT observations was about ergs s-1 in the 0.5-2.5 keV range (Verbunt & Johnston 2000). We have computed the luminosity of the XMM-Newton sources in this same energy band. From this, we found that 1 source (source 13) should have been detected by ROSAT. Obviously, XMM-Newton which is more sensitive than ROSAT should have detected all ROSAT sources. This is not the case, as 1 ROSAT core source (source R20) is not present in the XMM-Newton image (it is however detected by Chandra).
6 Spectral analysis of the brightest objects
We have extracted spectra for the brightest sources; those with a total number of counts exceeding in the most sensitive EPIC-PN camera. There are 26 sources satisfying this criterion. In this paper, we limit the spectral analysis to the 16 sources lying within twice the half mass radius.
To accumulate spectra, we chose an extraction radius of 0.7 ′, except when another source was closer than 1.5 ′(two extraction radii). We extracted the background using an adjacent area of the same surface, at the same off axis angle on the same CCD. We generated ancillary response files and redistribution matrix files with the SAS tasks arfgen and rmfgen of the 5.3.3 release.
Whenever possible, we binned the spectra to contain at least twenty net counts in each bin, in order to use statistics. Otherwise we used the Cash statistics. For the spectra with the largest number of counts, we have left the interstellar column density as a free parameter of the fit. Note however that in all but one case, the fitted NH is consistent within error bars with the value expected from the optical extinction in the direction of the cluster. We used XSPEC v11.1 (Arnaud 1996) to fit the spectra. The limited statistics does not allow us to use spectral models more sophisticated than thermal Bremsstrahlung, blackbody, and power law.
6.1 Sources within the core and the half mass radii
There are three sources in the core for which a spectrum can be extracted (sources 2, 5 and 24), two more between the core and half mass radii (sources 9 and 20) and the proposed quiescent neutron star binary which is just at the border of the half mass radius (source number 4).

The three core sources are the two proposed CV candidates (Carson et al. 2000) and source 24 which was found to be variable within the XMM-Newton observation (see section 5 and Fig 5). The best fit spectral results are listed in Table 5. For the two CV candidates, the spectra can be accurately fitted with a thermal Bremsstrahlung (or alternatively with power laws of index ). Such spectra are expected from such systems (Richman 1996). Thus our spectral observations reinforce the classification of these two objects as CVs. Their unfolded spectra are shown in Fig. 7. These are to date the highest quality spectra ever measured from faint globular cluster X-ray sources.
For the third variable source, its spectrum is also consistent with a power law, but given the limited statistics it could be also fitted with a thermal bremsstrahlung. Despite the source faintness, we have searched for spectral variations within the observation. Two spectra were extracted, one during its steady state and another one during the flaring state. As can be seen in Table 5, the two spectra are consistent. Best fit results for the two additional sources found between the core and half mass radii are also listed in Table 5.
6.2 The quiescent neutron star binary

Rutledge et al. (2002) showed that the Chandra spectrum of the quiescent neutron star binary candidate can be fitted with a pure hydrogen neutron star atmosphere model (Pavlov et al. 1992; Zavlin et al. 1996). This source is also clearly detected in our observation, as the fourth brightest source in the field of view. Taking advantage of the better statistics of the XMM-Newton spectrum, we have also fitted its spectrum with the same neutron star atmosphere model. The parameters of the latter model are the temperature, the radius, the mass of the neutron star and its distance. The temperature and the radius were derived as measured by an observer at infinity. The best fit result with the mass of the neutron star and the source distance frozen are listed in Table 6. There is a remarkable consistency between the results reported in Rutledge et al. (2002) and ours, but thanks to the improved statistics the error bars on the fitted parameters are much smaller with the present data. We did not find any evidence for the presence of a power law tail. Assuming a power law with photon index of 2, an upper limit of 10 % of the total flux (90% confidence limit) can be derived for such a power law tail. The 0.1-5.0 keV bolometric luminosity measured by XMM-Newton is consistent within error bars with the Chandra value. The unfolded combined EPIC-PN and MOS spectrum is presented in Fig. 8. This is one of the best spectra of a quiescent neutron star binary obtained so far. Our observation thus strengthens the quiescent neutron star binary hypothesis for this object.
6.3 Notes on remaining sources within the field of view
In Fig. 9, we show the unfolded spectra of four more sources whose positions are between one and two half mass radii. All spectra are relatively hard, corresponding to colors in Fig 3 similar to the colors measured from the CVs. Their luminosities, just around are also consistent with the CV hypothesis. Note however that some of them may also be background sources.


In addition, there are two other sources in the field of view which deserve some attention. The first one is the brightest object (it was detected by both Chandra and ROSAT, see Table 3). Its unfolded spectrum together with its best power law fit is presented in Fig. 10. The high NH derived from the fit and its relatively large angular distance from the cluster center (about 8.5′) calls into question its membership to Cen. However, its unusual properties (time variability and hard spectrum) make it an interesting target for follow-up investigations. There are no counterparts listed in the USNO A2.0 catalog within 2” of the Chandra position.
The second object is the third brightest object in the field (source 3). It has an M dwarf counterpart (USNO-A2 0375-18249604, Cool et al. 1995). Its spectrum is well fitted by a 2 temperature Raymond-Smith model (2T) expected from such a system (Singh et al. 1996). The best fit parameters of all these objects are also given in Table 5.
7 Discussion
We have presented the first results of our deep XMM-Newton observation of the globular cluster Cen, emphasizing the general properties of the population of faint X-ray sources present in the cluster. We have detected 11 and 27 faint X-ray sources within the core and half-mass radii respectively. We have estimated that and of these objects could be unrelated background sources. Comparing the Chandra ACIS-I and XMM-Newton EPIC observations, we have found that 63 XMM-Newton sources have a Chandra counterpart. Fifteen sources that lie within the half mass radius have shown variability between the two observations. Intensity variations for several sources were also found within the XMM-Newton observation and between the XMM-Newton and previous ROSAT observations. We have also presented the first X-ray spectra of the brightest and peculiar objects in the field, in particular the proposed quiescent neutron star low mass X-ray binary for which the EPIC spectrum strengthens its classification. We have shown that the spectra of the two brightest core sources strongly support the proposal that they are CVs. We have found objects with similar spectra in the cluster. In the following, we briefly discuss what appears to be the main implications of our observation.
First of all, what is striking from our data is the excess of sources located in the vicinity of the cluster (just outside the half mass radius). This has already been noted by Cool et al. (2002) and Verbunt (2002a). For instance between 1 and 2 half-mass radii, there is an excess of sources, over the expected number of background sources. Obviously, some of them may be foreground stars. However, some may also belong to the cluster, and may have already been found as active binaries (RS CVn). Two of the OGLEGC sources located at relatively large off-axis (more than 2.5 core radii) were detected by Chandra (OGLEGC15 and OGLEGC22, Cool et al. 2002). Another one (OGLEGC30) has a position coincident with our XMM-Newton source 29. All are proposed to be RS CVn stars (Kaluzny et al. 1996, 2002). Their X-ray luminosity is not atypical of such systems ergs s-1, though on the bright end of their luminosity distribution (Dempsey et al. 1997).
Due to mass segregation effects, binaries which are more massive than lonely stars are expected to lie close to cluster center (e.g. Meylan & Heggie 1997). In Cen the mass segregation is very low, and that might explain the large population of binaries outside the core (e.g. Verbunt & Johnston 2000). Some of these binaries might also have been ejected outside the cluster through three-body interactions (an encounter of a binary with a single star). Another possibility could be that the potential well of the cluster was recently disrupted by the accretion of a discrete component of another stellar system. The recent discovery of a metal-rich stellar population in the cluster (Pancino et al. 2000) with a coherent bulk motion with respect to the other stars (Ferraro et al. 2002) was explained by the accretion of an independent stellar system by Cen. The presence of faint X-ray sources in the vicinity of Cen might thus be a consequence of an unusual dynamical evolution of the cluster.
The second most striking feature of our data is the lack of soft X-ray sources and the large number of sources showing long term variability. In Fig. 2 and 3, there is an obvious clustering of sources around the two previously identified CVs (which are spectrally hard). There are only two sources in the soft area: the star identified by Cool et al. (1995) and the proposed quiescent neutron star binary (note that these two objects are also among the brightest, see Fig. 3). The sources clustering below the two CV candidates (sources 2 and 5, represented by two filled squares) in the hardness intensity plot (see Fig. 3) have luminosities in the range to ergs s-1. The spectra of four of these objects are shown in Fig. 8. Similar spectra and luminosities are observed from disk and globular cluster CVs (e.g. Pooley et al. 2002a). CVs are well known to be variable, and might thus account for some of the variable sources present in the cluster (note that one core CV, source 5, showed variability by a factor of between the XMM-Newton and Chandra observations).
However, we note that one of the proposed RS CVns (OGLEGC30, Kaluzny et al. 1996, the counterpart of the XMM-Newton source 29) has colors similar to the two CVs (the statistic was unfortunately too poor to fit its spectrum). This source was not detected by Chandra and must have varied by at least a factor of between the two observations. The two OGLEGC sources (RS CVn candidates) detected by Chandra were not detected by XMM-Newton: the Chandra luminosity of OGLEGC 15 was below the XMM-Newton sensitivity threshold, on the other hand OGLEGC 22 should have been detected. Another example of variability is given by the ROSAT source R20, associated with a BY Dra (Cool et al. 2002). This source was detected by Chandra but not by XMM-Newton. These objects are variable, and will be preferentially detected during flaring outbursts, due to their low quiescent X-ray luminosities. The large number of variable sources in Cen (15 within the half mass radius between the Chandra and XMM-Newton observations) is also suggestive of a large population of RS CVns (including BY Dra) in the cluster. During snapshot X-ray observations, only a fraction could be seen. These sources could account for the population of the lower luminosity (ergs s-1) sources found in Cen.
Some of the faint and persistent sources of the hardness-intensity diagram (, see Fig. 3) have colors consistent with power law like spectra, with indices of the order of . Such power laws could result from magnetospheric emission of millisecond pulsars (Becker & Trümper 1998; Webb et al. 2002b). However, these sources are unlikely to be millisecond pulsars, because no such radio pulsars are presently known in the cluster (Freire 2002). Furthermore, Grindlay et al. (2002) have recently shown that the emission of the millisecond pulsars detected in 47 Tuc is dominated by the thermal emission from the polar caps of the neutron star. Such emission is much softer than the magnetospheric emission. These sources with soft thermal X-ray emission should lie on figure 3 between vertical lines passing through the two CV candidates and the quiescent neutron star binary. There are no sources in that region. Our observation would thus support the idea that Cen lacks millisecond pulsars. Obviously the difficulties in retaining neutron stars in a globular cluster and the low collision frequency of Cen could provide an explanation (see e.g. Pfahl et al. 2002; Verbunt 2002a).
In the disk, quiescent neutron star binaries have luminosities in the range erg s-1 (Narayan et al. 2002). Furthermore, they all have extremely soft X-ray spectra (Rutledge et al. 2000). In our observation, there is one single object with these characteristics. If globular cluster quiescent neutron star binaries behave similarly to those in the disk, then our observation should provide a complete census of the content of such objects in Cen (a similar conclusion was derived by Rutledge et al. 2002, from the Chandra observations). Some of these objects have also been found in other clusters (Edmonds 2002; Grindlay et al. 2001; Pooley et al. 2002b). In globular clusters, these systems are certainly formed from a close encounter between a neutron star with a single star or with a binary (see Verbunt 2002b, for a recent review). The presence of one such system in Cen is consistent with its lower collision frequency compared to other clusters (Verbunt 2002b). The presence of this object far away from the core remains somewhat puzzling in that regard. It might have been ejected from the core during a three-body interaction (Verbunt 2002b). The presence of a single candidate quiescent neutron star binary together with the apparent lack of millisecond pulsars in the cluster makes Cen clearly different from clusters like 47 Tuc in which a large population of binaries with neutron star primaries are being discovered (e.g. Grindlay et al. 2001; Camilo et al. 2000). This difference, if confirmed, should help us in understanding how neutron stars form and evolve in globular clusters.
Finally, some of the faint sources could be quiescent black hole binaries (one black hole may have just been discovered in the globular cluster M15, and some are being found in globular clusters in other galaxies, Gerssen et al. 2002; Verbunt 2002b). Most quiescent black hole binaries within the galactic disk have been observed with luminosities of erg s-1 (Kong et al. 2002; Hameury et al. 2003). Their spectra are well fitted with power laws, with spectral indices of 1.5-2 (Kong et al. 2002). Such spectra correspond to hardness ratios in the range 0.4-0.9 in Fig. 3. About 10 objects have colors and luminosities consistent with a quiescent black hole binary nature. This hypothesis is however poorly constrained from our X-ray observations alone, as many faint sources could be background active galactic nuclei.
8 Conclusions
The main results of our XMM-Newton observation are that in Omega Cen the binaries do not seem be confined to the core or even within the half mass radius, as previously thought, and that the majority of the faint X-ray sources may be CVs, RS CVn or BY Dra binaries. Obviously, the small number of identifications currently available prevents us from reaching definite conclusions. The spectral and timing information provided by XMM-Newton, together with the accurate positions provided by Chandra for a wide sample of faint X-ray sources should encourage follow-up investigations at other wavelengths (optical, UV, radio). In particular, these observations should tell us whether those sources found well outside the core of Cen really belong to the cluster. More identifications are also required before reliable comparisons between Cen and other clusters with different structural parameters can be drawn. Such comparisons are critical to a better understanding of the dynamical evolution of globular clusters in general.
Acknowledgements.
The authors would like to thank A. Cool and F. Verbunt for helpful discussions and the referee, H. Johnston for valuable comments. We would also like to thank M. Watson and P. Marty for their help during the analysis of the extended emission region, V. E. Zavlin for providing us with the pure H neutron star atmosphere model, and G. Hasinger for discussions about the interpretation of the Lockman Hole results. Finally, we are grateful to G. Lamer and J. Tedds for help with the astrometric correction.References
- Arnaud (1996) Arnaud, K. A. 1996, in ASP Conf. Ser. Vol. 101, Astronomical Data Analysis Software and Systems V, ed. G. Jacoby & J. Barnes, 17
- Bailyn & Grindlay (1990) Bailyn, C. D., & Grindlay, J. E. 1990, ApJ, 353, 159
- Becker & Trümper (1998) Becker, W., & Trümper, J. 1998, A&A, 341, 803
- Camilo et al. (2000) Camilo, F., Lorimer, D. R., Freire, P., Lyne, A. G., & Manchester, R. N. 2000, ApJ, 535, 975
- Carson et al. (2000) Carson, J. E., Cool, A. M., & Grindlay, J. E. 2000, ApJ, 532, 461
- Cool et al. (1995) Cool, A. M., Grindlay, J. E., Bailyn, C. D., Callanan, P. J., & Hertz, P. 1995, ApJ, 438, 719
- Cool et al. (2002) Cool, A. M., Haggard, D., & Carlin, J. L. 2002, in ASP Conf. Ser. Vol. 265, Centauri : a unique window into astrophysics, ed. F. van Leeuwen, J. Hughes & G. Piotto (San Francisco: Astronomical Society of the Pacific), 277
- Davies & Benz (1995) Davies, M. B., & Benz, W. 1995, MNRAS, 276, 876
- Dempsey et al. (1997) Dempsey, R. C., Linsky, J. L., Fleming, T. A., & Schmitt, J. H. M. M. 1997, ApJ, 478, 325
- Di Stefano & Rappaport (1992) Di Stephano, R., & Rappaport, S. 1992, ApJ, 396, 587
- Di Stefano & Rappaport (1994) Di Stephano, R., & Rappaport, S. 1994, ApJ, 423, 274
- Djorgovski (1993) Djorgovski, S. G. 1993, in PASP50 : Structure and Dynamics of Globular Clusters, ed Djorgovski S. G. and Meylan G. (San Francisco: Astronomical Society of the Pacific), 373
- Edmonds (2002) Edmonds, P. D. 2002, to appears in ASP Conf. Ser., New Horizons in globular cluster astronomy, ed. G. Piotto, G. Meylan, G. Djorgovski, & M. Riello, astroph 0210521
- Elson et al. (1987) Elson, R., Hut, P., & Inagaki, S. 1987, ARA&A, 25, 565
- Ferraro et al. (2002) Ferraro, F. R., Bellazzini, M., & Pancino, E. 2002, ApJ, 573, 95
- Freire (2002) Freire, P. 2002, http://www.naic.edu/ pfreire/GCpsr.html
- Gerssen et al. (2002) Gerssen, J., van der Marel, R. P., Gebhardt, K., et al. 2002 ApJ in press [astro-ph 0209315]
- Grindlay (1987) Grindlay, J. E. 1987, in IAU Symp. 125, The origin and evolution of neutron stars (Dordrecht; Kluwer), 173
- Grindlay et al. (2001) Grindlay, J. E., Heinke, C., Edmonds, P. D., & Murray, S. S. 2001, Sci., 292, 2290
- Grindlay et al. (2002) Grindlay, J.E., Camilo, F., Heinke, C., et al. 2002, ApJ, in press
- Hameury et al. (2003) Hameury, J.M., Barret, D., Lasota, J.E., et al. 2003, A&A, in press
- Hartwick et al. (1982) Hartwick, F. D. A., Cowley, A. P., & Grindlay, J. E. 1982, ApJ, 254, L11
- Harris (1996) Harris, W. E. 1996, AJ, 112, 1487
- Hasinger et al. (2001) Hasinger, G., Altieri, B., Arnaud, M., et al. 2001, A&A, 365, L45
- Hertz & Grindlay (1983) Hertz, P., & Grindlay, J. E. 1983, ApJ, 275, 105
- Hut (1983) Hut, P. 1983, ApJ, 272, L29
- Hut et al. (1992) Hut, P., McMillan, S., Goodman, J., et al. 1992, PASP104, 981
- Jansen et al. (2001) Jansen, F., Lumb, D., Altieri, B., et al. 2001, A&A, 365, L1
- Johnston et al. (1994) Johnston, H. M., Verbunt, F., & Hasinger, G. 1994, A&A, 289, 763
- Kaluzny et al. (1996) Kaluzny, J., Kubiak, M., Szymanski, M., et al. 1996, A&AS, 120, 139
- Kaluzny et al. (2002) Kaluzny, J., Thompson, I., Krzeminski, W., et al. 2002, in ASP Conf. Ser. Vol. 265, Centauri : a unique window into astrophysics, ed. F. van Leeuwen, J. Hughes & G. Piotto (San Francisco: Astronomical Society of the Pacific), 155
- Kong et al. (2002) Kong, A. K. H., McClintock, J. E., Garcia, M. R., Murray, S. S., & Barret, D. 2002, ApJ, 570, 277
- Meylan et al. (1995) Meylan, G., Mayor, M., Duquennoy, A., & Dubath, P. 1995, A&A, 303, 761
- Meylan & Heggie (1997) Meylan, G., & Heggie, D. C. 1997, A&A Rev., 8, 1
- Narayan et al. (2002) Narayan, R., Garcia, M.R., & McClintock, J.E. 2002, in Proc. IX Marcel Grossmann Meeting, eds. V. Gurzadyan, R. Jantzen and R. Ruffini, Singapore : World Scientific, in press, astro-ph/0107387
- Pancino et al. (2000) Pancino, E., Ferraro, F. R., Piotto, G., & Zoccali, M. 2000, ApJ, 534, L83
- Pavlov et al. (1992) Pavlov, G. G., Shibanov, Y. A., & Zavlin, V. E. 1992, MNRAS, 253, 193
- Pfahl et al. (2002) Pfahl, E., Rappaport, S., & Podsiadlowski, P. 2002, ApJ, 573, 283
- Pooley et al. (2002a) Pooley, D., Lewin, W. H. G., Homer, L., et al. 2002a, ApJ, 569, 405
- Pooley et al. (2002b) Pooley, D., Lewin, W. H. G., Homer, L., et al. 2002b, ApJ, 573, 184
- Predehl & Schmitt (1995) Predehl, P. & Schmitt, J. H. M. M. 1995, A&A, 293, 889
- Pryor & Meylan (1993) Pryor, C., & Meylan, G. 1993, in PASP50 : Structure and Dynamics of Globular Clusters, ed Djorgovski S. G. and Meylan G. (San Francisco: Astronomical Society of the Pacific), 357
- Richman (1996) Richman, H. R. 1996, ApJ, 462, 404
- Rutledge et al. (2000) Rutledge, R. E., Bildsten, L., Brown, E. F., Pavlov, G. G., & Zavlin, V. E. 2002, ApJ, 529, 985
- Rutledge et al. (2002) Rutledge, R. E., Bildsten, L., Brown, E. F., Pavlov, G. G., & Zavlin, V. E. 2002, ApJ, 578, 405
- Singh et al. (1996) Singh, K., Drake, S., & White, N. 1996, AJ, 111, 2415
- Strüder et al. (2001) Strüder, L., Briel, U., Dennerl, K., et al. 2001, A&A, 365, L18
- Thompson et al. (2001) Thompson, I. B, Kaluzny, J., Pych, W., et al. 2001; AJ, 121, 3089
- Turner et al. (2001) Turner, M. J. L., Abbey, A., Arnaud, M., et al. 2001, A&A, 365, L27
- Verbunt & Johnston (2000) Verbunt, F., & Johnston, H. M. 2000, A&A, 358, 910
- Verbunt (2001) Verbunt, F. 2001, A&A, 368, 137
- Verbunt (2002a) Verbunt, F. 2002a, in ASP Conf. Ser. Vol. 265, Centauri : a unique window into astrophysics, ed. F. van Leeuwen, J. Hughes & G. Piotto(San Francisco: Astronomical Society of the Pacific), 289
- Verbunt (2002b) Verbunt, F. 2002b, to appears in ASP Conf. Ser., New Horizons in globular cluster astronomy, ed. G. Piotto, G. Meylan, G. Djorgovski, & M. Riello, astroph 0210057
- Webb et al. (2002a) Webb, N. A., Gendre, B., & Barret, D. 2002a, A&A, 381, 481
- Webb et al. (2002b) Webb, N. A., Olive, J. F., Barret, D., & Gavignaud, I. 2002b, proceeding of the conference ’New Visions of the X-ray universe in the XMM-Newton and Chandra era’
- Zavlin et al. (1996) Zavlin, V. E., Pavlov, G. G., & Shibanov, Y. A. 1996, A&A, 315, 141
| Instrument | Source | RA | Dec | Position | Rate | MOS1 | MOS2 | Core |
|---|---|---|---|---|---|---|---|---|
| ID | h m s | Error (″) | detection | detection | source | |||
| PN | 122 | 13: 26: 48.9 | -47: 24: 52.2 | 7.32 | 0.13 0.03 | No | No | No |
| PN | 80 | 13: 26: 30.7 | -47: 26: 04.4 | 4.76 | 0.14 0.03 | Yes | No | No |
| PN | 49 | 13: 26: 28.7 | -47: 26: 33.3 | 5.28 | 0.15 0.03 | No | Yes | No |
| PN | 103 | 13: 26: 45.4 | -47: 26: 53.6 | 4.92 | 0.15 0.03 | No | No | Yes |
| PN | 44 | 13: 26: 52.6 | -47: 27: 15.9 | 3.89 | 0.25 0.04 | Yes | Yes | Yes |
| PN | 24 | 13: 26: 40.8 | -47: 27: 38.6 | 2.35 | 0.54 0.05 | Yes | Yes | Yes |
| PN | 61 | 13: 26: 52.5 | -47: 27: 39.1 | 4.08 | 0.18 0.03 | Yes | Yes | Yes |
| PN | 42 | 13: 26: 59.2 | -47: 28: 16.5 | 4.41 | 0.35 0.04 | Yes | Yes | Yes |
| PN | 111 | 13: 26: 50.2 | -47: 28: 40.1 | 4.47 | 0.14 0.03 | No | No | Yes |
| PN | 92 | 13: 26: 44.3 | -47: 28: 57.4 | 4.89 | 0.17 0.03 | No | No | Yes |
| PN | 5 | 13: 26: 53.5 | -47: 29: 01.3 | 1.17 | 1.74 0.08 | Yes | Yes | Yes |
| PN | 101 | 13: 26: 37.9 | -47: 29: 11.3 | 5.06 | 0.16 0.03 | No | No | Yes |
| PN | 2 | 13: 26: 52.2 | -47: 29: 36.1 | 0.74 | 3.56 0.11 | Yes | Yes | Yes |
| PN | 72 | 13: 26: 34.5 | -47: 29: 57.3 | 3.84 | 0.25 0.04 | No | No | Yes |
| PN | 60 | 13: 26: 34.2 | -47: 30: 34.7 | 4.08 | 0.25 0.04 | Yes | No | No |
| PN | 127 | 13: 27: 04.5 | -47: 30: 38.2 | 5.43 | 0.12 0.03 | No | No | No |
| PN | 20 | 13: 26: 37.4 | -47: 30: 52.9 | 2.32 | 0.53 0.05 | Yes | Yes | No |
| PN | 88 | 13: 27: 04.9 | -47: 31: 10.2 | 6.88 | 0.13 0.03 | Yes | No | No |
| PN | 38 | 13: 26: 55.0 | -47: 31: 13.2 | 3.73 | 0.29 0.04 | Yes | Yes | No |
| PN | 9 | 13: 26: 48.7 | -47: 31: 26.2 | 1.72 | 1.46 0.10 | Yes | Yes | No |
| PN | 108 | 13: 26: 46.6 | -47: 31: 40.5 | 5.79 | 0.16 0.03 | No | No | No |
| PN | 36 | 13: 26: 50.8 | -47: 31: 47.5 | 3.91 | 0.33 0.04 | Yes | Yes | No |
| PN | 35 | 13: 26: 49.6 | -47: 31: 53.2 | 7.26 | 0.17 0.03 | Yes | Yes | No |
| PN | 57 | 13: 26: 49.6 | -47: 32: 13.4 | 2.95 | 0.35 0.05 | No | No | No |
| PN | 16 | 13: 26: 43.9 | -47: 32: 31.0 | 2.71 | 0.68 0.07 | Yes | Yes | No |
| MOS | 96 | 13: 26: 47.7 | -47: 25: 52.6 | 4.71 | 0.05 0.02 | Yes | Yes | No |
| MOS | 50 | 13: 26: 29.2 | -47: 28: 13.8 | 2.99 | 0.13 0.02 | Yes | Yes | No |
| Instrument | Source | RA | Dec | Position | Rate | MOS1 | MOS2 |
|---|---|---|---|---|---|---|---|
| ID | h m s | Error (″) | detection | detection | |||
| PN | 119 | 13: 26: 37.8 | -47: 16: 00.8 | 7.59 | 0.31 0.06 | No | No |
| PN | 54 | 13: 26: 56.4 | -47: 17: 15.4 | 3.77 | 0.53 0.07 | No | Yes |
| PN | 65 | 13: 26: 18.3 | -47: 17: 28.6 | 5.31 | 0.43 0.07 | Yes | Yes |
| PN | 29 | 13: 26: 53.3 | -47: 18: 24.4 | 3.60 | 0.63 0.07 | Yes | Yes |
| PN | 97 | 13: 27: 05.8 | -47: 18: 35.1 | 5.02 | 0.30 0.05 | No | No |
| PN | 132 | 13: 26: 31.0 | -47: 18: 48.5 | 26.59 | 0.21 0.05 | No | No |
| PN | 3 | 13: 27: 27.7 | -47: 19: 08.8 | 0.83 | 7.39 0.24 | Yes | Yes |
| PN | 17 | 13: 26: 23.5 | -47: 19: 27.9 | 3.00 | 0.89 0.08 | Yes | Yes |
| PN | 56 | 13: 27: 02.8 | -47: 19: 29.9 | 5.59 | 0.38 0.06 | Yes | Yes |
| PN | 28 | 13: 26: 46.3 | -47: 19: 47.4 | 2.64 | 0.80 0.07 | Yes | Yes |
| PN | 31 | 13: 26: 38.5 | -47: 20: 01.7 | 2.43 | 0.66 0.07 | Yes | Yes |
| PN | 95 | 13: 27: 08.4 | -47: 20: 25.9 | 7.41 | 0.16 0.04 | Yes | No |
| PN | 43 | 13: 26: 03.8 | -47: 20: 42.9 | 3.86 | 0.54 0.07 | Yes | Yes |
| PN | 73 | 13: 26: 35.7 | -47: 20: 57.4 | 9.14 | 0.26 0.05 | No | Yes |
| PN | 68 | 13: 27: 10.2 | -47: 21: 29.2 | 4.06 | 0.31 0.05 | Yes | No |
| PN | 145 | 13: 28: 08.7 | -47: 21: 36.8 | 48.16 | 0.54 0.09 | No | No |
| PN | 133 | 13: 27: 58.4 | -47: 22: 03.6 | 24.29 | 0.30 0.06 | No | No |
| PN | 32 | 13: 26: 54.5 | -47: 22: 04.7 | 2.73 | 0.46 0.06 | Yes | Yes |
| PN | 15 | 13: 26: 41.5 | -47: 22: 16.5 | 2.34 | 0.66 0.06 | Yes | Yes |
| PN | 77 | 13: 26: 48.6 | -47: 22: 18.7 | 4.95 | 0.15 0.03 | No | Yes |
| PN | 129 | 13: 27: 33.3 | -47: 22: 48.1 | 6.29 | 0.18 0.04 | No | No |
| PN | 39 | 13: 26: 23.2 | -47: 22: 52.7 | 2.70 | 0.52 0.06 | Yes | No |
| PN | 70 | 13: 28: 01.9 | -47: 23: 16.5 | 4.68 | 0.68 0.09 | No | No |
| PN | 18 | 13: 27: 21.2 | -47: 23: 24.4 | 1.92 | 0.92 0.08 | Yes | Yes |
| PN | 41 | 13: 27: 07.9 | -47: 23: 35.3 | 3.28 | 0.42 0.05 | Yes | Yes |
| PN | 99 | 13: 25: 51.0 | -47: 23: 40.6 | 5.60 | 0.33 0.06 | No | No |
| PN | 118 | 13: 26: 27.3 | -47: 24: 00.2 | 17.34 | 0.20 0.04 | No | No |
| PN | 67 | 13: 26: 41.3 | -47: 24: 05.0 | 6.67 | 0.17 0.03 | Yes | Yes |
| PN | 79 | 13: 26: 12.8 | -47: 24: 16.6 | 5.92 | 0.19 0.04 | No | Yes |
| PN | 110 | 13: 27: 12.1 | -47: 24: 22.9 | 5.66 | 0.17 0.04 | No | No |
| PN | 94 | 13: 27: 28.5 | -47: 24: 25.2 | 4.86 | 0.23 0.04 | No | No |
| PN | 126 | 13: 26: 37.0 | -47: 24: 30.5 | 6.26 | 0.12 0.03 | No | No |
| PN | 59 | 13: 26: 31.4 | -47: 24: 43.6 | 5.14 | 0.24 0.04 | Yes | Yes |
| PN | 86 | 13: 27: 57.9 | -47: 25: 12.0 | 6.47 | 0.29 0.06 | No | Yes |
| PN | 75 | 13: 25: 39.7 | -47: 25: 23.4 | 6.02 | 0.35 0.06 | No | Yes |
| PN | 82 | 13: 27: 06.3 | -47: 25: 37.8 | 7.52 | 0.17 0.03 | No | Yes |
| PN | 106 | 13: 25: 44.8 | -47: 25: 54.7 | 7.58 | 0.31 0.06 | No | No |
| PN | 6 | 13: 27: 29.4 | -47: 25: 55.4 | 1.18 | 2.35 0.11 | Yes | Yes |
| PN | 146 | 13: 27: 39.3 | -47: 25: 57.1 | 7.76 | 0.15 0.04 | No | No |
| PN | 144 | 13: 27: 59.4 | -47: 26: 09.5 | 7.58 | 0.22 0.05 | No | No |
| PN | 26 | 13: 25: 55.9 | -47: 26: 19.6 | 2.53 | 0.85 0.08 | Yes | Yes |
| PN | 131 | 13: 25: 42.3 | -47: 26: 36.1 | 9.30 | 0.25 0.05 | No | No |
| PN | 105 | 13: 25: 51.3 | -47: 26: 44.9 | 5.92 | 0.26 0.05 | No | No |
| PN | 115 | 13: 26: 21.3 | -47: 27: 08.2 | 4.93 | 0.14 0.03 | No | No |
| PN | 138 | 13: 25: 58.0 | -47: 27: 32.0 | 6.95 | 0.16 0.04 | No | No |
| PN | 135 | 13: 25: 32.6 | -47: 27: 37.8 | 8.22 | 0.25 0.06 | No | No |
| PN | 76 | 13: 26: 04.2 | -47: 27: 41.6 | 7.24 | 0.15 0.04 | No | Yes |
| PN | 140 | 13: 27: 48.5 | -47: 28: 01.0 | 47.60 | 0.20 0.04 | No | No |
| PN | 102 | 13: 27: 17.0 | -47: 28: 18.7 | 5.41 | 0.12 0.03 | Yes | No |
| PN | 136 | 13: 26: 00.8 | -47: 28: 21.5 | 10.83 | 0.17 0.04 | No | No |
| Instrument | Source | RA | Dec | Position | Rate | MOS1 | MOS2 |
|---|---|---|---|---|---|---|---|
| ID | h m s | Error (″) | detection | detection | |||
| PN | 47 | 13: 27: 14.5 | -47: 28: 31.3 | 4.40 | 0.28 0.04 | Yes | Yes |
| PN | 33 | 13: 25: 52.7 | -47: 28: 55.4 | 3.11 | 0.71 0.08 | Yes | Yes |
| PN | 98 | 13: 25: 57.3 | -47: 28: 58.6 | 6.54 | 0.27 0.05 | No | No |
| PN | 4 | 13: 26: 19.7 | -47: 29: 11.5 | 0.78 | 3.42 0.12 | Yes | Yes |
| PN | 91 | 13: 26: 13.5 | -47: 29: 13.5 | 6.09 | 0.21 0.04 | No | No |
| PN | 62 | 13: 26: 01.0 | -47: 29: 13.2 | 5.70 | 0.31 0.05 | No | Yes |
| PN | 51 | 13: 26: 06.2 | -47: 29: 18.7 | 5.21 | 0.53 0.06 | No | No |
| PN | 64 | 13: 28: 14.1 | -47: 29: 24.0 | 5.99 | 0.92 0.10 | No | No |
| PN | 123 | 13: 25: 54.7 | -47: 29: 32.9 | 11.31 | 0.20 0.04 | No | No |
| PN | 78 | 13: 26: 07.9 | -47: 29: 55.1 | 4.43 | 0.27 0.04 | No | No |
| PN | 27 | 13: 25: 44.7 | -47: 29: 58.5 | 3.42 | 0.67 0.08 | Yes | Yes |
| PN | 107 | 13: 27: 16.1 | -47: 29: 59.7 | 5.76 | 0.17 0.04 | No | No |
| PN | 100 | 13: 27: 45.8 | -47: 30: 00.8 | 7.85 | 0.17 0.04 | Yes | No |
| PN | 137 | 13: 26: 15.5 | -47: 30: 15.1 | 47.94 | 0.13 0.03 | No | No |
| PN | 104 | 13: 26: 13.3 | -47: 30: 19.8 | 5.20 | 0.18 0.04 | No | No |
| PN | 84 | 13: 27: 40.0 | -47: 30: 24.0 | 5.91 | 0.22 0.04 | Yes | No |
| PN | 109 | 13: 27: 48.5 | -47: 30: 26.0 | 4.44 | 0.23 0.05 | No | No |
| PN | 87 | 13: 26: 07.4 | -47: 30: 26.8 | 5.88 | 0.25 0.04 | No | No |
| PN | 117 | 13: 26: 23.5 | -47: 30: 49.4 | 6.53 | 0.15 0.03 | No | No |
| PN | 124 | 13: 26: 10.2 | -47: 31: 13.8 | 27.02 | 0.16 0.04 | No | No |
| PN | 12 | 13: 27: 27.4 | -47: 31: 33.7 | 2.14 | 0.93 0.08 | Yes | Yes |
| PN | 121 | 13: 25: 50.9 | -47: 31: 38.9 | 25.26 | 0.23 0.05 | No | No |
| PN | 114 | 13: 27: 14.9 | -47: 31: 50.0 | 5.49 | 0.15 0.03 | No | No |
| PN | 74 | 13: 27: 21.7 | -47: 32: 07.3 | 7.32 | 0.15 0.04 | No | Yes |
| PN | 139 | 13: 26: 18.9 | -47: 32: 07.2 | 15.62 | 0.28 0.04 | No | No |
| PN | 8 | 13: 26: 25.1 | -47: 32: 28.7 | 1.12 | 2.10 0.10 | Yes | Yes |
| PN | 11 | 13: 27: 11.9 | -47: 32: 41.4 | 1.86 | 0.82 0.07 | Yes | Yes |
| PN | 21 | 13: 25: 57.2 | -47: 32: 51.6 | 2.34 | 0.86 0.08 | Yes | Yes |
| PN | 116 | 13: 27: 23.0 | -47: 33: 05.4 | 7.07 | 0.18 0.04 | No | No |
| PN | 1 | 13: 26: 01.5 | -47: 33: 07.4 | 0.69 | 6.94 0.20 | Yes | Yes |
| PN | 34 | 13: 27: 10.0 | -47: 33: 21.8 | 3.34 | 0.36 0.05 | Yes | Yes |
| PN | 14 | 13: 28: 09.1 | -47: 33: 27.0 | 2.42 | 2.39 0.16 | Yes | No |
| PN | 130 | 13: 25: 58.9 | -47: 33: 48.2 | 46.71 | 0.22 0.05 | No | No |
| PN | 37 | 13: 25: 53.5 | -47: 33: 49.3 | 3.58 | 0.62 0.07 | Yes | Yes |
| PN | 90 | 13: 25: 41.3 | -47: 33: 58.0 | 8.28 | 0.28 0.06 | Yes | No |
| PN | 25 | 13: 26: 11.5 | -47: 34: 04.2 | 2.43 | 0.78 0.07 | Yes | Yes |
| PN | 40 | 13: 26: 26.9 | -47: 34: 09.1 | 3.88 | 0.33 0.05 | Yes | Yes |
| PN | 22 | 13: 26: 13.6 | -47: 34: 43.2 | 2.44 | 0.88 0.08 | Yes | Yes |
| PN | 30 | 13: 26: 27.4 | -47: 34: 54.9 | 2.94 | 0.50 0.06 | Yes | Yes |
| PN | 23 | 13: 27: 12.7 | -47: 34: 56.4 | 2.38 | 0.77 0.07 | Yes | Yes |
| PN | 52 | 13: 26: 59.2 | -47: 34: 59.0 | 3.58 | 0.31 0.05 | Yes | Yes |
| PN | 93 | 13: 26: 10.8 | -47: 35: 07.3 | 4.89 | 0.27 0.05 | No | No |
| PN | 85 | 13: 27: 53.7 | -47: 35: 07.6 | 6.17 | 0.28 0.06 | Yes | No |
| PN | 141 | 13: 27: 23.4 | -47: 35: 22.2 | 8.37 | 0.16 0.04 | No | No |
| PN | 120 | 13: 26: 13.0 | -47: 35: 56.3 | 8.64 | 0.22 0.04 | No | No |
| PN | 143 | 13: 25: 52.5 | -47: 36: 12.2 | 6.88 | 0.19 0.05 | No | No |
| PN | 46 | 13: 26: 23.8 | -47: 36: 13.5 | 4.16 | 0.36 0.05 | Yes | Yes |
| PN | 45 | 13: 26: 39.1 | -47: 36: 33.5 | 3.76 | 0.33 0.05 | Yes | Yes |
| PN | 10 | 13: 26: 11.4 | -47: 37: 11.3 | 1.35 | 2.51 0.13 | Yes | Yes |
| PN | 142 | 13: 26: 26.6 | -47: 37: 12.7 | 9.22 | 0.17 0.04 | No | No |
| PN | 134 | 13: 27: 25.0 | -47: 37: 15.1 | 11.10 | 0.21 0.05 | No | No |
| PN | 113 | 13: 27: 00.3 | -47: 37: 15.2 | 7.51 | 0.15 0.04 | No | Yes |
| PN | 81 | 13: 26: 36.4 | -47: 37: 30.2 | 5.59 | 0.25 0.05 | Yes | No |
| Instrument | Source | RA | Dec | Position | Rate | MOS1 | MOS2 |
|---|---|---|---|---|---|---|---|
| ID | h m s | Error (″) | detection | detection | |||
| PN | 128 | 13: 26: 24.1 | -47: 37: 45.7 | 9.76 | 0.23 0.05 | No | No |
| PN | 19 | 13: 26: 07.4 | -47: 38: 01.3 | 2.31 | 1.15 0.10 | Yes | Yes |
| PN | 69 | 13: 27: 33.4 | -47: 38: 35.0 | 5.55 | 0.48 0.07 | Yes | No |
| PN | 58 | 13: 26: 32.4 | -47: 38: 50.7 | 4.94 | 0.38 0.06 | No | Yes |
| PN | 83 | 13: 27: 22.5 | -47: 39: 46.4 | 5.07 | 0.45 0.07 | No | No |
| PN | 53 | 13: 27: 01.2 | -47: 40: 55.9 | 4.34 | 0.57 0.07 | Yes | Yes |
| PN | 66 | 13: 26: 57.9 | -47: 41: 22.4 | 6.22 | 0.54 0.07 | No | Yes |
| PN | 125 | 13: 26: 33.1 | -47: 41: 29.2 | 49.94 | 0.29 0.06 | No | No |
| PN | 112 | 13: 27: 03.3 | -47: 42: 41.9 | 8.30 | 0.46 0.07 | No | No |
| MOS | 7 | 13: 25: 52.1 | -47: 19: 09.5 | 0.91 | 2.30 0.09 | Yes | Yes |
| MOS | 63 | 13: 25: 40.6 | -47: 22: 08.4 | 4.28 | 0.23 0.04 | Yes | Yes |
| MOS | 48 | 13: 25: 34.5 | -47: 25: 58.5 | 3.58 | 0.28 0.04 | Yes | Yes |
| MOS | 13 | 13: 26: 20.4 | -47: 30: 03.8 | 1.57 | 0.40 0.03 | Yes | Yes |
| MOS | 89 | 13: 26: 25.7 | -47: 39: 04.5 | 4.63 | 0.12 0.03 | Yes | Yes |
| MOS | 55 | 13: 26: 10.4 | -47: 39: 10.8 | 3.67 | 0.27 0.04 | Yes | Yes |
| MOS | 71 | 13: 26: 10.6 | -47: 40: 28.5 | 5.08 | 0.21 0.04 | Yes | Yes |
| Source | RA | Dec | Chandra | Chandra | Position | Previous |
|---|---|---|---|---|---|---|
| ID | RA | Dec | error (″) | ID | ||
| h m s | h m s | (RA/Dec) | ||||
| 3 | 13: 27: 27.7 | -47: 19: 08.8 | … | … | … | 4,D |
| 7 | 13: 25: 52.1 | -47: 19: 09.5 | … | … | … | 3,A |
| 17 | 13: 26: 23.5 | -47: 19: 27.9 | 13: 26: 23.5 | -47: 19: 24.1 | 0.52/0.45 | … |
| 28 | 13: 26: 46.3 | -47: 19: 47.4 | 13: 26: 46.2 | -47: 19: 45.9 | 0.68/0.39 | 18 |
| 31 | 13: 26: 38.5 | -47: 20: 01.7 | 13: 26: 38.5 | -47: 19: 58.3 | 0.68/0.48 | … |
| 73 | 13: 26: 35.7 | -47: 20: 57.4 | 13: 26: 35.2 | -47: 20: 52.8 | 1.28/0.64 | … |
| 68 | 13: 27: 10.2 | -47: 21: 29.2 | 13: 27: 09.9 | -47: 21: 27.7 | 0.78/0.47 | … |
| 32 | 13: 26: 54.5 | -47: 22: 04.7 | 13: 26: 54.5 | -47: 22: 04.6 | 0.24/0.10 | … |
| 15 | 13: 26: 41.5 | -47: 22: 16.5 | 13: 26: 41.5 | -47: 22: 16.3 | 0.52/0.31 | … |
| 39 | 13: 26: 23.2 | -47: 22: 52.7 | 13: 26: 23.1 | -47: 22: 51.2 | 0.73/0.80 | … |
| 18 | 13: 27: 21.2 | -47: 23: 24.4 | 13: 27: 21.1 | -47: 23: 24.5 | 0.63/0.38 | 19 |
| 41 | 13: 27: 07.9 | -47: 23: 35.3 | 13: 27: 08.0 | -47: 23: 33.6 | 0.65/0.39 | … |
| 67 | 13: 26: 41.3 | -47: 24: 05.0 | 13: 26: 41.2 | -47: 24: 00.9 | 0.87/0.58 | … |
| 79 | 13: 26: 12.8 | -47: 24: 16.6 | 13: 26: 12.8 | -47: 24: 13.6 | 0.79/0.59 | … |
| 110 | 13: 27: 12.1 | -47: 24: 22.9 | 13: 27: 12.4 | -47: 24: 24.9 | 1.04/0.78 | … |
| 94 | 13: 27: 28.5 | -47: 24: 25.2 | 13: 27: 28.4 | -47: 24: 22.2 | 0.89/0.58 | … |
| 126 | 13: 26: 37.0 | -47: 24: 30.5 | 13: 26: 37.3 | -47: 24: 31.3 | 1.07/0.62 | … |
| 59 | 13: 26: 31.4 | -47: 24: 43.6 | 13: 26: 31.3 | -47: 24: 39.4 | 0.62/0.53 | … |
| 82 | 13: 27: 06.3 | -47: 25: 37.8 | 13: 27: 06.4 | -47: 25: 39.5 | 0.56/0.69 | … |
| 6 | 13: 27: 29.4 | -47: 25: 55.4 | 13: 27: 29.3 | -47: 25: 54.8 | 0.28/0.15 | 6 |
| 49 | 13: 26: 28.7 | -47: 26: 33.3 | 13: 26: 28.7 | -47: 26: 27.3 | 0.64/0.23 | … |
| 103 | 13: 26: 45.4 | -47: 26: 53.6 | 13: 26: 45.4 | -47: 26: 52.4 | 1.05/0.65 | … |
| 44 | 13: 26: 52.6 | -47: 27: 15.9 | 13: 26: 52.9 | -47: 27: 15.7 | 1.17/0.52 | … |
| 24 | 13: 26: 40.8 | -47: 27: 38.6 | 13: 26: 40.5 | -47: 27: 38.7 | 1.60/0.91 | … |
| 61 | 13: 26: 52.5 | -47: 27: 39.1 | 13: 26: 52.6 | -47: 27: 38.5 | 1.01/0.50 | … |
| 76 | 13: 26: 04.2 | -47: 27: 41.6 | 13: 26: 04.4 | -47: 27: 42.1 | 0.65/0.78 | … |
| 47 | 13: 27: 14.5 | -47: 28: 31.3 | 13: 27: 14.5 | -47: 28: 28.8 | 1.01/0.77 | … |
| 33 | 13: 25: 52.7 | -47: 28: 55.4 | … | … | … | 8 |
| 92 | 13: 26: 44.3 | -47: 28: 57.4 | 13: 26: 44.3 | -47: 28: 56.2 | 0.71/0.68 | … |
| 5 | 13: 26: 53.5 | -47: 29: 01.3 | 13: 26: 53.5 | -47: 29: 00.8 | 0.16/0.07 | 9a,C |
| 4 | 13: 26: 19.7 | -47: 29: 11.5 | 13: 26: 19.7 | -47: 29: 11.2 | 0.15/0.12 | 7,B |
| 101 | 13: 26: 37.9 | -47: 29: 11.3 | 13: 26: 38.0 | -47: 29: 10.7 | 1.28/0.79 | … |
| 51 | 13: 26: 06.2 | -47: 29: 18.7 | 13: 26: 05.9 | -47: 29: 22.3 | 0.70/0.74 | … |
| 2 | 13: 26: 52.2 | -47: 29: 36.1 | 13: 26: 52.2 | -47: 29: 36.1 | 0.15/0.04 | 9b,C |
| 72 | 13: 26: 34.5 | -47: 29: 57.3 | 13: 26: 34.4 | -47: 29: 55.8 | 0.20/0.18 | … |
| 13 | 13: 26: 20.4 | -47: 30: 03.8 | 13: 26: 20.4 | -47: 30: 04.0 | 0.19/0.19 | … |
| 137 | 13: 26: 15.5 | -47: 30: 15.1 | 13: 26: 16.7 | -47: 30: 56.3 | 1.42/0.52 | … |
| 84 | 13: 27: 40.0 | -47: 30: 24.0 | 13: 27: 39.6 | -47: 30: 24.4 | 1.30/0.90 | … |
| 60 | 13: 26: 34.2 | -47: 30: 34.7 | 13: 26: 34.4 | -47: 30: 34.5 | 0.46/0.33 | … |
| 127 | 13: 27: 04.5 | -47: 30: 38.2 | 13: 27: 04.6 | -47: 30: 37.0 | 0.78/0.68 | … |
| 117 | 13: 26: 23.5 | -47: 30: 49.4 | 13: 26: 23.5 | -47: 30: 44.2 | 0.70/0.59 | … |
| 20 | 13: 26: 37.4 | -47: 30: 52.9 | 13: 26: 37.4 | -47: 30: 54.5 | 0.38/0.22 | … |
| 38 | 13: 26: 55.0 | -47: 31: 13.2 | 13: 26: 55.0 | -47: 31: 13.7 | 0.59/0.28 | … |
| 9 | 13: 26: 48.7 | -47: 31: 26.2 | 13: 26: 48.8 | -47: 31: 26.0 | 0.43/0.20 | 21 |
| 12 | 13: 27: 27.4 | -47: 31: 33.7 | 13: 27: 27.4 | -47: 31: 33.2 | 0.41/0.43 | … |
| 121 | 13: 25: 50.9 | -47: 31: 38.9 | 13: 25: 48.9 | -47: 31: 27.4 | 0.66/0.66 | … |
| 108 | 13: 26: 46.6 | -47: 31: 40.5 | 13: 26: 46.5 | -47: 31: 44.4 | 1.25/0.70 | … |
| 36 | 13: 26: 50.8 | -47: 31: 47.5 | 13: 26: 51.1 | -47: 31: 45.8 | 0.27/0.28 | … |
| 114 | 13: 27: 14.9 | -47: 31: 50.0 | 13: 27: 14.7 | -47: 31: 49.6 | 1.09/0.46 | … |
| 74 | 13: 27: 21.7 | -47: 32: 07.3 | 13: 27: 21.5 | -47: 32: 05.9 | 1.20/0.40 | … |
| 35 | 13: 26: 49.6 | -47: 31: 53.2 | 13: 26: 49.5 | -47: 31: 47.8 | 1.22/0.46 | … |
| 57 | 13: 26: 49.6 | -47: 32: 13.4 | 13: 26: 49.5 | -47: 32: 13.6 | 0.43/0.15 | … |
| Source | RA | Dec | Chandra | Chandra | Position | Previous |
|---|---|---|---|---|---|---|
| ID | RA | Dec | error (″) | ID | ||
| h m s | h m s | (RA/Dec) | ||||
| 8 | 13: 26: 25.1 | -47: 32: 28.7 | 13: 26: 25.1 | -47: 32: 28.3 | 0.229/0.20 | 10 |
| 16 | 13: 26: 43.9 | -47: 32: 31.0 | 13: 26: 44.1 | -47: 32: 32.3 | 0.315/0.23 | … |
| 11 | 13: 27: 11.9 | -47: 32: 41.4 | 13: 27: 11.7 | -47: 32: 41.6 | 0.249/0.22 | … |
| 21 | 13: 25: 57.2 | -47: 32: 51.6 | 13: 25: 57.2 | -47: 32: 50.8 | 0.373/0.38 | … |
| 1 | 13: 26: 01.5 | -47: 33: 07.4 | 13: 26: 01.5 | -47: 33: 06.3 | 0.164/0.15 | 11 |
| 34 | 13: 27: 10.0 | -47: 33: 21.8 | 13: 27: 10.0 | -47: 33: 21.8 | 0.568/0.34 | … |
| 14 | 13: 28: 09.1 | -47: 33: 27.0 | … | … | … | 12 |
| 25 | 13: 26: 11.5 | -47: 34: 04.2 | 13: 26: 11.5 | -47: 34: 03.4 | 0.401/0.34 | … |
| 40 | 13: 26: 26.9 | -47: 34: 09.1 | 13: 26: 26.7 | -47: 34: 09.5 | 0.794/0.45 | … |
| 22 | 13: 26: 13.6 | -47: 34: 43.2 | 13: 26: 13.6 | -47: 34: 41.5 | 0.561/0.44 | … |
| 30 | 13: 26: 27.4 | -47: 34: 54.9 | 13: 26: 27.6 | -47: 34: 56.9 | 0.361/0.29 | … |
| 23 | 13: 27: 12.7 | -47: 34: 56.4 | 13: 27: 12.9 | -47: 34: 57.1 | 0.324/0.19 | … |
| 52 | 13: 26: 59.2 | -47: 34: 59.0 | 13: 26: 59.3 | -47: 34: 58.2 | 0.744/0.48 | … |
| 45 | 13: 26: 39.1 | -47: 36: 33.5 | 13: 26: 39.2 | -47: 36: 32.3 | 0.727/0.46 | … |
| 10 | 13: 26: 11.4 | -47: 37: 11.3 | … | … | … | 13 |
| 113 | 13: 27: 00.3 | -47: 37: 15.2 | 13: 27: 00.4 | -47: 37: 15.2 | 0.998/0.64 | … |
NOTE - We have indicated in this table only the sources correlated with other X-ray observations. There are three OGLEGC sources which are associated with X-ray sources (OGLEGC 15 and 22 with two Chandra sources, OGLEGC 30 with XMM-Newton source 29). Their positions from Kaluzny et al. (1996) are :
OGLEGC15 13h 26m 47.42s -47 36′ 00.4″
OGLEGC22 13h 26m 08.33s -47 30′ 33.0″
OGLEGC30 13h 26m 53.33s -47 18′ 22.9″
| Source | XMM | Chandra | Half mass |
|---|---|---|---|
| ID | flux | flux | radius |
| source | |||
| 73 | 7.1 | 3.3 | No |
| 32 | 12.6 | 67.2 | No |
| 39 | 14.2 | 5.3 | No |
| 18 | 25.1 | 11.2 | No |
| 49 | 4.0 | 15.0 | Yes |
| 24 | 14.7 | 4.8 | Yes |
| 47 | 7.7 | 2.3 | No |
| 13 | 11.0 | 35.6 | No |
| 117 | 4.0 | 1.2 | No |
| 9 | 40.0 | 13.7 | Yes |
| 108 | 4.3 | 2.0 | Yes |
| 8 | 57.4 | 20.7 | No |
| 23 | 21.1 | 43.3 | No |
| Source | Best fit | NH | Model | Degree of | Bolometric | |
| ID | model | ( cm-2) | parameter | freedom | luminosity | |
| 1 | BB | 1.08 | 55 | 191 7 | ||
| TB | 1.00 | 55 | 302 11 | |||
| PL | 1.03 | 55 | 339 12 | |||
| 2 | TB | (8.4) | 0.72 | 31 | 67 3 | |
| PL | (8.4) | 0.68 | 31 | 72 3 | ||
| 3 | 2T | 1.08 | 28 | 136 7 | ||
| 5 | TB | (8.4) | 0.78 | 17 | 27 2 | |
| PL | (8.4) | 0.80 | 31 | 30 2 | ||
| 6 | TB | (8.4) | 0.83 | 17 | 27 3 | |
| PL | (8.4) | 0.81 | 17 | 32 3 | ||
| 8 | TB | (8.4) | 0.98 | 19 | 28 2 | |
| PL | (8.4) | 0.81 | 19 | 32 3 | ||
| 9 | TB | 0.58 | 10 | 23 3 | ||
| TB | (8.4) | 0.79 | 11 | 23 3 | ||
| PL | 2.0 0.6 | 0.51 | 10 | 29 4 | ||
| PL | (8.4) | 0.96 | 11 | 29 4 | ||
| 12 | BB | (8.4) | 1.54 | 9 | 5 1 | |
| TB | (8.4) | 1.22 | 9 | 7 2 | ||
| PL | (8.4) | 1.10 | 9 | 9 2 | ||
| 15 | PL | (8.4) | 0.42 | 6 | 21 4 | |
| 18 | TB | (8.4) | 1.12 | 5 | 10 2 | |
| PL | (8.4) | 1.01 | 5 | 12 2 | ||
| Source | Best fit | NH | Model | C statistic | Number of | Bolometric |
| ID | model | ( cm-2) | parameter | PHA bins | luminosity | |
| 11 | TB | (8.4) | C 8.29 | 11 | 8 2 | |
| PL | (8.4) | C 8.96 | 11 | 10 2 | ||
| 13 | PL | (8.4) | C 1.16 | 8 | 33 5 | |
| 20 | BB | (8.4) | C 16.37 | 11 | 6 2 | |
| TB | C 16.70 | 11 | 9 2 | |||
| 22 | PL | (8.4) | C 9.18 | 11 | 12 2 | |
| 23 | TB | (8.4) | C 12.58 | 10 | 5 2 | |
| PL | (8.4) | C 12.77 | 10 | 6 2 | ||
| 24, high state | PL | (8.4) | C 16.2 | 14 | 18 2 | |
| low state | PL | (8.4) | C 10.2 | 11 | 4 2 | |
| 25 | TB | (8.4) | C 2.50 | 5 | 6 2 | |
| PL | (8.4) | C 1.81 | 5 | 8 2 |
| Radius | Temp. | Distance | NH | 0.1-5.0 keV | Reference | |
|---|---|---|---|---|---|---|
| R∞ (km) | Teff,∞ (eV) | (kpc) | ( cm-2) | luminosity | ||
| 14.3 2.1 | (5) | (9) | … | Rutledge et al. (2002) | ||
| 13.6 0.3 | (5.3) | 9.0 2.5 | 1.00 | 3.2 0.2 | This work |