11email: bettoni@pd.astro.it, falomo@pd.astro.it, fasano@pd.astro.it
(2)Istituto di Radioastronomia di Bologna and Dipartimento di Astronomia, Universitá di Bologna 11email: fgovoni@ira.bo.cnr.it
The black hole mass of low redshift radiogalaxies
We make use of two empirical relations between the black hole mass and the global properties (bulge luminosity and stellar velocity dispersion) of nearby elliptical galaxies, to infer the mass of the central black hole () in low redshift radiogalaxies. Using the most recent determinations of black hole masses for inactive early type galaxies we show that the bulge luminosity and the central velocity dispersion are almost equally correlated (similar scatter) with the central black-hole mass. Applying these relations to two large and homogeneous datasets of radiogalaxies we find that they host black-holes whose mass ranges between to (average 8.9). is found to be proportional to the mass of the bulge (). The distribution of the ratio / has a mean value of 8 and shows a scatter that is consistent with that expected from the associated errors. At variance with previous claims no significant correlation is instead found between (or ) and the radio power at 5 GHz.
Key Words.:
black hole physics - galaxies:active - galaxies:nuclei - radio galaxies1 Introduction
There is a large consensus about the existence of super massive black holes (SBHs) at the center of nearby inactive galaxies as well as in the nuclei of active galaxies and quasars (see e.g. for a recent review Ferrarese (2002)). A large body of data, in particular based on high resolution HST observations, is now available (see e.g. Kormendy & Gebhardt (2001)) to support the presence of such massive black holes (BH) using different techniques.
It is believed that SBHs play an important role in the formation and evolution of massive galaxies and also to be a key component for the development of the nuclear activity. However in spite of this apparently ubiquitous presence of SBHs in galaxies, our understanding on how the galaxies and their central BHs are linked in the process of formation of the observed structures is still poor (see Silk & Rees (1998); Haehlnet & Kauffmann (2000); Adams et al. (2001)).
The most important result obtained from the measured BH masses in nearby galaxies is the existence of a significant correlation between the black hole mass () and the mass of the bulge component () of the host galaxy (). From the observational point of view this correlation is translated into relationships between and bulge luminosity (Magorrian et al. (1998), Kormendy & Gebhardt (2001)) and between and the stellar velocity dispersion (Ferrarese & Merritt (2000); Gebhardt et al. (2000) ).
Although based on a small number (30) of nearby galaxies for which direct dynamical measurements of have been secured, and in spite of their scatter [0.4 in ], these empirical relationships offer a new tool for evaluating in various types of AGN, provided that bulge luminosities and/or velocity dispersion be available (see also McLure & Dunlop (2002), Falomo et al. (2002)).
In this paper we make use of such relationships to investigate the BH mass distribution of two large and homogeneous datasets of low redshift radiogalaxies (RG) for which we have previously studied the morphological, structural, photometrical and kinematical properties (Fasano et al. (1996); Govoni et al. 2000a ,b; Bettoni et al. (2001)). The derived BH masses of radiogalaxies are then used to investigate the connections between , the mass of the galaxy and the radio power.
To this aim we first describe our samples (Section 2) and revisit the relations - and - for nearby early-type galaxies (Section 3). Then we use these relationships to evaluate of radio galaxies (Section 4) and to study the connections between and the mass of the bulge component of the host galaxy and between and the radio luminosity. A summary of the main conclusions of this study is reported in Section 5. In our analysis we assume H0=50 Km s-1 Mpc-1 and =0.
2 The Samples
2.1 The sample of inactive nearby ellipticals
| Object | Type | D | MB | Log | Log() | ||||
|---|---|---|---|---|---|---|---|---|---|
| Mpc | (km) | (km) | (kpc) | ||||||
| (1) | (2) | (3) | (4) | (5) | (6) | (7) | (8) | (9) | (10) |
| N221/M32 | cE2 | 0.81 | 8.52 | 1.53 | 0.55 | -16.02 | 76 | -0.82 | 6.40 |
| N821 | E6 | 24.10 | 11.49 | 1.68 | 0.55 | -20.42 | 196 | 0.72 | 7.57 |
| N2778 | E | 22.90 | 13.22 | 1.64 | 0.17 | -18.58 | 171 | 0.26 | 7.15 |
| N3377 | E5+ | 11.20 | 11.07 | 1.37 | 0.21 | -19.18 | 131 | 0.26 | 8.00 |
| N3379 | E1 | 10.60 | 10.32 | 1.57 | 0.21 | -19.81 | 210 | 0.26 | 8.00 |
| N3608 | E2 | 23.00 | 11.64 | 1.51 | 0.13 | -20.17 | 206 | 0.59 | 8.28 |
| N4261 | E2 | 31.60 | 11.27 | 1.61 | 0.13 | -21.23 | 290 | 0.77 | 8.72 |
| N4291 | E | 26.20 | 12.37 | 1.60 | 0.21 | -19.72 | 269 | 0.27 | 8.49 |
| N4374 | E1 | 18.40 | 10.09 | 1.61 | 0.21 | -21.23 | 286 | 0.69 | 8.63 |
| N4473 | E5 | 15.70 | 11.12 | 1.56 | 0.21 | -19.86 | 188 | 0.28 | 8.04 |
| N4486 | E1 | 16.70 | 9.40 | 1.63 | 0.21 | -21.71 | 345 | 0.92 | 9.48 |
| N4564 | E | 15.00 | 11.94 | 1.57 | 0.17 | -18.94 | 153 | 0.20 | 7.75 |
| N4649 | E2 | 16.80 | 9.72 | 1.64 | 0.17 | -21.41 | 331 | 0.78 | 9.30 |
| N4697 | E6 | 11.70 | 9.99 | 1.54 | 0.17 | -20.35 | 163 | 0.63 | 8.23 |
| N4742 | E4 | 15.50 | 11.92 | 1.33 | 0.29 | -19.03 | 93 | -0.05 | 7.15 |
| N5128 | 4.20 | 7.30 | 1.60 | 0.50 | -20.82 | 145 | 0.82(a) | 8.38 | |
| N5845 | E* | 25.90 | 13.15 | 1.65 | 0.34 | -18.92 | 275 | -0.29 | 8.38 |
| N6251 | E | 106.00 | 13.18 | 1.60 | 0.42 | -21.95 | 297 | 1.31(b) | 8.72 |
| N7052 | E | 58.70 | 12.41 | 1.60 | 0.80 | -21.43 | 261 | 0.82 | 8.52 |
| I1459 | E3 | 29.20 | 10.88 | 1.59 | 0.07 | -21.45 | 312 | 0.74 | 9.40 |
-
(a) from Dufour et al. (1979), (b) from Owen & Laing (1989), (c) from Gonzalez-Serrano et al. (1993).
In order to investigate the relations - and - of E-type galaxies we have considered a sample of 20 objects of E-type morphology (excluding lenticulars) in the Kormendy & Gebhardt (2001) galaxy list with measured BH masses. The Milky Way was therefore not considered. In Table 1 we report the relevant data for this sample: columns 1 and 2 give the name and the morphological type from RC3; columns 3 the distance, derived from Surface Brightness Fluctuations (SBF, Tonry et al. (2001)); columns 4, 5, 6, 7 report the adopted apparent total B magnitude corrected for extinction, the color, the galactic extinction, derived from the Bell Laboratories Survey of neutral Hydrogen (Stark et al. (1992)) and the absolute B magnitude respectively. The band bulge magnitudes were taken from Faber et al. (1997) for all the 20 objects but for NGC 5128, NGC 6251 and NGC 7052 we adopted the magnitudes given in RC3 (de Vaucouleurs et al. (1991)). Note that for this sample the bulge magnitude is coincident with the total magnitude of the galaxy since the galaxy luminosity profile is always well represented by an law. The adopted values for the velocity dispersion (from Ferrarese & Merritt (2000)), effective radius (from Faber et al. 1989 and using the distance in column 3) and are reported in columns 8, 9 and 10. The latter values are taken from Tremaine et al. (2002) that give the most recent revision of for this data set.
2.2 The radio-galaxies sample

| Object | z | MR | Log() | Log() | Log() | Ref.a | Log | Log | Log |
|---|---|---|---|---|---|---|---|---|---|
| host | total | core | from | from M(bulge) | |||||
| km | (W/Hz) | (W/Hz) | |||||||
| (1) | (2) | (3) | (4) | (5) | (6) | (7) | (8) | (9) | (10) |
| 0055-016 | 0.045 | -24.08 | 2.48 | 25.30 | 23.93 | WP | 9.00 | 8.99 | 12.10 |
| 0131-367 | 0.030 | -24.10 | 2.40 | 25.21 | 23.18 | WP | 8.64 | 9.01 | 11.92 |
| 0257-398 | 0.066 | -23.73 | 2.34 | 24.94 | 22.9 | EK | 8.79 | 8.80 | 11.75 |
| 0312-343 | 0.067 | -24.02 | 2.41 | 24.66 | 23.71 | EK | 8.68 | 8.95 | 12.18 |
| 0325+023 | 0.030 | -23.41 | 2.34 | 24.90 | 23.80 | WP | 8.37 | 8.66 | 11.93 |
| 0449-175 | 0.031 | -23.97 | 2.20 | 24.12 | 22.63 | EK | 8.04 | 8.94 | 11.73 |
| 0546-329 | 0.037 | -24.49 | 2.59 | 24.13 | 23.29 | EK | 9.49 | 9.20 | 12.46 |
| 0548-317 | 0.034 | -23.35 | 2.09 | 24.35 | 22.49 | EK | 9.31 | 8.63 | 12.12 |
| 0718-340 | 0.029 | -24.20 | 2.52 | 24.55 | 23.05 | EK | 9.32 | 9.06 | 12.20 |
| 0915-118 | 0.054 | -24.46 | 2.44 | 26.26 | 24.46 | WP | 8.85 | 9.17 | 12.26 |
| 0940-304 | 0.038 | -23.83 | 2.59 | 24.09 | 23.48 | EK | 9.50 | 8.87 | 12.11 |
| 1043-290 | 0.060 | -24.71 | 2.36 | 24.66 | 23.96 | EK | 8.98 | 9.30 | 12.57 |
| 1107-372 | 0.010 | -24.61 | 2.47 | 23.07 | 21.64 | EK | 8.96 | 9.27 | 12.07 |
| 1123-351 | 0.032 | -24.67 | 2.65 | 24.56 | 23.50 | EK | 9.75 | 9.29 | 12.72 |
| 1258-321 | 0.017 | -24.48 | 2.42 | 24.00 | 23.10 | EK | 8.75 | 9.20 | 12.12 |
| 1333-337 | 0.013 | -24.55 | 2.46 | 24.67 | 23.34 | WP | 9.04 | 9.24 | 12.17 |
| 1400-337 | 0.014 | -25.02 | 2.49 | 23.52 | 22.11 | EK | 9.05 | 9.47 | 12.42 |
| 1404-267 | 0.022 | -24.00 | 2.47 | 23.93 | 23.78 | EK | 8.98 | 8.96 | 12.19 |
| 1514+072 | 0.034 | -24.86 | 2.43 | 24.70 | 24.31 | WP | 8.57 | 9.38 | 12.36 |
| 1521-300 | 0.020 | -22.01 | 2.22 | 23.83 | 23.43 | EK | 7.82 | 7.97 | 11.04 |
| 2236-176 | 0.070 | -24.88 | 2.39 | 25.08 | 23.35 | EK | 8.58 | 9.37 | 12.32 |
| 2333-327 | 0.052 | -23.77 | 2.43 | 24.20 | 23.17 | EK | 8.77 | 8.83 | 11.90 |
| Smith et al.(1990) | |||||||||
| 3C29 | 0.044 | -24.18 | 2.32 | 25.30 | 23.92 | WP | 8.27 | 9.04 | 11.88 |
| 3C31 | 0.016 | -23.69 | 2.40 | 24.41 | - | KK | 8.62 | 8.81 | 12.04 |
| 3C33 | 0.058 | -23.47 | 2.36 | 25.91 | - | KK | 8.48 | 8.68 | 11.86 |
| 3C62 | 0.146 | -23.82 | 2.44 | 26.29 | 24.42 | WP | 8.81 | 8.81 | 12.20 |
| 3C76.1 | 0.032 | -23.21 | 2.30 | 24.82 | - | KK | 8.20 | 8.56 | 11.45 |
| 3C78 | 0.028 | -24.60 | 2.42 | 25.13 | 24.55 | WP | 8.73 | 9.26 | 11.99 |
| 3C84 | 0.017 | -24.37 | 2.40 | 25.81 | - | BB | 8.61 | 9.15 | 12.08 |
| 3C88 | 0.030 | -23.49 | 2.28 | 24.91 | 23.81 | WP | 8.08 | 8.70 | 11.99 |
| 3C89 | 0.138 | -24.10 | 2.40 | 25.87 | - | G1 | 8.64 | 8.95 | 12.47 |
| 3C98 | 0.030 | -22.83 | 2.24 | 25.32 | - | KK | 7.91 | 8.37 | 11.56 |
| 3C120 | 0.033 | -23.78 | 2.30 | 25.63 | 25.24 | WP | 8.20 | 8.84 | 11.81 |
| 3C192 | 0.061 | -23.21 | 2.28 | 25.54 | - | KK | 8.12 | 8.55 | 11.57 |
| 3C196.1 | 0.199 | -24.66 | 2.32 | 26.02 | - | G1 | 8.29 | 9.21 | 12.17 |
| 3C223 | 0.138 | -23.49 | 2.31 | 26.07 | - | KK | 8.22 | 8.65 | 11.87 |
| 3C293 | 0.046 | -23.95 | 2.27 | 25.24 | - | KK | 8.04 | 8.92 | 11.48 |
| 3C305 | 0.042 | -24.16 | 2.25 | 24.91 | - | BB | 7.97 | 9.03 | 11.31 |
| Object | z | MR | Log() | Log() | Log() | Ref.a | Log | Log | Log |
|---|---|---|---|---|---|---|---|---|---|
| host | total | core | from | from M(bulge) | |||||
| km | (W/Hz) | (W/Hz) | |||||||
| (1) | (2) | (3) | (4) | (5) | (6) | (7) | (8) | (9) | (10) |
| 3C338 | 0.031 | -24.9 | 2.46 | 24.29 | - | BB | 8.93 | 9.40 | 12.55 |
| 3C388 | 0.090 | -24.92 | 2.56 | 25.83 | - | KK | 9.39 | 9.39 | 12.83 |
| PKS0634-206 | 0.056 | -24.26 | 2.29 | 25.7 | 23.23 | WP | 8.15 | 9.07 | 11.52 |
| PKS2322-122 | 0.081 | -24.33 | 2.35 | 25.11 | - | G2 | 8.42 | 9.10 | 12.24 |
| 3C444 | 0.152 | -24.77 | 2.19 | 26.4 | 23.37 | WP | 7.69 | 9.28 | 12.21 |
| 3C449 | 0.016 | -22.86 | 2.35 | 24.25 | - | KK | 8.42 | 8.39 | 12.19 |
| Gonzalez-Serrano & Carballo (2000) | |||||||||
| NGC507 | 0.015 | -23.94 | 2.52 | - | - | - | 9.18 | 8.93 | 12.10 |
| NGC703 | 0.015 | -23.98 | 2.38 | - | - | - | 8.57 | 8.95 | 12.21 |
| gin116 | 0.033 | -24.01 | 2.45 | 23.76 | - | BB | 8.90 | 8.96 | 12.00 |
| NGC4869 | 0.023 | -23.03 | 2.30 | 23.38 | - | BB | 8.19 | 8.48 | 11.45 |
| NGC4874 | 0.025 | -24.89 | 2.42 | 23.33 | - | BB | 8.76 | 9.40 | 12.40 |
| NGC6086 | 0.032 | -24.04 | 2.51 | - | - | - | 9.14 | 8.98 | 12.26 |
| NGC6137 | 0.031 | -25.57 | 2.47 | 23.87 | - | BB | 8.97 | 9.74 | 12.51 |
| Ledlow & Owen (1995) | |||||||||
| 0039-095B | 0.055 | -22.69 | 2.45 | 23.81 | - | G1 | 8.86 | 8.29 | 11.32 |
| 0053-015 | 0.038 | -24.03 | 2.47 | 24.66 | - | G1 | 8.98 | 8.97 | 12.20 |
| 0053-016 | 0.043 | -23.33 | 2.40 | 24.57 | - | G1 | 8.63 | 8.62 | 11.72 |
| 0110+152 | 0.044 | -23.87 | 2.29 | 24.36 | - | BB | 8.16 | 8.88 | 11.90 |
| 0112-000 | 0.045 | -22.94 | 2.40 | 23.58 | - | BB | 8.65 | 8.42 | 11.67 |
| 0122+084 | 0.049 | -24.71 | 2.56 | - | - | - | 9.39 | 9.30 | 12.69 |
| 0147+360 | 0.017 | -23.00 | 2.38 | - | - | - | 8.58 | 8.46 | 11.43 |
| 0306-237 | 0.067 | -23.44 | 2.40 | - | - | - | 8.63 | 8.66 | 11.67 |
| 0431-133 | 0.033 | -24.46 | 2.43 | 23.32 | - | G2 | 8.78 | 9.18 | 12.31 |
| 0431-134 | 0.035 | -22.75 | 2.35 | 24.05 | - | G2 | 8.40 | 8.33 | 11.47 |
| 1510+076 | 0.043 | -22.39 | 2.53 | - | - | - | 9.22 | 8.15 | 11.57 |
| 1520+087 | 0.034 | -24.20 | 2.34 | - | - | - | 8.38 | 9.05 | 12.25 |
| 1602+178A | 0.031 | -22.80 | 2.33 | - | - | - | 8.32 | 8.36 | 11.57 |
| 1610+296 | 0.032 | -23.88 | 2.51 | - | - | - | 9.14 | 8.90 | 11.90 |
| 2322+143a | 0.045 | -22.36 | 2.31 | 23.99 | - | BB | 8.24 | 8.13 | 11.24 |
| 2335+267 | 0.030 | -24.60 | 2.54 | 25.13 | - | BB | 9.28 | 9.26 | 12.49 |
| Faber et al. (1989) | |||||||||
| NGC315 | 0.016 | -25.13 | 2.49 | 24.15 | - | BB | 9.31 | 9.53 | 12.57 |
| NGC741 | 0.018 | -24.73 | 2.45 | 23.65 | - | G1 | 8.86 | 9.33 | 12.37 |
| NGC4839 | 0.026 | -23.82 | 2.39 | 22.94 | - | BB | 8.71 | 8.87 | 12.20 |
| NGC7626 | 0.010 | -22.98 | 2.51 | 23.14 | - | G1 | 8.51 | 8.46 | 11.85 |
| 3C40 | 0.017 | -23.66 | 2.23 | 24.43 | 23.15 | WP | 7.89 | 8.79 | 11.17 |
-
a)
KK-Küehr et al. 1981; G1-Griffith et al. 1995; G2-Griffith et al. 1994; BB-Becker et al. 1991
We have considered the following two samples of radio galaxies:
-
•
Sample A: this consists of 72 radio-galaxies at z0.2 with available values of the absolute magnitude MR, the effective radius and the velocity dispersion . We used this data in a previous work (Bettoni et al. (2001)) to study the Fundamental Plane of RGs. In this sample 22 objects were observed by us, 22 galaxies were taken from Smith et al. (1990)(SHI90), 16 from Ledlow & Owen (1995), 7 from Gonzales-Serrano & Carballo (2000) and 5 from Faber et al. (1989)(FA89). In Table 2 we report the relevant data for the radio-galaxies in this sample: in columns 1, 2 we give the name and the redshift; in column 3 we list the absolute R (Cousins) magnitude to which we have also applied a correction to set the host galaxy luminosity to the present epoch assuming a passive stellar evolution for massive ellipticals (Bressan et al. 1994). Columns 4, 5, 6 and 7 report the Log(), the total and core radio luminosity at 4800 MHz and the reference for these radio data. The velocity dispersion is normalized to a circular aperture of metric radius 1.19 kpc (Jørgensen et al. (1996)). This normalization is practically equivalent to that adopted by Ferrarese & Merritt (2000), who consider within an aperture radius of /8. The average difference between the two normalizations for our objects is 5 km/sec.
-
•
Sample B: this consists of 79 radiogalaxies at z0.1 for which we secured homogeneous photometric and structural parameters (Fasano et al. (1996); Govoni et al. 2000a ,b). These radio galaxies are extracted from two complete surveys of radio sources (Wall & Peacock (1985): WP, Ekers et al. (1989): EK) according to the specifications given in Fasano et al. (1996), Sample B has in common 22 objects with Sample A. In Table 3 we report the relevant data for this sample. In columns 1, 2 we give the name and the redshift; in columns 3, 4, 5 and 6 we list the absolute R magnitude, the total and core radio luminosity at 4800 MHz and the reference for the radio data.
3 The (host) and relations for normal, nearby ellipticals
Using the dataset of nearby inactive ellipticals described in Section 2.1 we have derived the best fit of the relations Log()-(host) and Log()-Log(). In order to obtain a relationship between and MR usable for =50 we need to apply a color correction (to convert the B magnitude into the R band) and a term that takes into account the consistency between the adopted distances of nearby galaxies (see Table 1) and the chosen value of . The latter term can be written as 5Log(/), where =74 km/sec/Mpc (Tonry et al. 2001). The color correction was derived from LEDA with the exception of NGC 4291 and of the three galaxies for which the B magnitude has been obtained from RC3. For these objects a standard color () was assumed (Fukugita et al. (1995)).
The data used to fit the two relations -MR(host) and are shown in Figure 1. The best fit to the data was derived following the procedure outlined in Fasano & Vio (1988), which takes into account the individual measurement errors in both coordinates and allows us to estimate the residual scatter .


The two fitted relations are:
| (1) |
r.m.s.=0.39
| (2) |
r.m.s.=0.41
where . The residual scatters of the two relations are 0.14(0.05) and 0.35(0.22), respectively. In both cases they turn out to be consistent with zero (within ), implying that the observed scatter is almost entirely accounted for by the uncertainty of the measurements. Both relations are in good agreement with the last determinations by McLure and Dunlop (2002) and Ferrarese (2002), respectively, once the different cosmology is taken into account. However, at variance with previous findings (Ferrarese & Merritt (2000), Kormendy & Gebhardt (2001)), luminosity and central velocity dispersion appear to be almost equally correlated (very similar scatter) with the black-hole mass. A similar result was found by McLure & Dunlop (2002) using a slightly different sample of E-type objects. We note, however, that our scatter (0.39 dex) is larger than that (0.31 dex) found by McLure & Dunlop (2002). Since the data used by these authors are not published it is not possible to further investigate the origin of this difference.
4 Results
4.1 The BH mass of radio galaxies
Here we use the relationships Log(bulge) and Log, derived in Section 3, (eq. 1 and eq. 2) to estimate the BH mass of the two samples (A and B) of radio galaxies defined in section 2.2. The BH masses derived from and from the MR are reported in columns 8 and 9 of Table 2. The comparison of the two determinations for the Sample A is shown in Figure 2. We find that the mean values of (8.660.44 from eq. 1 and 8.910.37 from eq. 2) are significantly different. This is mainly attributable to the systematically lower values of for the 26 radio galaxies in the sub-samples of SHI90 and FA89 (see figure 2). To further emphasize this point we plot in Fig 3 the values of versus MR (Faber-Jackson relation) for the RGs in Sample A and for normal ellipticals from Jørgensen et al. (1996, JFK96) sample.
It is clearly apparent that RGs belonging to the SHI90 and FA89 samples deviate systematically from the overall relation derived from fitting the data for the RGs in Sample A (excluding the SHI90 and FA89 galaxies) and for normal ellipticals from JFK96 (Log=-0.375-0.118MR). Note also that the galaxies in these datasets do not well agree with the other RGs of Sample A in the Fundamental Plane (Bettoni et al. 2001). Therefore, in the following analysis, we exclude the measurements of these 26 RGs. If we now consider the remaining 45 RGs in Sample 1 (hereafter reduced Sample 1) we obtain: =8.810.41 and =8.910.40. For Sample 2 was derived only from MR (eq 1). These values are given in Table 3. The mean value of =8.940.34 is in good agreement with those obtained for the reduced Sample A. In Figure 4 the distributions of for both samples are compared.
| Object | z | MR | Log() | Log() | Ref. | log |
|---|---|---|---|---|---|---|
| host | total | core | from M | |||
| (W/Hz) | (W/Hz) | |||||
| (1) | (2) | (3) | (4) | (5) | (6) | (7) |
| 0005-199 | 0.121 | -24.46 | 25.25 | 24.00 | EK | 9.20 |
| 0013-316 | 0.107 | -24.51 | 24.85 | 23.44 | EK | 9.23 |
| 0023-333 | 0.05 | -24.57 | 24.67 | 23.05 | EK | 9.26 |
| 0034-014 | 0.073 | -23.67 | 25.60 | 24.87 | WP | 8.81 |
| 0055-016 | 0.045 | -24.10 | 25.30 | 23.93 | WP | 9.02 |
| 0123-016 | 0.018 | -24.02 | 24.43 | 23.15 | WP | 8.98 |
| 0131-367 | 0.03 | -24.13 | 25.21 | 23.18 | WP | 9.04 |
| 0229-208 | 0.089 | -24.10 | 25.25 | 24.54 | EK | 9.02 |
| 0247-207 | 0.087 | -25.21 | 25.03 | 23.91 | EK | 9.58 |
| 0255+058 | 0.023 | -22.95 | 24.66 | 22.96 | WP | 8.45 |
| 0257-398 | 0.066 | -23.67 | 24.94 | 22.9 | EK | 8.81 |
| 0307-305 | 0.066 | -23.24 | 24.89 | 22.78 | EK | 8.59 |
| 0312-343 | 0.067 | -23.99 | 24.66 | 23.71 | EK | 8.97 |
| 0325+023 | 0.03 | -23.61 | 24.90 | 23.8 | WP | 8.78 |
| 0332-391 | 0.063 | -23.82 | 25.13 | 23.37 | EK | 8.88 |
| 0344-345 | 0.053 | -22.79 | 25.25 | 23.71 | EK | 8.37 |
| 0349-278 | 0.066 | -22.94 | 25.65 | 23.51 | EK | 8.44 |
| 0427-539 | 0.038 | -24.13 | 25.34 | 23.57 | WP | 9.04 |
| 0430+052 | 0.033 | -23.11 | 25.62 | 25.22 | WP | 8.53 |
| 0434-225 | 0.069 | -24.80 | 24.93 | 23.30 | EK | 9.37 |
| 0446-206 | 0.073 | -23.47 | 24.73 | 23.35 | EK | 8.71 |
| 0449-175 | 0.031 | -23.88 | 24.12 | 22.63 | EK | 8.91 |
| 0452-190 | 0.039 | -23.88 | 24.11 | 23.23 | EK | 8.91 |
| 0453-206 | 0.035 | -24.07 | 25.00 | 23.34 | WP | 9.01 |
| 0511-305 | 0.058 | -23.10 | 25.20 | 23.19 | EK | 8.52 |
| 0533-377 | 0.096 | -24.32 | 24.84 | 23.75 | EK | 9.13 |
| 0546-329 | 0.037 | -24.42 | 24.13 | 23.29 | EK | 9.18 |
| 0548-317 | 0.034 | -23.12 | 24.35 | 22.49 | EK | 8.53 |
| 0620-526 | 0.051 | -24.92 | 25.17 | 24.49 | WP | 9.43 |
| 0625-354 | 0.055 | -24.43 | 25.46 | 24.92 | WP | 9.19 |
| 0625-536 | 0.054 | -25.20 | 25.39 | 23.75 | WP | 9.57 |
| 0634-205 | 0.056 | -23.78 | 25.70 | 23.23 | EK | 8.86 |
| 0712-349 | 0.044 | -24.16 | 24.17 | 23.34 | EK | 9.05 |
| 0718-340 | 0.029 | -24.07 | 24.55 | 23.05 | EK | 9.01 |
| 0806-103 | 0.11 | -23.96 | 25.98 | 24.50 | WP | 8.95 |
| 0915-118 | 0.054 | -24.36 | 26.26 | 24.46 | WP | 9.15 |
| 0940-304 | 0.038 | -23.70 | 24.09 | 23.48 | EK | 8.82 |
| 0945+076 | 0.086 | -23.11 | 25.96 | 24.05 | WP | 8.53 |
| 1002-320 | 0.089 | -24.20 | 24.93 | 23.27 | EK | 9.07 |
| Object | z | Log() | Log() | Ref. | log | |
|---|---|---|---|---|---|---|
| host | total | core | M | |||
| (W/Hz) | (W/Hz) | |||||
| (1) | (2) | (3) | (4) | (5) | (6) | (7) |
| 1043-290 | 0.06 | -24.62 | 24.66 | 23.96 | EK | 9.28 |
| 1053-282 | 0.061 | -23.99 | 25.18 | 24.29 | EK | 8.97 |
| 1056-360 | 0.07 | -23.54 | 25.06 | 24.05 | EK | 8.74 |
| 1107-372 | 0.01 | -24.37 | 23.07 | 21.64 | EK | 9.16 |
| 1123-351 | 0.032 | -24.53 | 24.56 | 23.50 | EK | 9.23 |
| 1251-122 | 0.015 | -24.16 | 24.39 | 22.94 | WP | 9.05 |
| 1251-289 | 0.057 | -25.31 | 24.55 | 23.17 | EK | 9.63 |
| 1257-253 | 0.065 | -24.09 | 24.72 | 23.49 | EK | 9.02 |
| 1258-321 | 0.017 | -24.35 | 24.00 | 23.10 | EK | 9.15 |
| 1318-434 | 0.011 | -24.13 | 23.96 | 23.49 | WP | 9.04 |
| 1323-271 | 0.044 | -24.00 | 24.64 | 23.12 | EK | 8.97 |
| 1333-337 | 0.013 | -24.50 | 24.67 | 23.34 | WP | 9.22 |
| 1344-241 | 0.02 | -23.05 | 23.55 | 21.85 | EK | 8.50 |
| 1354-251 | 0.038 | -23.46 | 24.29 | 22.51 | EK | 8.70 |
| 1400-337 | 0.014 | -24.90 | 23.52 | 22.11 | EK | 9.42 |
| 1404-267 | 0.022 | -23.91 | 23.93 | 23.78 | EK | 8.93 |
| 1514+072 | 0.034 | -24.77 | 24.70 | 24.31 | WP | 9.36 |
| 1521-300 | 0.02 | -21.78 | 23.83 | 23.43 | EK | 7.86 |
| 1637-771 | 0.041 | -23.41 | 25.29 | 24.14 | WP | 8.68 |
| 1717-009 | 0.031 | -22.49 | 25.94 | 23.70 | WP | 8.22 |
| 1733-565 | 0.098 | -23.68 | 26.19 | 25.49 | WP | 8.81 |
| 1928-340 | 0.098 | -24.63 | 24.94 | 23.98 | EK | 9.29 |
| 1929-397 | 0.073 | -25.04 | 25.39 | 23.54 | EK | 9.49 |
| 1949+023 | 0.059 | -23.69 | 25.58 | 23.2 | WP | 8.82 |
| 1954-552 | 0.058 | -23.33 | 25.55 | 23.89 | WP | 8.64 |
| 2013-308 | 0.088 | -24.69 | 25.01 | 23.56 | EK | 9.32 |
| 2031-359 | 0.088 | -24.54 | 25.33 | 23.64 | EK | 9.24 |
| 2040-267 | 0.041 | -24.09 | 24.83 | 23.37 | EK | 9.02 |
| 2058-282 | 0.039 | -24.24 | 25.13 | 23.63 | WP | 9.09 |
| 2059-311 | 0.039 | -24.23 | 24.13 | 23.09 | EK | 9.09 |
| 2104-256 | 0.038 | -24.20 | 25.46 | 23.59 | WP | 9.07 |
| 2128-388 | 0.018 | -23.20 | 23.76 | 22.46 | EK | 8.57 |
| 2158-380 | 0.034 | -23.16 | 24.47 | 22.4 | EK | 8.55 |
| 2209-255 | 0.063 | -24.23 | 24.67 | 23.95 | EK | 9.08 |
| 2221-023 | 0.057 | -22.36 | 25.53 | 24.10 | WP | 8.15 |
| 2225-308 | 0.056 | -22.69 | 24.69 | 23.63 | EK | 8.32 |
| 2236-176 | 0.07 | -24.70 | 25.08 | 23.35 | EK | 9.32 |
| 2333-327 | 0.052 | -23.77 | 24.20 | 23.17 | EK | 8.86 |
| 2350-375 | 0.116 | -24.03 | 25.13 | 23.41 | EK | 8.99 |
| 2353-184 | 0.073 | -23.92 | 24.88 | 23.39 | EK | 8.93 |

4.2 The relation
McLure and Dunlop (2002) and Laor (2001) investigated the relation for Seyfert galaxies and powerful QSO in order to test its linearity (which means =1). In both papers the above relation is derived from under the assumption of a mass-to-light ratio having the form but they reached different conclusions. Laor (2001) claimed that the relation is not linear, while this was not confirmed by McLure and Dunlop (2002). However, the latter authors showed also that Laor data may be consistent with the linearity if one adopts =0.31 (Jørgensen et al. 1996) instead of =0.18 (used by Laor).
Here we investigate the relation for our samples of RGs. We have computed the two involved quantities ( and ) from , MR and the effective radius of the galaxy () avoiding possible spurious effects introduced in the analysis by the use of the same variable to derive the two masses. We first derive from (eq. 1) and from and using the formula =, proposed by Bender et al. (1992). These two determinations are reported in columns 9 and 10 of Table 2. Figure 5 shows the linear fit to the – relation for objects in the reduced Sample A and for normal ellipticals (JFK96), together with the data relative to the sample of inactive galaxies for comparison. We find:
| (3) |
This relation has , while the residual scatter (i.e. the scatter not accounted for by the errors) is =0.03, which is consistent with zero. The slope (=0.96) is practically coincident with an almost perfect linearity (=1; see the dotted line in Figure 5). This suggests that a fundamental link is present in the combined formation of BHs and spheroids that holds for various types of active and inactive galaxies. We also note that, given the coefficients of the fundamental plane (FP), the linearity of the - relation turns out to be directly linked with the particular value of the slope (A) of the relation (Log=AMR + B). In fact the exponent of the relation can be written in the form: , where and are the coefficients of the FP. Using =1.242, =0.33 (Bettoni et al. 2001) and A=-0.5 it follows that, =0.94. Vice-versa, if perfect linearity is assumed using the same , one obtains A=-0.53.
The distribution of the black-hole to bulge mass ratio is shown in Figure 6 (panel a). The average value of the mass ratio is , with . The dispersion expected from just the uncertainties on the measurements () is consistent with that observed, suggesting that the intrinsic variance of the ratio is very small.
Alternatively we can derive the ratio using derived from and assuming =0.0021 (the coefficients are derived by fitting the -L relation, in the R band,for our RG data together with the ellipticals in JFK96). In this case we obtain =-3.16 with a dispersion of 0.43 (see Figure 6b). These are in good agreement with those derived for the inactive galaxy sample: -3.07 (=0.19) and -3.05 (=0.50) for the two procedures respectively. They are also similar to previous determinations by Merritt and Ferrarese (2001) who found -2.900.45 using the Magorrian et al. (1998) galaxy sample and the - relation, and by McLure and Dunlop (2002) that report -2.870.47 from their study of the host galaxies of powerful quasars and use virial black-hole masses.


4.3 Relationship between and radio emission
Based on a small number of nearby galaxies with known BH masses it was suggested by Franceschini et al. (1998) that scales with the total radio luminosity at 5 GHz ( ). This is what would be expected by Accretion-Dominated Accretion Flows (ADAF, see Abramowicz et al. (1995); Narayan & Yi (1996)) models. This correlation appears to hold over at least 3 order of magnitudes for and, given its steepness, it was proposed as a tool to predict from the simple observation of the radio flux. Additional support for a link between and in various type of active galaxies was lead by Laor (2001) and Lacy et al. (2001).
However, a recent analysis by Ho (2002) of this relationship, for objects with a wide range of nuclear activity, argued that is only loosely related with the radio power (both total and core emission). The poor correlation observed between the two quantities could therefore arise from indirect relations between radio luminosity, bulge mass and and has no practical power to predict from the radio luminosity.

We have investigated this issue using our samples of radiogalaxies for which radio power () at 5 GHz and are available (see Table 2). In figure 7 we show the data for our radio galaxies in the plane -LogP5GHz(total). The two quantities are not correlated: Spearman correlation coefficient -0.174, with significance of nonzero correlation 0.038. The same result is found using the core radio power. Similarly, no significant correlation is found between the host galaxy mass and the radio power, in agreement with the fact that is tightly related to .
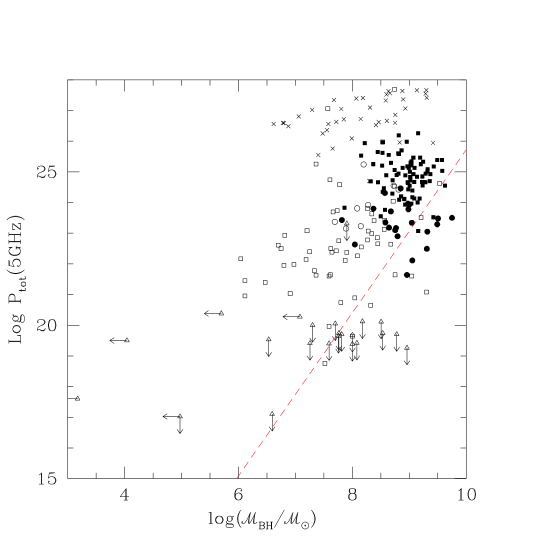
In Figure 8 we compare the distribution of our RGs over the plane – radio power with that of other samples of galaxies at various levels of nuclear activity investigated by Ho (2002) and Oshlack et al. (2002). Note that the latter data refer to flat spectrum radio-sources whose flux is likely enhanced by Doppler boosting (beamed sources). Their observed luminosity therefore tends to occupy the higher region of the - plane (see also Jarvis & McLure 2002). Our data for RG are in agreement with the analysis by Ho (2002) and enforce his conclusion that radio power is poorly correlated with the mass of the central BH and therefore that the latter can not practically be predicted by the measurement of the radio flux. If instead of the total radio luminosity we use the radio power of the core this picture remains basically unchanged. All together the points in Figure 8 appear to follow the trend of increasing with higher radio luminosity. This behavior is consistent with the suggestion by Dunlop et al. (2002) that both active and inactive galaxies fall between two envelopes (following the law) in the - plane. On the other hand the scatter of the points is rather large and do not produce a significant correlation of the two quantities. Our objects cover the top-right part of the diagram where more massive BH and powerful radio sources are expected. Most of our points and those of Ho (2002) lie above the relation proposed by Franceschini et al. (1998) by 2-3 order of magnitude. At low accretion rates ADAF models foresee that radio power depends on as . The location of points well above such relation may simply reflect the much higher level of activity (and likely of accretion).
5 Summary and Conclusions
We used of empirical relations between and either the velocity dispersion () or the bulge luminosity MR(bulge) derived for nearby early type galaxies to infer the mass of the central BH of low redshift radio galaxies.
The main conclusions of this study are:
1) Using only nearby galaxies of E-type morphology, for which BH masses are available, the two relationships - and - Mbulge exhibit a similar scatter (0.4 in Log) which is also consistent with that expected from the estimated errors on the involved parameters.
2) We showed that when the dependence on the adopted cosmology (for the - Mbulge relation) is properly taken into account the two relations predict the same value of the central BH mass (within the expected uncertainties). This means that the BH mass can be reliably estimated from the observable parameter MR(bulge) which is more easily measurable than .
3) The inferred BH mass of low redshift radio galaxies is in the range 5 to 5 .
4) We found that the central BH mass is linearly correlated with that of its host galaxy the average Black Hole to bulge mass ratio is -3.1.
5) The total (or core) radio power at 5 GHz is not correlated neither with the mass of the central BH nor with that of the galaxy; the radio power is always in excess by 2-3 order of magnitude with respect to what would be expected from low accretion rate models (ADAF).
Acknowledgements.
We wish to acknowledge the anonymous referee for valuable comments which lead to the improvement of this paper. This work has received partial support under contracts COIN2001/028773-004, ASI-IR-35 and ASI-IR-73-01.References
- Adams et al. (2001) Adams, F.C., Graff, D.S. & Richstone, D.O. 2001, ApJ, 551, L31
- Abramowicz et al. (1995) Abramowicz, M.A. & Lasota, J.P. 1995, Comm. Astrophys. 18, 141
- Becker et al. (1991) Becker, R.H., White, R.L. & Edwards, A.L. 1991, ApJS 75, 1
- Bender et al. (1992) Bender, R., Burstein,D., & Faber, S.M. 1992, ApJ, 399, 462
- Bettoni et al. (2001) Bettoni, D., Falomo, R., Fasano, G., Govoni, F., Salvo, M. & Scarpa, R. 2001, A&A, 380, 471
- Bressan et al. (1994) Bressan A., Chiosi C. & Fagotto F. 1994, ApJS, 94, 63.
- (7) Colina, L. & de Juan, L. 1995, ApJ. 448, 548
- Dufour et al. (1979) Dufour, R., Harvel, C., Martins, D., Schiffer, F., Talent, D., Wells, D., Van Den Bergh, S. & Talbot, R. 1979, AJ, 84, 284
- Dunlop et al. (2002) Dunlop, J.S., McLure, R.J., Kukula, M.J., Baum, S.A., O’Dea, C.P. & Hughes, D.H. 2002, astro-ph/0108397
- Ekers et al. (1989) Ekers, R.D., Wall, J.V., Shaver, P.A. et al. 1989, MNRAS, 236, 737
- Faber et al. (1997) Faber, S. et al. 1997, AJ, 114, 1771
- Faber et al. (1989) Faber, S.M., Wegner, G., Burstein, D., Davies, R.L., Dressler, A., Lynden-Bell, D., & Terlevich, R. 1989, ApJSS, 69, 763(FA89)
- Falomo et al. (2002) Falomo, R., Carangelo, N. & Treves, A. 2002 MNRAS, submitted
- Fasano & Vio (1988) Fasano, G. & Vio, R. 1988, Bull. Inf. CDS No. 35, 191
- Fasano et al. (1996) Fasano, G., Falomo, R., & Scarpa, R. 1996, MNRAS, 282, 40
- Ferrarese (2002) Ferrarese, L. 2002, astro-ph0207050
- Ferrarese & Merritt (2000) Ferrarese, L. & Merritt, D. 2000, ApJ, 539, L9
- Franceschini et al. (1998) Franceschini, A., Vercellone, S. & Fabian, A.C. 1998, MNRAS, 297, 817
- Fukugita et al. (1995) Fukugita, M., Shimasaku, K. & Ichikawa, T. 1995, PASP, 107, 945
- Gebhardt et al. (2000) Gebhardt, et al. 2000, ApJ, 539, L13
- Gonzalez-Serrano et al. (1993) Gonzalez-Serrano J.I., & Carballo, R & Perez-Fournon, J 1993, AJ, 105, 1710
- Gonzalez-Serrano and Carballo (2000) Gonzalez-Serrano J.I., & Carballo, R 2000, A&A, 142, 353
- (23) Govoni, F., Falomo, R., Fasano, G., & Scarpa, R. 2000a, A&A, 353, 507
- (24) Govoni, F., Falomo, R., Fasano, G., & Scarpa, R. 2000b, A&ASS, 143, 369
- Griffith et al. (1994) Griffith, M.R., Wright, A.E., Burke, B.F. & Ekers, R.D. 1994, ApJS 90, 179
- Griffith et al. (1995) Griffith, M.R., Wright, A.E., Burke, B.F. & Ekers, R.D. 1995, ApJS 97, 347
- Haehlnet & Kauffmann (2000) Haehlnet, M.G. & Kauffmann, G. 2002, MNRAS, 318, L35
- Ho (2002) Ho, L.C. 2002, ApJ, 564,120
- Jarvis & McLure (2002) Jarvis, M.J., & McLure, R.J. 2002, astro-ph0208390
- Jørgensen et al. (1996) Jørgensen, I., Franx, M., & Kjærgaard, P. 1996, MNRAS, 280, 167(JFK96)
- Kormendy & Gebhardt (2001) Kormendy, J. & Gebhardt, K 2001, 20th Texas Symposium on relativistic astrophisyscs, eds. J. C. Wheeler and H. Martel AIP conf. Proc. 586, p.363
- Küehr et al. (1981) Küehr, H., Witzel, A., Pauliny-Thoth, I.I.K. & Nauber, U. 1981, A&AS 45, 367
- Lacy et al. (2001) Lacy, M., Laurent-Muehleisen, S.A., Ridgway, S.E., Becker, R.H. & White, R.L. 2001, ApJ, 551, L17
- Laor (2001) Laor, A. 2001, ApJ, 553, 677
- Ledlow & Owen (1995) Ledlow, M.J., & Owen, F.N. 1995, AJ, 110, 1959
- Merritt & Ferrarese (2001) Merritt, D. & Ferrarese, L. 2001, MNRAS, 320, L30
- Magorrian et al. (1998) Magorrian, J. et al. 1998, AJ, 115, 2285
- McLure & Dunlop (2002) McLure, R.J. & Dunlop, J.S. 2002, MNRAS, 331, 795
- Narayan & Yi (1996) Narayan, R. & Yi, I 1996, ApJ, 444, 231
- Nelson et al. (2002) Nelson et al. 2002, in proc Co-evolution of BH and galaxies, in press.
- Oshlack et al. (2002) Oshlack, A., Webster, R. & Whiting, M. 2002, ApJ, 576, 81
- Owen & Laing (1989) Owen, F.N. & Laing, R.A. 1989, MNRAS, 238, 357
- Prugniel & Maubon (2000) Prugniel, Ph., & Maubon, G. 2000, “Dynamics of Galaxies: from the Early Universe to the Present” ASP Conf. Ser. Vol. 197, p. 403
- Silk & Rees (1998) Silk, J. & Rees, M.J. 1998, A&A, 331, L4
- Smith & Heckman (1989) Smith, E.P.& Heckman, T.M., 1989, ApJ, 341, 658
- Smith et al. (1990) Smith, E.P., Heckman, T.M., & Illingworth, G.D. 1990, ApJ, 356, 399(SHI90)
- Stark et al. (1992) Stark, A.A., Gammie, C.F., Wilson, R.W. et al. 1992, ApJS, 79, 77
- Tremaine et al. (2002) Tremaine, S. et al. 2002, ApJ, 574, 740
- Tonry et al. (2001) Tonry, J.L. et al. 2001, ApJ, 546, 681
- Wall & Peacock (1985) Wall, J.V. & Peacock, J.A. 1985, MNRAS, 216, 173 (WP)
- de Vaucouleurs et al. (1991) de Vaucouleurs G., de Vaucouleurs A., Corwin H.G., Buta R.J., Paturel G., Fouque P., 1991, Third Reference Catalogue of Bright Galaxies (RC3), Springer-Verlag: New York