HST/WFPC2 Morphologies of K-selected
Extremely Red Galaxies
Abstract
We selected 115 extremely red objects (EROs) from deep HST WFPC2 archive data combined with ground-based K-band images, with , K-band , and a median limiting Ks magnitude of , over a corresponding area of 228 sq. arcminutes, for a morphological study of the ERO galaxy population. The survey covered a total of 409 sq. arcminutes over 77 separate WFPC2 fields. This is the first complete sample of bright EROs with high resolution HST morphologies. From a visual morphological classification, we find that 305% of our selected sample have morphologies consistent with a pure bulge or bulge-dominated galaxy (equivalent to E/S0), while disks comprise 647% of the sample. Only 6% of the EROs remained unclassifiable. Mergers or strongly interacting systems, which includes sources from both classes, make up 174% of the full sample. The quantitative MDS profile fitting is consistent with these results. These results highlight the complex nature of optical/near-IR color selected EROs. The dominant component of our sample is comprised of disks, not spheroids or strongly interacting systems like HR 10. Using Bruzual & Charlot SED models, we investigated population differences in EROs selected by their () vs. () colors and found that I-band based surveys preferentially select systems with prolonged star formation. Real differences in the surface densities of EROs in -band and -band based survey may reflect this color selection effect, complicating the comparisons between and interpretations on the nature of the ERO population. We conclude that only a small fraction of EROs at could be passively evolving ellipticals formed at high redshift through a “monolithic collapse” mechanism. For the majority of EROs, even if most of their stellar mass is already in place at , interaction with the environment and accretion of gas still play important roles in their continuing evolution.
1 Introduction
Extremely Red Objects (EROs), which have optical-to-infrared colors which differ significantly from typical field sources, encompass a wide variety of phenomenæ. Galaxies of assorted types make up the dominant component of ERO samples, but one can also find low mass stars, gravitationally lensed sources, and transient sources such as variable stars, asteroids or supernovae which may not be initially recognized as such. The term Extremely Red Galaxies (ERGs) is also commonly used, sometimes interchangeably, but usually refers to a sample of EROs which has been cleaned of the objects which are not galaxies. ERGs are therefore a subset of the EROs. We adopt the more general term ERO throughout this paper.
Both the definition and interpretation of EROs has evolved somewhat since their initial discovery, and it is useful to review the subject here for some historical perspective. When first identified as a distinct population of sources (Elston, Rieke, & Rieke, 1988), EROs were thought to be good candidates for primeval galaxies. Subsequent observations (Elston, Rieke, & Rieke, 1989), however, showed these early EROs to be elliptical galaxies. Additional EROs were noted in the following years (McCarthy, Persson, & West, 1992; Eisenhardt & Dickinson, 1992; Persson et al., 1993; Graham et al., 1994; Hu & Ridgeway, 1994; Soifer et al., 1994; Dey, Spinrad, & Dickinson, 1995; Djorgovski et al., 1995; Treu, 1998; Im et al., 2002). Most of these were serendipitous detections, identified on images targeting known, high-redshift radio galaxies or other active galactic nuclei. Little or no followup work was done on these objects at the time, which to some extent reflected the limited capabilities of existing instruments and telescopes. These EROs were identified with colors spanning a wide range: () 5–7, or () 4–6.
A resurging interest in EROs accompanied the development of the Submillimeter Common User Bolometer Array (Holland et al., 1999, SCUBA), and the subsequent detection of the extremely red galaxy HR 10 (Hu & Ridgeway, 1994, this source is also known as HR94 10 or ERO J164502+4626.4) at 850 m (Cimatti et al., 1998; Dey et al., 1999). At a redshift of 1.44 (Graham & Dey, 1996), the detection of HR 10 in the submillimeter implied the presence of massive quantities of dust accompanied by very high star formation rates. The ERO population was thought to provide fertile hunting grounds for more submillimeter-bright galaxies at high redshift. Additional observations have not supported this idea, however, with only a relatively small fraction, on the order of 20% (Andreani et al., 1999; Mohan et al., 2002, Thompson, priv. comm.), of the bright EROs () showing strong submillimeter emission.
The development of larger-format infrared arrays and wider field instrumentation enabled subsequent field surveys to cover enough area to assemble significant samples of systematically selected EROs for further study, in blank fields (Thompson et al., 1999; Daddi et al., 2000; McCarthy et al., 2001) as well as targeted surveys (Chapman, McCarthy, & Persson, 2000; Cimatti et al., 2000; Liu et al., 2000). Thompson et al. (1999) adopted a color selection for EROs of () 60. The motivation was that this color was redder than the expected colors of elliptical galaxies with anything but the highest formation redshifts (), and thus represents an extreme color for any normal galaxy. The assumption at the time was that the extremely red galaxy population consisted of either old ellipticals or young, dusty starbursts (Cimatti et al., 1998; Thompson et al., 1999; Dey et al., 1999). The relative contribution of these two types of galaxies would have a bearing on the timing of massive galaxy formation and their subsequent evolution. It is important to emphasize that, at that time, the term “young, dusty starbursts” referred specifically to massive starbursts like that seen in HR 10 or luminous infrared galaxies. Multi-band photometry could potentially distinguish between ellipticals and starbursts (Pozzetti & Mannucci, 2000), but this technique requires very low photometric uncertainties to work well (see, for example, Mannucci et al. (2002)).
In order to better study the elliptical galaxy population, Daddi et al. (2000) adopted a bluer color selection limit, () 5.3, set by the expected colors of a passively evolving old stellar population. This definition, or the roughly equivalent () 4.0, for the ERO color selection criterion has generally been adopted in the majority of subsequent work.
While there are a number of redshifts now known for EROs (Graham & Dey, 1996; Soifer et al., 1999; Liu et al., 2000; Afonso et al., 2001; Smith et al., 2002b), systematic redshift surveys of complete samples are only now becoming available (Cimatti et al., 2002). Morphological information based on high-resolution HST imaging for complete samples of EROs are also only now starting to appear (Smith et al., 2002a, this work). Without similar spectroscopic or morphological information, earlier ERO surveys divided the ERO population into two components: old, evolved systems or dusty, massive starbursts. But the true nature of K-selected EROs is likely to be much more complex, as suggested by recent work (McCarthy et al., 2001; Cimatti et al., 2002).
McCarthy et al. (2001) find a large scatter in the colors of their ERO sample, best fit by passive evolution models with extended star formation ( Gyr). This implies that the star formation history of EROs is more complex than a binary division into evolved ellipticals or dusty, massive starbursts implies. From their K20 survey, Cimatti et al. (2002) found that about half of their spectroscopic sample of 30 EROs are dusty star-forming galaxies with emission lines, while the remaining half are old stellar populations with absorption line spectra. However, the simple presence of line emission could span a wide range of galaxy types, from bulge-dominated, late type spiral galaxies with a small amount of star formation through the more massive starbursts like HR 10. Dust could also completely obscure any on-going star formation, to the point that the optical and UV emission lines are not seen (Poggianti & Wu, 2000). Examples of what appear to be quiescent disks at exist (van Dokkum & Stanford, 2001; Smith et al., 2002b).
There are important differences in the formation and evolution of quiescent normal galaxies and young, dusty, massive starbursts. Morphologies have the potential to distinguish between the various interpretations, which motivated this work.
In this paper, we present the high resolution morphologies derived from HST WFPC2 images for a large sample of K-selected EROs. Our results reveal for the first time a new type of ERO which dominates the population and is neither an early-type galaxy nor a dusty, massive star forming galaxy. We will also discuss the implications of our results for the past and future evolution of massive galaxies at .
2 Observations and Reductions
The data used in this survey come from two sources. Deep, high resolution HST/WFPC2 F814W images from archival data, specifically from the Medium Deep Survey (MDS; Griffith et al. (1994); Ratnatunga et al. (1999)), are used for the optical dataset. Images in the band were obtained from the Palomar 60-inch telescope for a total of 77 MDS fields.
Details on the survey design, observations, reductions and analysis, as well as the details of our visual morphological classification and the automated two-component profile fitting results from the MDS, are given below. In summary, magnitudes were extracted in matched apertures after rotating, rebinning, and convolving the HST data to match the infrared data. A final set of 115 unique EROs satisfying the selection criteria (F814W - Ks) 4 and with a K-band signal-to-noise ratio (SNR) were identified over a total area of 409 sq. arcminutes. The coordinates, photometry, and morphological classifications for the 115 EROs are listed in Table 2, along with the field name and source identification from the Medium Deep Survey.
2.1 Field Selection
Our target fields were selected from the MDS database to have a 5 sensitivity of F814W24m (Vega), which would provide a good signal-to-noise ratio (SNR), high resolution optical image for morphological classifications for the majority of the EROs we might detect. This corresponds to a minimum total exposure time of s, typically split over 2 or more exposures to aid in the removal of cosmic rays. We restricted the target fields to high Galactic latitudes, , to minimize foreground stellar contamination, and make no explicit corrections for Galactic extinction. For most fields, the color correction is under 01. Finally, we selected primarily northern hemisphere fields () to preserve accessibility from Palomar Observatory.
The fields were selected without regard to any specific science targets. The majority of the MDS database is composed of random parallel fields imaged while the primary science target was observed in another HST instrument. However, there are a significant number of fields containing known clusters present in the MDS database, twelve of which we imaged as part of this survey. Gravitational lensing from these foreground clusters (typically at redshifts of a few tenths) can boost the observability of faint EROs. This technique has been used with success in surveys targeting EROs (Smith et al., 2002a), submillimeter-bright galaxies (Smail et al., 1999), and other high redshift sources (Ellis et al., 2001). We note here that any lensing will be unbiased with respect to galaxy morphologies, and so we make no specific corrections for lensing from cluster fields observed in this survey. Lensing can, however, boost the surface densities of EROs (see §3.2). We note that there is no overlap in target fields between our survey and that of Smith et al. (2002a).
2.2 WFPC2 F814W Images
We retrieved the F814W images from the MDS database at Space Telescope Science Institute (see http://archive.stsci.edu/mds/cdrom.html). These data have been processed through the MDS data reduction pipeline, which includes warm pixel correction, image stacking, removal of cosmic rays, and photometric calibration. For a complete description of the MDS reduction pipeline, see Ratnatunga et al. (1999). In general, this automated reprocessing produces the best results on fields where multiple (n3), dithered images were obtained, and where the field and its immediate surroundings are free of bright stars. These processed images are stored in the MDS database in the HST standard GEIS format, where each of the 4 CCDs and their associated header information is stored in a separate layer of the disk file.
For each of our target fields, we retrieved these GEIS format images, then processed them further to meet the needs of our survey. The data were processed using standard IRAF111IRAF is distributed by the National Optical Astronomy Observatories, which are operated by the Association of Universities for Research in Astronomy, Inc., under cooperative agreement with the National Science Foundation. tasks, plus specialized routines developed for WFPC data found in the STSDAS package.
First, we interpolated over bad pixels flagged by the MDS processing, subtracted the background, and corrected any additional deviant pixels identified by the cosmicray routine. The STSDAS task wmosaic was used to correct for distortion in the WFPC2 images and assemble the data from the four separate CCDs into a single mosaic image. This additional processing does miss some cosmic rays, but any contamination of the EROs is minimal, and only serves to make the sources bluer than they would otherwise be.
2.3 K-band Imaging
Ground-based images were obtained using the near-IR camera on the Palomar 60 inch telescope (Murphy et al., 1995). The camera has a field of view, well-matched to WFPC2. The detector is a 2562 pixel HgCdTe, covering 062 per pixel. A total of 42 nights went into this project, spanning the time period of 2000 August 11 – 2001 June 06 UT. Useful data was collected on 21 photometric nights. We imaged 77 MDS fields under photometric conditions, with repeat observations on about one-third of the fields to help determine the photometric uncertainties. The repeat observations show less than 01 of systematic variations. We targeted exposure times of 75 minutes (4500 seconds) per field, which yields a 5 point-source sensitivity of 1875 in good seeing.
The data were reduced following standard infrared reduction procedures. Each frame was sky-subtracted with temporally-adjacent images and then flatfielded with a combination of dome and twilight sky flats. Offsets were determined from as many sources as possible (with a minimum of one, as the header coordinates were insufficiently accurate to stack the data with confidence). A bad pixel mask was used to reject dead or excessively hot pixels, and the data combined with integer pixel offsets into the final mosaics for each field.
Observations of the Persson infrared photometric standards (Persson et al 1996) were obtained throughout the night, and used to derive the zero points and airmass corrections. For the photometric data, the zero points show only 0.02 mag rms variations from night to night. This is added into the photometric uncertainties of individual objects in quadrature.
The 5 sensitivities in the centers of the infrared mosaics ranges from 182 195. This was calculated from the per-pixel sky noise at the center of the infrared mosaics, and scaled to an aperture diameter equal to 2.5 times the FWHM of the seeing. The seeing ranges from 12 to 25, with the majority of the data better than 18 (3 pixels FWHM). The lower sensitivities are generally due to poorer seeing conditions, while the deeper data are from stacking observations from multiple nights. A summary of the useful observations are given in Table 1, which lists the field, exposure times for both the and F814W images, and the central 5 sensitivity.
2.4 Matched Aperture Photometry
The original full resolution F814W images were rotated, rebinned and convolved to match the infrared image orientation, scale and seeing. The optical and infrared images were then co-aligned and cropped to matching areas on the sky. The resulting image pairs were used for extraction of the photometry. A set of IRAF scripts were written to speed the execution of these and subsequent tasks in creating the final photometric catalogs.
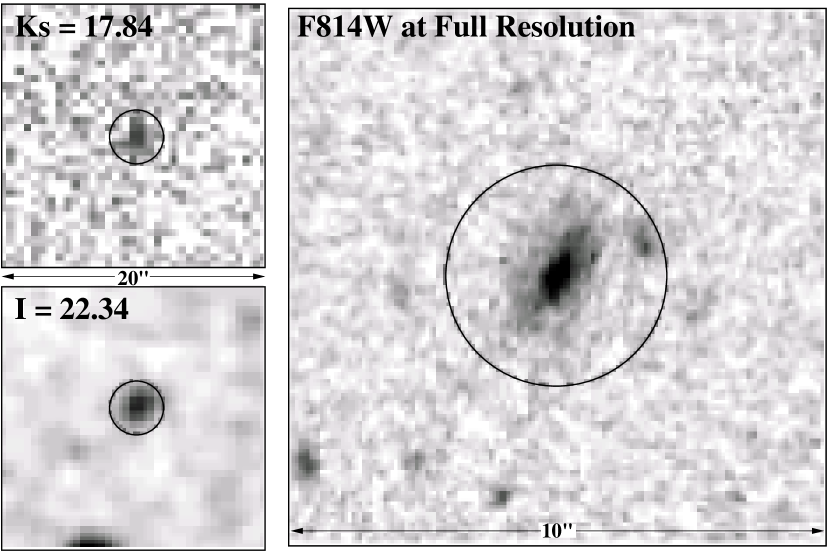
Because the K-band image mosaics have increasing noise at the edges, source detection was performed on a noise normalized image so that a uniform detection threshold could be applied. The noise normalization was done by multiplying the K-band image mosaic by the square root of an exposure time map. We used the Source Extractor software (Bertin & Arnouts, 1996) for the initial source detection on the K-band data. However, uncorrected distortions and/or small residual offsets between the image pairs ultimately required recentering on objects in the scaled and seeing-convolved HST data. Re-centering of the photometric apertures on the HST data was reviewed interactively for all sources with initial colors greater than () 38, as illustrated in Figure 1. This review process also allowed for rejection of spurious sources from the photometric catalog, as well as noting the effects of uncorrected cosmic rays or contamination from nearby galaxies. Note the complete lack of morphological information in the ground-based imaging, while the full-resolution image clearly shows a galaxy with a disk.
The final aperture photometry was extracted using the apphot package in IRAF. We adopted an aperture diameter of 2.5 times the seeing FWHM of the corresponding K-band image. This represents a compromise between a larger aperture, which yields a fairer measurement of a galaxy’s total magnitude as well as provides a better measure for intrinsically large galaxies, and a smaller aperture, which would minimize contamination from other sources close to the line-of-sight to the ERO. The majority of the K-band data are better than 18 FWHM (3 pixels), so the photometry was extracted in apertures typically smaller than 45 in diameter. Because the K-band images have non-uniform noise and depth, the SNR for each galaxy was determined locally. For faint objects, the SNR is dominated by the sky noise within the photometric aperture.
In 20% of the cases, the photometric apertures do include close companions which could affect the F814W photometry. This has the effect of making our measured colors for these objects bluer than the true color of the ERO, and thus a lower limit. We were able to correct for the majority of contamination problems during the review process, but we note that the presence of companions should not be biased toward any particular morphological type.
2.5 Survey Area
Because our survey is composed of many separate images obtained on different nights, under different seeing conditions, and with different exposure times, the depth of each field varies. Also, since the infrared camera field size is only slightly larger than the HST WFPC2 mosaic, and given the random orientations for the HST data, portions of the HST images often overlap the higher-noise area around the edges of the infrared mosaics. These factors combine to make the total survey area a function of the depth, while allowing maximal use of the survey data.
We integrated the survey area as a function of magnitude on a per pixel basis. Ideally, this should be done over resolution elements. However, aside from single-pixel deviations due to masked bad pixels or cosmic rays, the depth in the infrared data only changes relatively slowly with position around the edges.
To sum the survey area, we first created a mask for the co-aligned images covering the area on the sky outside the borders of the WFPC2 data. An effective exposure time map for the infrared mosaic was then converted into a map of the limiting magnitude in each pixel as:
where is the exposure time that went into the individual pixels in the final infrared mosaic, and is the total exposure time for that image.
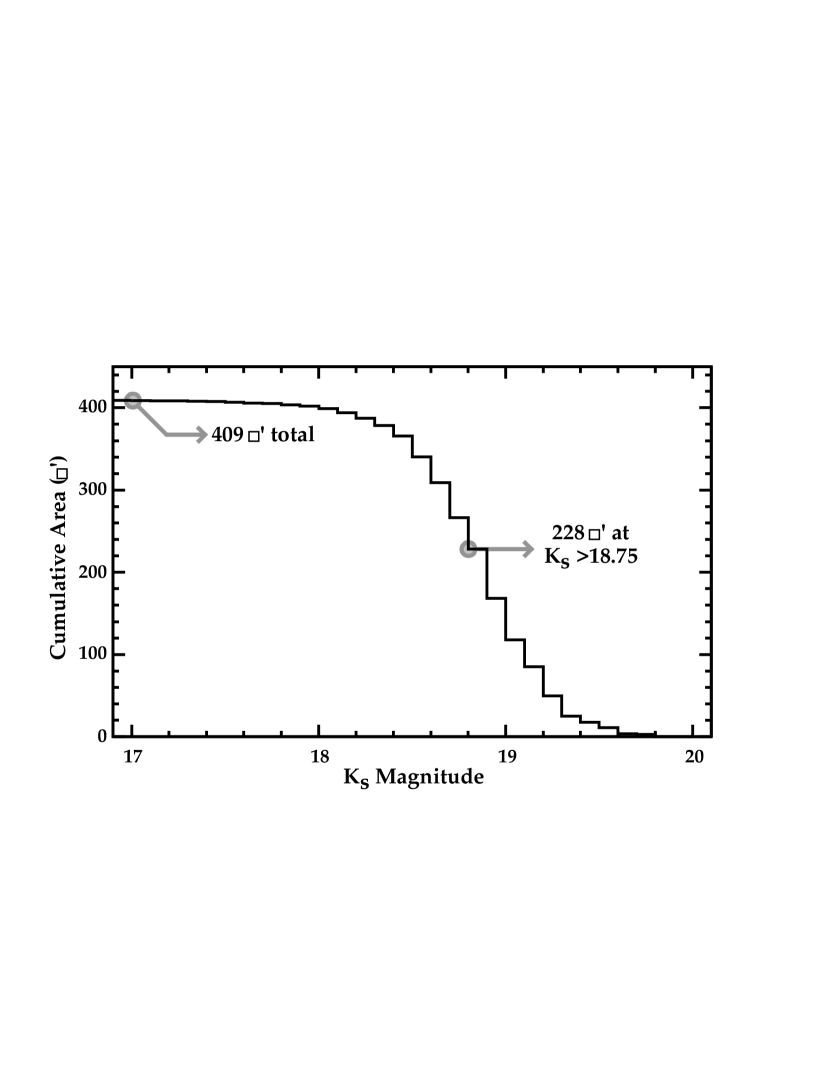
A histogram of the unmasked pixel limiting magnitudes (pixels also covered by the HST data) was then created for each survey image in 01 bins. The resulting 77 histograms were combined, and scaled by the area per pixel. This differential area histogram was finally integrated from the faint to the bright limits. A plot of the integrated area as a function of the limiting magnitude is shown in Figure 2. The full survey area is 409 square arcmin, with more than half of this (228 sq. arcmin) reaching to at least a depth of 1875.
2.6 The ERO Sample
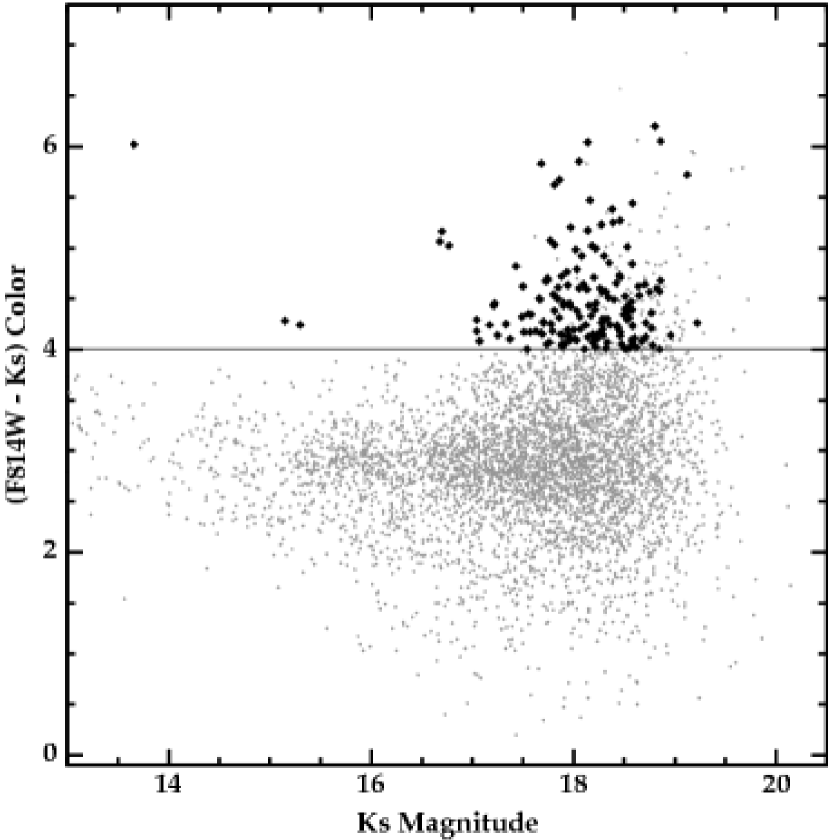
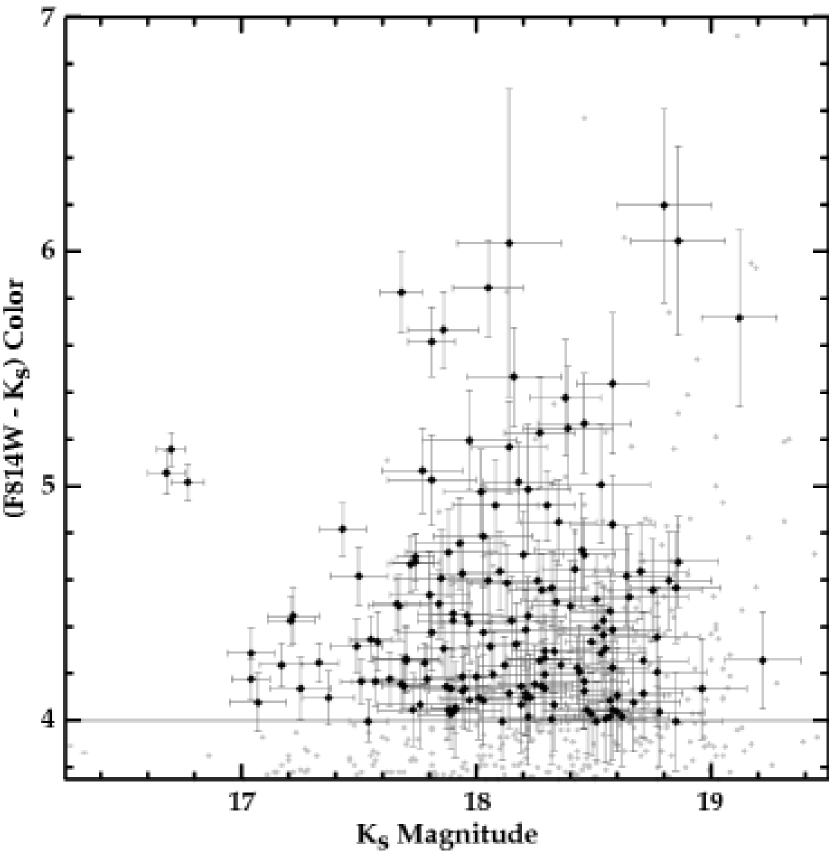
A total of 115 unique galaxies satisfy the selection criteria of (F814W - Ks) 4 and with a K-band signal-to-noise ratio (SNR) , were selected over a total area of 409 sq. arcminutes. The coordinates, photometry, and morphological classifications for these 115 EROs are listed in Table 2, along with the field name and source numerical identification from the Medium Deep Survey. We show the combined color-magnitude diagram for all 77 fields in Figure 3. All independent observations are included, so some sources are plotted more than once. In Figure 4 we detail the photometric uncertainties on the ERO sample.
Not included in Table 2 are six sources which were obvious stars, most of which were not intrinsically red but simply saturated on the HST images. We also excluded the gravitationally lensed system MG 04140534 (Lawrence et al., 1995), which does satisfy the adopted selection criteria, but was the science target for the HST observations and thus was not a randomly selected source.
2.7 Morphological Classification
The main goal of this survey is to utilize the high resolution WFPC2 images to study the morphological properties of EROs. We classified the sources visually, but also compare our results to the automated profile fitting from the MDS. The details are described below.
The full-resolution HST/WFPC2 images of all of the EROs in our sample are shown in Figure 10. The authors strongly caution the reader against attempting to morphologically classify the EROs solely from these grayscale images. The HST data are freely available from STScI, and interested readers are encouraged to retrieve the original data.
2.8 Visual Classification
Visual morphological classification on nearby galaxies has had a significant impact on our understanding of galaxy formation, environment, and evolution. However, it is widely acknowledged that visual classification is an inherently uncertain and subjective process. In the high redshift regime, the visual classification of galaxy morphology is further complicated by limited resolution (even with HST), lower SNR, cosmological dimming, and observations at restframe wavelengths which vary with the redshift. Several detailed studies on the biases in visual morphological classifications of high redshift galaxies have been made (Hibbard & Vacca, 1997; Odewahn et al., 1996). Despite its inherent uncertainties and subjectiveness, visual morphological classification has proved to be a powerful tool for galaxies at , as demonstrated by by many studies using deep HST images in the HDF, as well as morphological studies of galaxies in high-redshift clusters (Lubin et al., 1998; Dressler et al., 1997; Couch et al., 1998; Smail et al., 1998). One important point illustrated in these empirical studies, and also in simulations (Hibbard & Vacca, 1997), is that the extended morphological features remain readily visible in deep HST F814W images out to . In light of this, we have visually classified all the EROs in our sample.
Because of the bright Ks magnitude limits in this survey, all 115 galaxies in our sample are detected in the F814W images, most well resolved and with a high SNR. As a training set for our visual classification, we examined in detail the F814W images from the MDS database for all of the galaxies in cluster CL16034304, which is one of the target fields included in this work (u2845). Most of the cluster members are much brighter than the EROs. Since the cluster is quite distant, the cluster members have similar apparent sizes and suffer from similar cosmological dimming as the EROs. Morphological classifications for these galaxies were published in Lubin et al. (1998). Working down the full range of apparent magnitudes, it was increasingly difficult to classify the fainter galaxies into the traditional galaxy morphological types (Elliptical, S0, Sa/Sb/Sc Spirals, Irregulars), although it was still possible to distinguish between spheroidal systems (presumably mostly elliptical and S0 galaxies) and disky systems (Sb/Sc/Irr). Spirals of type Sa represent a somewhat fuzzy boundary. Depending on the SNR or strength of any ongoing star formation, these could be classified either way. We therefore opted to simplify our morphological classification of the EROs.
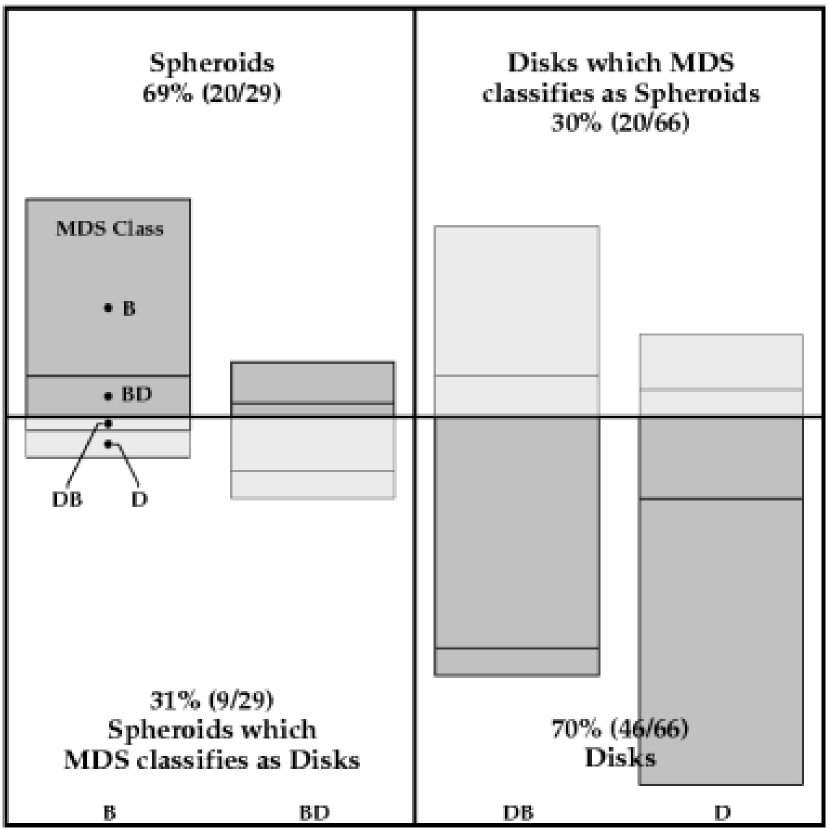
We visually classified the galaxy morphologies into four broad categories. These categories were selected to parallel the MDS classifications, as well as reflect the difficulties in placing faint, high-redshift sources into the traditional morphological classes, however there are close parallels between the two systems. EROs classified as spheroids or pure bulge galaxies (B) show no convincing evidence for the presence of a disk. Bulge-dominated (BD) systems show evidence of a disk, but the majority of the luminosity is coming from the spheroidal component, and any disk component is generally featureless. Disky systems with some evidence of a bulge (DB) generally show some evidence for structure in the disk (e.g. spiral arms or dust features), and the luminosity is not generally dominated by the spheroidal component. Finally, disks (D) do not show any obvious bulge component, and often have mottling or other structure visible in the disk. Some sources were too low of a SNR to classify, so they were listed as unclassifiable (U). We further noted whether the ERO appeared to be undergoing a strong merger or interaction with other nearby galaxies regardless of their color.
All of the EROs in our HST images were classified independently on a video display by both authors. We then combined the classifications and reviewed the sources together to resolve the disagreements, which involved 20% of the sample, and to settle on a final classification. We also reviewed the EROs grouped into their separate categories. This review involved looking at our reprocessed images as well as the MDS pipeline-processed images.
2.9 MDS Profile Fitting
For a more quantitative analysis of the galaxy properties, we utilized the galaxy profile fitting results from the MDS database. For almost all of our EROs, the MDS database includes a set of morphological parameters derived from their automated object detection and classification algorithms. More detailed information on the entire MDS reduction pipeline and morphological classification process can be found in Ratnatunga et al. (1994) and Ratnatunga et al. (1999), as well on the MDS website at http://astro.phys.cmu.edu/mds.html.
The MDS automated object classification involved a two-dimensional maximum likelihood estimator (MLE) analysis that automatically optimizes the model and the number of parameters to be fitted to each object image. Two scale-free, axisymmetric models are chosen to describe the galaxy profile. The spheroidal component, which would include elliptical galaxies and the bulges of spirals, is assumed to follow a de Vaucouleurs profile, while the extended disk component follows an exponential profile. Each profile is characterized by a major axis half-light radius and axis ratio. Point-like stellar sources are examined through the same procedure, except that a Gaussian profile is used. A maximum likelihood parameter estimation is used to determine the best model and the parameter values. For each set of model parameters, a model image of the object is created and compared with the actual object images. Finally, a best-fit model and its parameters are classified with the following categories for resolved sources: bulge, bulgedisk, disk, and galaxy (generally for low SNR sources where neither a bulge nor disk classification is significant). We use the model bulge to total luminosity ratio to divide bulgedisk galaxies into our classes BD (for ) and DB. This method does not classify irregulars, mergers, or interacting systems as such.
2.10 Comparison of Classifications
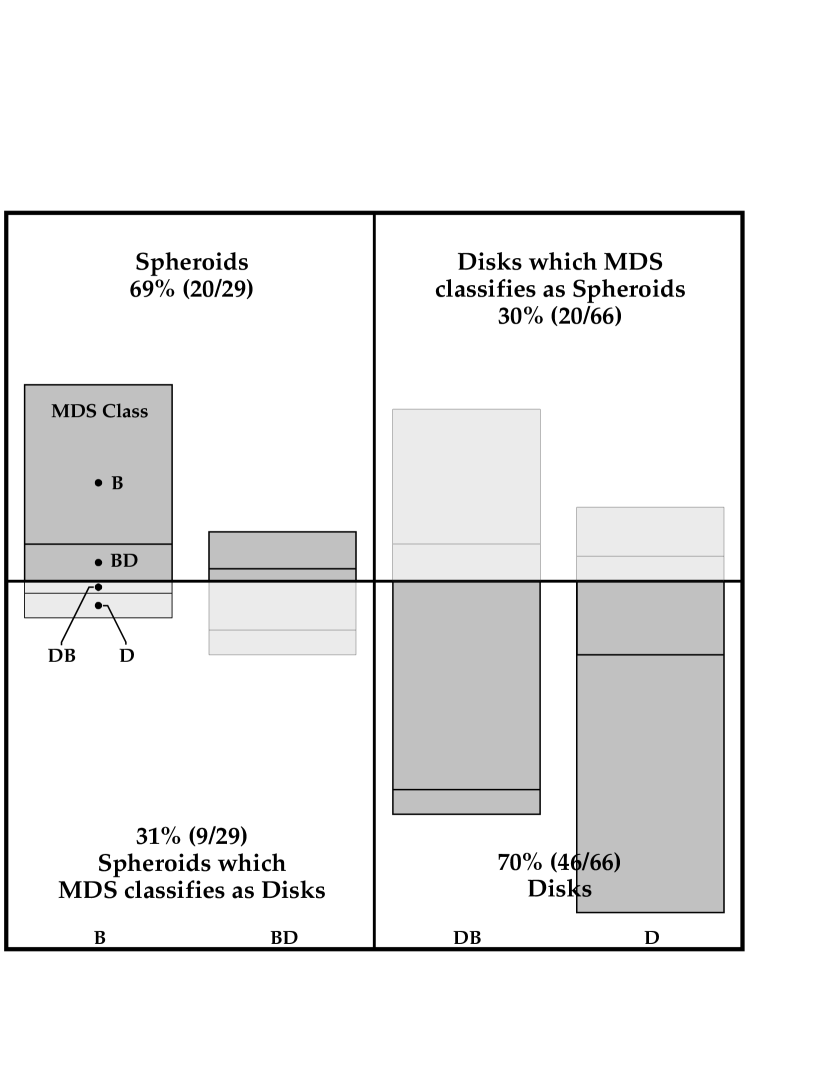
Figure 5 shows a comparison of the visual and MDS classification results for EROs classified by both methods. We group the B and BD classes under the label “spheroids” and the DB and D classes under the label “disks.” The darker gray areas show where the two methods agree reasonably well, while the lighter gray areas show the disagreements. Overall, the agreement is good, where both the “spheroids” and “disks.” in the two classification methods agree at the 70% level. The largest source of disagreement comes from EROs which were visually classified as DB (disk with a bulge), but which the MDS classified as a pure bulge. A majority of these systems are relatively faint in the HST images, where it can be difficult to distinguish between an extended spheroid or a disk, but also acknowledge the possibility of a fundamental failure in properly classifying sources visually. Most of the remaining disagreement stems from the split between BD and DB, and can be tuned out by modifying the division in the MDS bulge-to-total luminosity ratio from the arbitrary 50% bulge-to-total adopted for this study.
3 Results & Discussion
3.1 Morphological Distribution
Our morphologies are based on F814W images. Assuming the median redshift of one for EROs from the Cimatti et al. (2002) sample with K, the WFPC2 data sample a rest-frame wavelength of 4100 Å. The F814W images thus represent a compromise between sensitivity to star formation at shorter restframe wavelengths and better probing any extended old stellar populations at longer restframe wavelengths. As shown in simulations by Hibbard & Vacca (1997), morphological classifications using F814W images do not show any significant biases at .
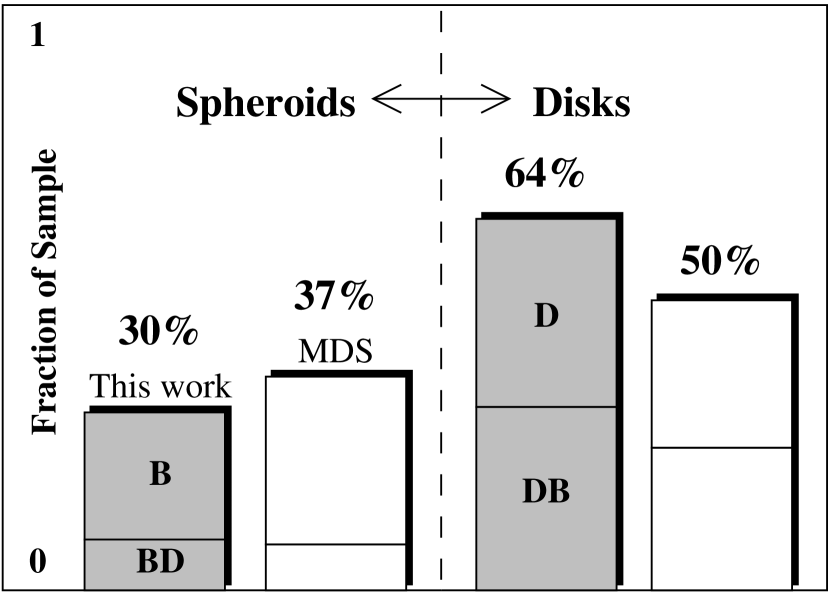
Using the results from our visual classification, we find that 305% of our EROs have morphologies consistent with spheroidal (B and BD) galaxies. Disks (D and DB) dominate the EROs at 647% of the sample. Only 6% of the EROs were unclassifiable, due primarily to low SNR on the WFPC images. The uncertainties are derived simply from the square root of the number of EROs in that subset, and does not try to include the unclassifiable sources. We plot in Figure 6 the relative fractions of spheroids and disks in our visual classification as well as from the MDS profile fitting.
We find that the relative morphological mix of EROs in subsets constructed of the EROs in known foreground galaxy cluster fields vs. those selected in the remaining “blank” fields is consistent to within the uncertainties. Since any lensing should be unbiased with respect to background galaxy morphologies, we do not differentiate between cluster and field sources in the remaining analysis.
Some of the EROs, including both disks and spheroids, appear to be involved in recent mergers or show evidence of strong interactions (e.g. tidal tails, strong asymmetries). These comprise 174% of the sample. Without additional information, these systems represent the most likely source of possible large-scale starbursts. This is consistent with the observation that among bright EROs, roughly 20% have 850m detections (Andreani et al., 1999). One third of the galaxies we classed as spheroids have one or more faint companions or show signs of recent interaction, suggesting that a significant fraction of otherwise old stellar populations may not be in purely passively evolving systems.
The morphological classifications derived from the MDS profile fitting are largely consistent with our visual results, but show a slightly higher fraction of spheroidal galaxies, with 376% of the sample classed as B or BD (with a bulge fraction larger than 50%). There is a corresponding drop in the disk fraction, with 507% classed as DB or D, but disks still dominate the overall ERO population. A larger fraction of the sample, 143%, were not fit with the bulgedisk models due to low SNR or a more conservative avoidance of the CCD edges in the WFPC2 data.
We find that our ERO sample selected with is dominated by disk galaxies, and not by spheroids or strongly interacting systems. The star formation rates in these disks could span a wide range, including normal galaxies with fairly quiescent star formation. HR 10 type systems, with mostly young stars and undergoing massive starbursts, may comprise only a small fraction of the sample. The origins of their red colors may be traced to a significant old stellar population combined with some dust extinction, especially considering the edge-on orientation of many of the disks in our sample of EROs. Even though most of the stellar mass may already be in place by for these EROs, such a large fraction of disk galaxies implies that there is still a substantial amount of gas available to feed on-going star formation.
The existence of such a large fraction of disk galaxies and interacting systems in our sample suggests that hierarchical merging may be an important mechanism for the formation and evolution of the ERO population. However, the scenario in which ellipticals were formed in a “monolithic collapse” at high redshifts and evolve passively thereafter cannot be excluded. While 30% of our ERO sample are clearly early type galaxies, whose colors are consistent with old stellar populations formed at high redshifts. We also found that one-third of the spheroids in our sample have faint companions or signs of interaction. This suggests that although a majority of their mass could be assembled rapidly at high redshift, these systems are not simply isolated, passively evolving old stellar populations, and continuing accretion of gas or merger events plays a significant role in their evolution. Examples of secondary star formation in field E/S0s () can be found in Treu (2002).
Our results contradict those of Moriondo, Cimatti & Daddi (2000), which are also based on HST morphologies. They find that 50–80% of their sample have E/S0 morphologies on the basis of one-component exponential model fits. However, we note that their ERO sample was assembled from the published literature, with the corresponding heterogeneous selection functions of the original surveys. In addition, the morphologies were determined on HST images from both WFPC2 and NICMOS, probing widely different rest-frame wavelengths and thus differing sensitivities to star formation or old stellar population.
3.2 Surface Density
The integrated surface density of EROs, is defined as total number of EROs brighter than a given magnitude per unit area on the sky. Because the area covered in this survey is a function of the magnitude, the differential number of EROs selected in each magnitude bin is a function of both the magnitude and the area surveyed. Calculating the integrated surface density thus required rescaling the number of EROs in each of the brighter bins by the appropriate area ratio prior to integration. We plot the resulting surface density of EROs from our survey derived by this method in Figure 7 (filled diamonds). The uncertainties were derived simply from the square root of the rescaled number of EROs.

For comparison, we also plot in Figure 7 the results from other recent surveys (Thompson et al., 1999; Smith et al., 2002a; Daddi et al., 2000; McCarthy et al., 2001; Cimatti et al., 2002; Barger et al., 1999). The primary difficulty in making such comparisons is that each survey used a different set of filters and different selection criteria for identifying EROs. In order to make a general comparison between these disparate surveys, we make several simplifying assumptions. First, we treat all K filters as functionally equivalent (e.g. ), so no color terms are applied to convert magnitudes between them. The same is true for the several different I filters and R filters used. We note that these assumptions are generally made in most recent published ERO surveys unless the color selection limit is explicitly tied to some fiducial model SED, typically a passively evolving old stellar population (i.e. elliptical galaxies), and the specific filters used for the survey. Second, we adopt the generic colors of ()13 and ()10 to convert the surveys based on R band or H band data to our colors. Third, we plot without additional correction the Cimatti et al. (2002) results, even though they select EROs at a bluer limit: ()50. Finally, we adopt the Barger et al. (1999) results directly for ()37, which they show to be equivalent to ()40 for that filter set.
While the generic color conversions we adopt obviate the possibility of more detailed comparisons between the different ERO surveys, they do allow us to consider broad trends in the surface densities as a function of the selection filters. First, the two I-band based surveys (this work and McCarthy et al. (2001)) agree quite well over the region . This suggests that our sample is neither significantly inhomogeneous nor incomplete over this range, although the turnover in counts to fainter magnitudes suggests incompleteness in our sample for . The two larger R-band based surveys (Thompson et al., 1999; Daddi et al., 2000) also agree with each other over this same range in K-band magnitude, but are systematically about a factor of three lower than the I-band surveys. The lensing-corrected surface density of EROs from the cluster-pointed survey of Smith et al. (2002a), despite using an R-band filter, agrees well with the I-band based surveys at brighter magnitudes (). The other two surveys, Cimatti et al. (2002); Barger et al. (1999), differ from the other results.
Aside from the uncertainties in converting from one filter system to another, there are two primary effects which can qualitatively account for the similarities and differences in the surface densities of EROs from these different surveys: cosmic variance, and color selection effects. Both the Cimatti et al. (2002) and Barger et al. (1999) surveys cover relatively small, connected areas on the sky, and are thus more subject to cosmic variance, especially considering the strong clustering seen in Daddi et al. (2000). The Smith et al. (2002a) survey is composed of 10 widely-separated sight lines and thus should be less sensitive to cosmic variance, but their sample does show a wide field-to-field variation in the number of EROs. Cimatti et al. (2002) selects EROs at a bluer limit, ()50, which likely contributes to their higher ERO surface density.
A color selection effect may contribute to the apparent differences in surface density between R-band based (Thompson et al., 1999; Daddi et al., 2000) and I-band based (this work and McCarthy et al. (2001)) ERO surveys. We offer below (see §3.5) a qualitative argument on this, as we do not have a proper multiband deep survey to address this with real data.
3.3 Volume Density
We can make an estimate of the volume density of EROs with some assumptions on the range of redshifts at which they may be found, and compare these results with the local density of massive galaxies. The color selection limit of () 40 sets the lower redshift bound to , which is appropriate for passively evolving old stellar populations. However, photometric uncertainties could make this boundary somewhat fuzzy. Galaxies with significant dust extinction (see the following section) could also lie at lower redshifts. Cimatti et al. (2002) obtained spectroscopic redshifts for a sample of EROs with ()5 which includes sources of both types down to . We adopt an upper cutoff to the assumed redshift range of , as higher redshift EROs would be anomalously luminous given their bright -band magnitudes.
Under the above assumptions, we derive a co-moving volume covered by our survey to be Mpc3. This volume is only weakly dependent on the assumed redshift range, and only changes by a factor of two if the redshift range is narrowed to or broadened to . This volume was derived from the total survey area of 409 square arcminutes, and does not take into account the variable survey depth with magnitude.
The galaxies classed as spheroids in our survey have a co-moving volume density of Mpc-3. The disks have a co-moving volume density about twice as large, and the total ERO sample (115 EROs) reach a density of Mpc-3.
To compare with nearby massive galaxies, we adopt the local K-band luminosity functions for early-type and late type galaxies from Kochanek et al. (2001). We integrate from 10L∗ down to 1L∗, which corresponds to our K-band limit at after correcting for passive evolution and cosmological K-corrections. We find that the EROs can account for only one-third of the local massive galaxies, and that the relative morphological mix is about the same in the two samples. This is reasonable, but should be considered only an order-of-magnitude agreement given the factors of 2 uncertainties in the volume densities arising from the assumptions on the redshift distributions, area surveyed as a function of depth (§2.5), and contamination (§3.4).
3.4 Dust Extinction in Disky EROs
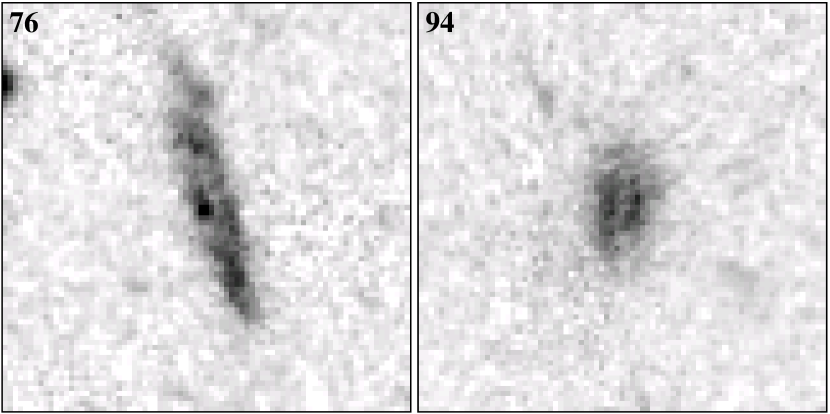
While classifying the EROs, we also noted that 40% of the disky systems (DB and D) appeared to be sufficiently edge-on that even small amounts of dust in a disk could have a disproportionately large effect on the overall system color. These systems are noted in Table 2 with italicized entries under morphology: DB and D, and we show two examples of edge-on EROs in Figure 8. This is far more than expected from a set of randomly oriented galaxies, suggesting that orientation effects are responsible for their inclusion in the ERO sample.
Given the potentially large extinctions possible from dust in otherwise normal disk galaxies, it is possible that the edge-on systems are at lower redshift (). Several of these show extended disks of large apparent size (several arcseconds), which would be unusually large (tens of kiloparsecs) if at or more. The edge-on systems comprise half of the disky EROs, or one-third of the total () selected ERO sample. They thus represent a large and previously unanticipated source of contamination in the ERO population.
3.5 Color Selection Effects
How comparable are ERO samples selected using an color versus an color? This important issue has never been clearly addressed. We investigated this issue using model spectral energy distributions, but lack the necessary multiband data to compare to the models. Deep, wide-field infrared/optical surveys should be able to address this point in more detail.
In Figure 9 we plot the () vs. () colors for a Bruzual & Charlot (1996) model approximating an old stellar population (OSP, ) or passively evolving elliptical galaxy. We also plot two models with longer exponential decay times () but differing formation redshifts (), which should contain a significant fraction of old stars in the range of , but still have some residual star formation. A similar plot covering the color-color plane can be found in (McCarthy et al., 2001, their Figure 2). Their data show that EROs selected with () 3 have a wide scatter in the color, which the authors interpreted as due to prolonged star formation.

The two dotted lines in Figure 9 mark the fiducial colors () 53 and () 40, representing the colors of a passively-evolving elliptical galaxy used by most surveys to select EROs. The squares mark the points in each model curve. Assumptions on the models used, as well as the assumed cosmology and the specific filter bandpasses used for ERO surveys can account for several tenths of a magnitude variation in the expected colors of a passively-evolving elliptical galaxy.
Several predictions can be made from this color selection effect. First, is that both R-band and I-band based ERO surveys should select the same population of passively-evolving old stellar populations (elliptical galaxies). Second, I-band based ERO surveys should preferentially include disk galaxies. Light from a bulge comprised of older stars would dominate the () color, while even small amounts of residual star formation in the disk keeps them too blue in () to be included in an () selected sample. Other factors, such as dust extinction, may counteract the star-formation and contribute significantly to their overall color. This implies that ERO samples selected on their () color may not be comparable to samples selected on their () color.
Figure 9 can also be used to set some constraints on the formation redshift for the EROs. Models with exponential decay times longer than about 1.5 Gyr (), or with a formation redshift lower than five () simply have too much residual star formation. Without any reddening from dust, the blue light from a young population of stars would be sufficient to drop these galaxies out of either () or () samples of EROs. Thus, the brighter EROs classed as spheroids, especially those without any evidence of a disk or ongoing star formation, are likely to have formed a majority of their stars at relatively high redshift ().
The morphological mix in our sample of relatively bright, ()-selected EROs is similar to that of Smith et al. (2002a) among a sample of fainter EROs (, ) identified in the fields of foreground clusters massive enough to gravitationally lens the higher redshift EROs. They classify 18% of their sample as compact, and 50% as irregulars (including disk-like systems), while 32% are too faint to be classified.
Considering redder subsamples from both this work () and Smith et al. (2002a) (), we again find similar results. Of the 11 redder EROs in our sample, nine were classifiable. Of these nine, 8931% have disk morphologies, a much higher fraction than in the full sample. The redder Smith et al. (2002a) subsample has 90% with disk/irregular morphologies.
The expectation from the color selection effect is that (R-K) samples should contain a higher fraction of spheroids at a given magnitude limit. However, the fainter Smith et al. (2002a) sample, about three magnitudes deeper than our ERO sample, is composed primarily of irregulars and disks. This suggests that the morphological mix of EROs does change at fainter magnitudes, and Smith et al. (2002a) conclusion that fainter and redder samples are dominated by massive, dusty starbursts does not contradict our findings. Clearly, this color selection effect needs to be investigated further, with larger and deeper samples of EROs with both (R-K) and (I-K) selection on the same area of sky, so that a proper comparison can be made.
4 Summary
Our results highlight the complex nature of optical/near-IR color selected EROs. The high resolution HST morphologies indicate that disks are the dominant constituent of the bright ( mag) ERO population selected with an color greater than or equal to 4 magnitudes. Galaxies classified as spheroids, which can be considered comparable to passively evolving elliptical or S0 galaxies, and strongly interacting systems which may represent dusty starbursts, only contribute small fractions to the total ERO population. There are real differences in the surface densities of EROs selected by their color as compared to the samples, which may reflect a preferential selection of disks in I-band based ERO surveys and in any case complicates the comparison of various surveys and their interpretation. In addition, edge-on disk galaxies comprise a significant fraction of our ERO sample: 40% of the disks, or 28% of the full sample. Even small amounts of dust in this orientation could redden otherwise normal disk galaxies at lower redshift () sufficiently to be included in the ERO samples. Our results imply that hierarchical merging and continuing accretion of gas still play an important and continuing role in the evolution of massive galaxies, even though most of their stellar mass may already be in place by .
References
- Afonso et al. (2001) Afonso, J., Mobasher, B., Chan, B., & Cram, L. 2001, ApJ, 559, L101
- Andreani et al. (1999) Andreani, P. Cimatti, A., Röttgering, H., & Tilanus, R. 1999, Ap&SS, 266, 267
- Barger et al. (1999) Barger, A.J., Cowie, L.L., Trentham, N., Fulton, E., Hu, E.M., Songaila, A., & Hall, D. 1999, AJ, 117, 102
- Bertin & Arnouts (1996) Bertin, E. & Arnouts, S. 1996, A&AS, 117, 393
- Bruzual & Charlot (1996) Bruzual, G. & Charlot, S. 1996 …
- Chapman, McCarthy, & Persson (2000) Chapman, S.C., McCarthy, P.J., & Persson, S.E. 2000, AJ, 120, 1612
- Cimatti et al. (1998) Cimatti, A., Andreani, P., Röttgering, H., & Tilanus, R. 1998, Nature, 392, 895
- Cimatti et al. (2000) Cimatti, A., Villani, D., Pozzetti, L., & di Serego Alighieri, S. 2000, MNRAS, 318, 453
- Cimatti et al. (2002) Cimatti, A., Daddi, E., Mignoli, M., Pozzetti, L., Renzini, A., Zamorani, G., Broadhurst, T., Fontana, A., Saracco, P., Poli, F., Cristiani, S., D’Odorico, S., Giallongo, E., Gilmozzi, R., & Menci, N. 2002, A&A, 381, 68
- Couch et al. (1998) Couch, W.J., Barger, A.J., Smail, I., Ellis, R.S., & Sharples, R.M. 1998, ApJ, 497, 188
- Daddi et al. (2000) Daddi, E., Cimatti, A., Pozzetti, L., Hoekstra, H., Röttgering, H.J.A., Renzini, A., Zamorani, G., & Mannucci, F. 2000, A&A, 361, 535
- Daddi, Cimatti, & Renzini (2000) Daddi, E., Cimatti, A. & Renzini, A. 2000, A&A, 362, L45
- Dey, Spinrad, & Dickinson (1995) Dey, A., Spinrad, H., & Dickinson, M. 1995, ApJ, 440, 515
- Dey et al. (1999) Dey, A., Graham, J.R., Ivison, R.J., Smail, I., Wright, G.S., & Liu, M.C. 1999, ApJ, 519, 610
- Djorgovski et al. (1995) Djorgovski, S., Soifer, B. T., Pahre, M. A., Larkin, J. E., Smith, J. D., Neugebauer, G., Smail, I., Matthews, K., Hogg, D. W., Blandford, R. D., Cohen, J., Harrison, W., & Nelson, J. 1995, ApJ, 438, L13
- Dressler et al. (1997) Dressler, A., Oemler, A.Jr., Couch, W.J., Smail, I., Ellis, R.S., Barger, A., Butcher, H., Poggianti, B.M., & Sharples, R.M. 1997, ApJ, 490, 577
- Eisenhardt & Dickinson (1992) Eisenhardt, P. & Dickinson, M. 1992, ApJ, 399, L47
- Ellis et al. (2001) Ellis, R.S., Santos, M.R., Kneib, J.-P., & Kuijken, K. 2001, ApJ, 560, L119
- Elston, Rieke, & Rieke (1989) Elston, R., Rieke, G. H., & Rieke, M. J. 1989, ApJ, 341, 80
- Elston, Rieke, & Rieke (1988) Elston, R., Rieke, M. J., & Rieke, G. H. 1988, ApJ, 331, L77
- Graham & Dey (1996) Graham, J.R., Dey, A. 1996, ApJ, 471, 720
- Graham et al. (1994) Graham, J.R., Matthews, K., Soifer, B. T., Nelson, J. E., Harrison, W., Jernigan, J. G., Lin, S., Neugebauer, G., Smith, G., & Ziomkowski, C. 1994, ApJ, 420, L5
- Griffith et al. (1994) Griffiths, R.E., Casertano, S., Ratnatunga, K.U., Neuschaefer, L.W., Ellis, R.S., Gilmore, G.F., Glazebrook, K., Santiago, B., Huchra, J.P., Windhorst, R.A., Pascarelle, S.M., Green, R.F., Illingworth, G.D., Koo, D.C., & Tyson, A.J. 1994, ApJ, 435, L19
- Hibbard & Vacca (1997) Hibbard, J.E. & Vacca, W.D. 1997, AJ, 114, 1741
- Holland et al. (1999) Holland, W.S., Robson, E.I., Gear, W.K., Cunningham, C.R., Lightfoot, J.F., Jenness, T., Ivison, R.J., Stevens, J.A., Ade, P.A.R., Griffin, M.J., Duncan, W.D., Murphy, J.A., & Naylor, D.A. 1999, MNRAS, 303, 659
- Hu & Ridgeway (1994) Hu, E. M. & Ridgeway, S. E. 1994, AJ, 107, 1303
- Im et al. (2002) Im, M., Yamada, T., Tanaka, I., & Kajisawa, M. 2002, ApJ, 578, L19
- Kochanek et al. (2001) Kochanek, C.S., Pahre, M.A., Falco, E.E., Huchra, J.P., Mader, J., Jarrett, T.H., Chester, T., Cutri, R., & Schneider, S.E. 2001, ApJ, 560, 566
- Lawrence et al. (1995) Lawrence, C.R., Elston, R., Januzzi, B.T., & Turner, E.L. 1995, AJ, 110, 2570
- Liu et al. (2000) Liu, M.C., Dey, A., Graham, J.R., Bundy, K.A., Steidel, C.C., Adelberger, K., & Dickinson, M.E. 2000, AJ, 119, 2556
- Lubin et al. (1998) Lubin, L.M., Postman, M., Oke, J.B., Ratnatunga, K.U., Gunn, J.E., Hoessel, J.G., & Schneider, D.P. 1998, AJ, 116, 584
- Mannucci et al. (2002) Mannucci, F., Pozzetti, L., Thompson, D., Oliva, E., Baffa, C., Comoretto, G., Gennari, S., & Lisi, F. 2002, MNRAS, 329, L57
- McCarthy, Persson, & West (1992) McCarthy, P. J., Persson, S. E., & West, S. C. 1992, ApJ, 386, 52
- McCarthy et al. (2001) McCarthy, P.J., Carlberg, R.G., Chen, H.-W., Marzke, R.O., Firth, A.E., Ellis, R.S., Persson, S.E., McMahon, R.G., Lahav, O., Wilson, J., Martini, P., Abraham, R.G., Sabbey, C.N., Oemler, A., Murphy, D.C., Somerville, R.S., Beckett, M.G., Lewis, J.R., & MacKay, C.D. 2001, ApJ, 560, L131
- Mohan et al. (2002) Mohan, N.R., Cimatti, A., Röttgering, H.J.A., Andreani, P., Severgnini, P., Tilanus, R.P.J., Carilli, C.L., & Stanford, S.A. 2002, A&A, 383, 440
- Moriondo, Cimatti & Daddi (2000) Moriondo, G., Cimatti, A., Daddi, E. 2000, A&A, 364, 26
- Murphy et al. (1995) Murphy, D., Persson, S.E., Pahre, M.A., Sivaramakrishnan, A., & Djorgovski, S.G. 1995, PASP, 107, 1234
- Odewahn et al. (1996) Odewahn, S.C., Windhorst, R.A., Driver, S.P., Keel, W.C. 1996, ApJ, 472, L13
- Persson et al. (1993) Persson, S. E., McCarthy, P. J., Dressler, A., Matthews, K. 1993, in The Evolution of Galaxies and Their Environment, ed. D. Hollenbeck et al., NASA Conference Publication #3190, p. 78
- Poggianti & Wu (2000) Poggianti, B.M. & Wu, H. 2000, ApJ, 529, 157
- Pozzetti & Mannucci (2000) Pozzetti, L. & Mannucci, F. 2000, MNRAS, 317, L17
- Ratnatunga et al. (1994) Ratnatunga, K.U., Griffiths, R.E., Casertano, S., Neuschaefer, L.W., & Wyckoff, E.W. 1994, AJ, 108, 2362
- Ratnatunga et al. (1999) Ratnatunga, K., Griffiths & Ostrander, E. 1999, AJ, 118, 86
- Smail et al. (1998) Smail, I., Ivison, R.J., Blain, A.W., & Kneib, J.-P. 1998, ApJ, 507, L21
- Smail et al. (1999) Smail, I., Ivison, R.J., Kneib, J.-P., Cowie, L.L., Blain, A.W., Barger, A.J., Owen, F.N., & Morrison, G. 1999, MNRAS, 308, 1061
- Smith et al. (2002a) Smith, G.P., Smail, I., Kneib, J.-P., Czoske, O., Ebeling, H., Edge, A.C., Pelló, R., Ivison, R.J., Packham, C., & Le Borgne, J.-F. 2002a, MNRAS, 330, 1
- Smith et al. (2002b) Smith, G.P., Smail, I., Kneib, J.-P., Davis, C.J., Takamiya, M., Ebeling, H., & Czoske, O. 2002b, MNRAS, 333, L16
- Soifer et al. (1994) Soifer, B. T., Matthews, K., Djorgovski, S., Larkin, J., Graham, J. R., Harrison, W., Jernigan, G., Lin, S., Nelson, J., Neugebauer, G., Smith, G., Smith, J. D., & Ziomkowski, C. 1994, ApJ, 420, L1
- Soifer et al. (1999) Soifer, B.T., Matthews, K., Neugebauer, G., Armus, L., Cohen, J.G., Persson, S.E., & Smail, I. 1999, AJ, 118, 2065
- Thompson et al. (1999) Thompson, D., Beckwith, S. V. W., Fockenbrock, R., Fried, J., Hippelein, H., Huang, J.-S., von Kuhlmann, B., Leinert, Ch., Meisenheimer, K., Phleps, S., Röser, H.-J., Thommes, E., & Wolf, C. 1999, ApJ, 523, 100
- Treu (2002) Treu, T., Stiavelli, M., Casertano, S., Møller, P., & Bertin, G. 2002, ApJ, 564, L13
- Treu (1998) Treu, T., Stiavelli, M., Walker, A.R., Williams, R.E., Baum, S.A., Bernstein, G., Blacker, B.S., Carollo, C.M., Casertano, S., Dickinson, M.E., Demello, D.F., Ferguson, H.C., Fruchter, A.S., Lucas, R.A., MacKenty, J., Madau, P., & Postman, M. 1998, A&A, 340, L10
- van Dokkum & Stanford (2001) van Dokkum, P. & Stanford, A. 2001, ApJ, 562, L35
| MDS | NERO | FWHM | Exp Time (s) | MDS | NERO | FWHM | Exp Time (s) | ||||
|---|---|---|---|---|---|---|---|---|---|---|---|
| Field | limitaaThe limiting magnitudes are derived from the sky noise in the center of each infrared mosaic image, and are quoted as 5 limits for a point source within an aperture diameter 2.5 times the FWHM of the seeing. | arcsec | Field | limitaaThe limiting magnitudes are derived from the sky noise in the center of each infrared mosaic image, and are quoted as 5 limits for a point source within an aperture diameter 2.5 times the FWHM of the seeing. | arcsec | ||||||
| u2845i8 | 5 | 18.85 | 1.25 | 5400 | 16000 | ufj00i2 | 3 | 19.02 | 1.37 | 4800 | 4200 |
| u29g1i6 | 0 | 18.55 | 1.43 | 5400 | 6600 | ug502i4 | 0 | 18.54 | 1.68 | 3750 | 1700 |
| u29g3i6 | 0 | 18.71 | 1.68 | 4350 | 6600 | ugi00i2 | 0 | 18.27 | 1.74 | 2700 | 4700 |
| u2b15i6 | 2 | 18.62 | 1.62 | 4500 | 3600 | ugk00i2 | 0 | 18.45 | 1.56 | 3750 | 5400 |
| u2c41i8 | 0 | 18.85 | 1.56 | 6450 | 16800 | uha01i3 | 0 | 18.97 | 1.68 | 6750 | 4200 |
| u2c47i6 | 3 | 19.29 | 1.50 | 9000 | 12600 | uhg00i2 | 1 | 19.25 | 1.62 | 9750 | 5600 |
| u2c48i6 | 3 | 18.63 | 1.99 | 4500 | 12600 | uho00i3 | 1 | 18.89 | 1.62 | 4500 | 4500 |
| u2fl1i5 | 2 | 18.77 | 1.68 | 4500 | 10500 | uih00i2 | 0 | 18.58 | 1.87 | 4500 | 4200 |
| u2fq1i5 | 14 | 18.67 | 1.25 | 4800 | 10500 | uim03i3 | 4 | 19.07 | 1.56 | 7650 | 4000 |
| u2fq2i6 | 1 | 18.58 | 1.37 | 5400 | 12600 | ujh01i2 | 1 | 18.87 | 1.99 | 4500 | 4200 |
| u2gk1i3 | 1 | 18.62 | 1.68 | 4500 | 4800 | uko01i2 | 2 | 19.07 | 1.56 | 5850 | 4200 |
| u2h91ic | 2 | 18.80 | 1.37 | 5400 | 28800 | ulj00i4 | 3 | 19.49 | 1.43 | 13050 | 5100 |
| u2iy1i6 | 1 | 18.43 | 1.93 | 3750 | 6400 | uo501i3 | 5 | 18.93 | 1.50 | 12450 | 6300 |
| u2iy2i6 | 0 | 18.67 | 1.62 | 4500 | 6400 | upj00i2 | 0 | 18.97 | 1.56 | 4500 | 4200 |
| u2uj2i3 | 1 | 18.64 | 1.43 | 4350 | 3600 | uqc00i2 | 2 | 18.64 | 1.25 | 5400 | 4200 |
| u2uj7i3 | 2 | 18.71 | 1.68 | 3750 | 3600 | uqc01i2 | 2 | 19.15 | 1.43 | 9150 | 7200 |
| u2um1ia | 0 | 18.72 | 1.37 | 3750 | 11000 | uqg00i2 | 0 | 18.42 | 1.31 | 2700 | 3600 |
| u2v12i5 | 0 | 18.22 | 1.99 | 3000 | 6700 | uqj10i3 | 3 | 18.93 | 1.50 | 5250 | 4100 |
| u2v14i5 | 0 | 18.62 | 1.25 | 4200 | 6700 | uqk00i2 | 6 | 19.26 | 1.50 | 9000 | 2450 |
| u2v15i5 | 0 | 18.34 | 1.62 | 2700 | 6700 | uqk02i4 | 2 | 18.89 | 1.62 | 4500 | 6600 |
| u2v16i5 | 1 | 19.07 | 1.56 | 10650 | 6700 | uqk04i4 | 1 | 19.06 | 1.56 | 4500 | 4000 |
| u2v18i5 | 1 | 18.72 | 1.87 | 4350 | 6700 | uqk11i5 | 3 | 18.93 | 1.37 | 4350 | 3100 |
| u2v19i5 | 2 | 18.73 | 1.99 | 4200 | 6700 | uql00i2 | 1 | 18.78 | 2.12 | 6000 | 4200 |
| u3063i6 | 1 | 18.95 | 1.37 | 4500 | 14400 | uri01i3 | 0 | 18.59 | 1.99 | 4500 | 3000 |
| u30h1i4 | 0 | 18.75 | 1.74 | 4500 | 5000 | usa00i3 | 1 | 18.68 | 1.68 | 4500 | 6300 |
| u30h2i4 | 0 | 19.07 | 1.56 | 4500 | 5300 | usa02i3 | 0 | 18.62 | 1.37 | 4050 | 6300 |
| ubb10i2 | 0 | 18.45 | 1.93 | 4200 | 5800 | usc10i7 | 1 | 18.82 | 1.68 | 9050 | 4500 |
| ubi02i2 | 3 | 19.30 | 1.68 | 8850 | 4700 | usc12i4 | 2 | 18.58 | 1.31 | 5250 | 4135 |
| ubm00i3 | 1 | 18.81 | 1.56 | 4500 | 5400 | utb11i3 | 0 | 18.39 | 1.62 | 2700 | 9100 |
| uci10i4 | 2 | 18.86 | 1.37 | 4950 | 10800 | uub01i2 | 0 | 18.29 | 1.68 | 2700 | 2700 |
| udh00i2 | 1 | 18.80 | 1.56 | 4500 | 3300 | uuc04i6 | 2 | 18.72 | 1.62 | 7200 | 3900 |
| udm00i2 | 0 | 18.69 | 1.74 | 4500 | 3000 | uvm01i2 | 1 | 19.02 | 1.37 | 4500 | 4600 |
| udm10i3 | 1 | 18.75 | 1.87 | 4500 | 5400 | uwp00i3 | 1 | 18.61 | 1.99 | 4500 | 8400 |
| uec00i2 | 4 | 18.48 | 1.37 | 2700 | 3000 | ux400i4 | 2 | 18.69 | 1.50 | 4350 | 7500 |
| ued01i2 | 0 | 18.53 | 1.37 | 2700 | 5600 | uxn00i2 | 0 | 18.89 | 1.87 | 4500 | 2800 |
| ueg00i3 | 0 | 18.60 | 1.37 | 2700 | 6300 | uxs10i3 | 1 | 18.74 | 1.43 | 4500 | 6200 |
| ueh02i2 | 3 | 18.42 | 1.62 | 2700 | 4200 | uys00i2 | 1 | 18.61 | 1.87 | 4500 | 4600 |
| uem00i5 | 0 | 18.69 | 2.06 | 4500 | 6600 | uzk03i3 | 1 | 18.84 | 1.81 | 4500 | 4900 |
| ufg00i2 | 5 | 18.65 | 1.74 | 4050 | 4700 | ||||||
| # | MDS ID# | CoordinatesaaCoordinates are in the format 00h00m0000 00∘00′0000, derived from the HST world coordinate system. | / | Morph.ClassbbMorphological classifications from this paper (YT) and the Medium Deep Surcey (MDS). The primary classifications are (B) Bulge, (BD) Bulge-dominated disk, (DB) Disk with a bulge, and (D) Disk. See text for further details. | CommentsccAbbreviations in the comments: lglarge; asymasymmetric; 1fc, 2fc, mfc[1,2,multiple] faint companions; 1bc, 2bc, mbc[1,2,multiple] bright companions; LSBLow Surface Brightness; AGNActive Galactic Nucleus; dbldouble; nuclnucleus; vvery; irrirregular; posspossible; compcompanion. | |||
|---|---|---|---|---|---|---|---|---|
| (J2000) | YTddItalicized entries indicate that the galaxy appears sufficiently inclined that dust may make a significant contribution to the integrated color. | MDS | ||||||
| 1 | ufg00#140 | 0:18:22.2928 16:20:54.975 | 18.05 / 5.85 | 6.8 | 7.3 | D | G | asym disk or 1fc |
| 2 | ufg00#070 | 0:18:29.1165 16:20:56.226 | 18.27 / 5.23 | 7.2 | 5.8 | DB | B | asym disk |
| 3 | ufg00#121 | 0:18:30.1373 16:20:39.685 | 18.29 / 4.27 | 6.4 | 12.6 | D | B | faint asym disk? |
| 4 | ufg00#044 | 0:18:31.2524 16:20:43.706 | 17.68 / 4.16 | 9.4 | 33.4 | B | B | mfc, merger? |
| 5 | ufg00#083 | 0:18:31.5131 16:20:40.797 | 18.05 / 4.60 | 5.9 | 15.5 | B | G | 1fc + tail, merger? |
| 6 | uhg00#049 | 0:20:11.5736 28:36:51.713 | 18.12 / 4.24 | 9.6 | 26.6 | ID | DB | DB + lg tidal tail |
| 7 | udh00#057 | 0:45:02.1324 10:34:42.958 | 18.58 / 4.05 | 5.6 | 13.1 | D | B | faint disk |
| 8 | ueh02#120 | 0:53:35.3406 12:49:29.408 | 18.28 / 4.15 | 5.8 | 16.5 | D | D | asym, LSB |
| 9 | ueh02#063 | 0:53:35.6556 12:49:50.997 | 17.43 / 4.82 | 11.4 | 29.7 | B | BD | faint disk |
| 10 | ueh02#104 | 0:53:39.9393 12:49:34.931 | 18.08 / 4.92 | 5.8 | 15.2 | DB | B | asym or 1fc |
| 11 | ujh01#118 | 1:09:03.3016 35:35:36.262 | 18.71 / 4.62 | 5.4 | 11.7 | D | D | lg disk |
| 12 | ubi02#055 | 1:09:56.7526 02:26:18.601 | 18.49 / 4.03 | 8.6 | 23.6 | D | B | asym disk |
| 13 | ubi02#062 | 1:09:57.0151 02:27:34.353 | 18.46 / 4.71 | 8.7 | 14.4 | B | B | faint disk? |
| 14 | ubi02#013 | 1:10:00.4624 02:27:37.273 | 17.04 / 4.18 | 28.8 | 99.9 | B | S | stellar core + mfc, AGN? |
| 15 | uci10#013 | 1:24:40.8825 03:50:45.704 | 17.57 / 4.17 | 15.5 | 99.9 | B | BD | bright spheroid |
| 16 | uci10#051 | 1:24:45.9369 03:51:19.209 | 18.62 / 4.02 | 5.3 | 18.6 | ID | D | dbl nucl + mfc, merger |
| 17 | ubm00#093 | 2:01:50.2325 11:41:14.232 | 18.29 / 4.30 | 7.6 | 27.3 | DB | D | asym disk |
| 18 | ufj00#077 | 2:07:01.3073 15:26:18.414 | 18.67 / 4.08 | 5.0 | 23.1 | DB | DB | asym disk |
| 19 | ufj00#052 | 2:07:05.7003 15:24:55.156 | 17.74 / 4.70 | 15.5 | 19.2 | DB | B | lg LSB disk, asym nucl |
| 20 | ufj00#047 | 2:07:07.6300 15:24:43.365 | 18.29 / 4.14 | 9.0 | 24.8 | B | B | stellar core + 2fc, AGN? |
| 21 | u2c48#049 | 2:39:56.0682 01:37:07.046 | 17.33 / 4.25 | 15.7 | 77.1 | ID | D | merger, lg tidal tail? |
| 22 | u2c48#078 | 2:39:59.2569 01:37:21.172 | 17.55 / 4.35 | 13.2 | 46.7 | DB | DB | lg disk, dust/arms |
| 23 | u2c48#114 | 2:40:00.5682 01:37:07.237 | 18.22 / 4.45 | 6.3 | 28.1 | D | DB | face-on LSB disk or mfc |
| 24 | udm10#100 | 2:42:52.0311 00:05:08.190 | 18.45 / 4.73 | 5.0 | 7.2 | IU | G | spur or fc to disk |
| 25 | ulj00#053 | 2:43:50.2612 37:17:53.956 | 18.49 / 4.34 | 11.7 | 15.0 | DB | B | faint asym disk or 1fc |
| 26 | ulj00#219 | 2:43:50.3033 37:17:23.852 | 19.12 / 5.72 | 7.0 | 2.7 | D | D | v.faint LSB disk |
| 27 | ulj00#114 | 2:43:50.8212 37:17:14.400 | 19.22 / 4.26 | 6.7 | 7.8 | D | G | irr, asym |
| 28 | u2iy1#022 | 3:02:47.3464 00:13:08.655 | 17.22 / 4.45 | 9.8 | 53.8 | DB | DB | lg disk |
| 29 | u2v19#079 | 3:38:37.9233 00:13:03.154 | 18.33 / 4.30 | 6.5 | 17.6 | D | D | lg LSB disk |
| 30 | u2v19 | 3:38:38.5961 00:12:42.727 | 17.69 / 4.15 | 12.4 | 48.9 | B | - | 2 EROs (2″sep) |
| 31 | u2v18#036 | 3:41:09.5269 00:00:18.660 | 17.90 / 4.43 | 7.7 | 42.9 | B | BD | asym |
| 32 | uim03#102 | 3:55:31.1522 09:44:47.822 | 18.60 / 4.04 | 7.7 | 15.0 | DB | D | |
| 33 | uim03#089 | 3:55:32.3447 09:44:49.683 | 18.57 / 4.02 | 6.6 | 18.9 | BD | B | faint disk? |
| 34 | uim03#100 | 3:55:32.8000 09:44:47.262 | 18.34 / 4.51 | 7.6 | 12.7 | BD | DB | asym |
| 35 | uim03#075 | 3:55:35.4355 09:42:43.514 | 17.94 / 4.63 | 8.1 | 16.5 | DB | DB | asym |
| 36 | u2fl1#038 | 4:14:41.8303 05:35:47.750 | 17.84 / 4.50 | 7.2 | 39.7 | D | DB | asym, 1fc |
| 37 | u2fl1#044 | 4:14:43.0621 05:34:39.376 | 18.29 / 4.20 | 7.1 | 32.4 | B | B | 1fc |
| 38 | uho00#069 | 4:16:55.7078 05:59:36.262 | 18.64 / 4.62 | 6.0 | 9.9 | DB | DB | LSB disk |
| 39 | uko01#043 | 4:56:49.0888 03:52:37.939 | 18.21 / 4.10 | 6.7 | 34.5 | B | D | bright, resolved core |
| 40 | uko01#023 | 4:56:43.3215 03:53:33.905 | 18.85 / 4.00 | 5.1 | 22.1 | B | B | 1fc |
| 41 | uqk11#019 | 7:24:41.3649 60:29:37.564 | 17.07 / 4.08 | 9.0 | 83.0 | D | BD | lg disk, asym, dust |
| 42 | uqk11#077 | 7:24:43.8276 60:31:37.111 | 18.21 / 4.39 | 6.2 | 17.9 | D | D | LSB disk or irr |
| 43 | uqk11#048 | 7:24:46.6626 60:30:35.571 | 18.11 / 4.00 | 6.6 | 27.3 | DB | DB | asym |
| 44 | uqj10#027 | 7:27:20.6173 69:05:46.966 | 17.73 / 4.05 | 6.8 | 44.7 | D | D | LSB disk, 1bc |
| 45 | uqj10#062 | 7:27:25.4097 69:06:17.115 | 18.42 / 4.65 | 7.4 | 10.9 | D | DB | LSB disk or irr |
| 46 | uqj10#080 | 7:27:42.9072 69:06:50.422 | 18.46 / 5.27 | 5.1 | 17.3 | D | D | asym |
| 47 | uqk02#042 | 7:41:25.8953 65:06:02.339 | 18.55 / 4.01 | 6.0 | 14.4 | DB | DB | asym or 1fc |
| 48 | uqk02#064 | 7:41:31.6545 65:06:09.883 | 18.51 / 4.40 | 6.3 | 11.3 | D | D | dbl nucl |
| 49 | uqk00#133 | 7:42:37.6428 65:06:32.076 | 18.38 / 5.38 | 7.1 | 4.9 | U | G | compact, asym |
| 50 | uql00#314 | 7:42:39.3423 49:44:31.800 | 18.54 / 4.37 | 5.2 | 18.9 | U | G | v.faint, LSB |
| 51 | uqk00#299 | 7:42:44.2458 65:05:49.770 | 18.77 / 4.36 | 5.8 | 9.7 | U | D | v.faint, asym |
| 52 | uqk00#096 | 7:42:44.6454 65:05:49.863 | 18.71 / 4.12 | 6.3 | 12.0 | D | D | LSB disk or irr |
| 53 | uqk00#066 | 7:42:49.2476 65:05:06.184 | 18.77 / 4.21 | 5.1 | 11.4 | D | D | LSB disk, asym or 1bc |
| 54 | uqk04#039 | 7:42:49.6767 65:15:43.206 | 18.03 / 4.09 | 10.8 | 7.1 | B | B | asym nucl |
| 55 | uqk00 | 7:42:49.7006 65:06:08.519 | 18.78 / 4.04 | 5.4 | 7.9 | B | - | asym |
| 56 | uqk00#043 | 7:42:51.0075 65:06:23.044 | 18.58 / 4.84 | 5.8 | 9.7 | B | D | asym |
| 57 | u2gk1#190 | 8:30:48.3166 65:51:12.636 | 18.22 / 4.99 | 6.1 | 4.7 | DB | G | asym, 1bc, merger? |
| 58 | uvm01#194 | 9:39:31.7625 41:33:09.070 | 18.85 / 4.57 | 5.6 | 7.4 | DB | G | asym |
| 59 | u2c47#165 | 9:42:57.2880 46:56:01.780 | 18.86 / 4.68 | 6.6 | 13.1 | D | D | asym, dbl nucl or dust lane |
| 60 | u2c47#085 | 9:43:03.5351 46:55:50.805 | 17.91 / 4.06 | 11.7 | 36.9 | BD | DB | |
| 61 | u2c47#134 | 9:43:08.0085 46:56:21.209 | 18.54 / 4.43 | 8.4 | 21.7 | D | D | asym, mfc |
| 62 | uwp00#051 | 10:02:26.2962 28:50:00.903 | 18.03 / 4.79 | 7.2 | 22.6 | DB | DB | asym, 2fc |
| 63 | uxs10#035 | 10:47:13.2802 13:56:37.675 | 17.90 / 4.46 | 6.9 | 24.8 | DB | B | faint disk, 1fc |
| 64 | uys00 | 11:16:28.0883 18:05:27.717 | 17.87 / 4.15 | 10.2 | 25.4 | B | - | stellar core, AGN? |
| 65 | u3063#511 | 11:40:29.4030 66:07:58.555 | 18.86 / 6.05 | 5.2 | 2.6 | D | D | LSB disk or irr |
| 66 | uzk03#086 | 12:10:31.1231 39:28:46.905 | 18.19 / 4.07 | 8.5 | 17.3 | DB | B | 1fc |
| 67 | u2b15#029 | 13:33:35.2177 16:50:11.271 | 18.33 / 4.07 | 5.4 | 34.5 | BD | D | faint disk, mfc |
| 68 | u2b15#046 | 13:33:37.1951 16:50:00.346 | 18.32 / 4.01 | 6.0 | 17.6 | D | B | asym |
| 69 | u2uj2#164 | 13:59:48.8443 62:31:47.959 | 18.21 / 4.12 | 6.3 | 22.6 | DB | DB | LSB disk |
| 70 | u2uj7#082 | 13:59:54.7421 62:28:35.463 | 18.14 / 4.20 | 6.5 | 9.6 | DB | DB | |
| 71 | u2uj7#171 | 14:00:07.8212 62:28:51.163 | 18.65 / 4.53 | 5.1 | 11.8 | U | B | compact, LSB |
| 72 | ux400 | 15:19:39.4365 23:52:37.885 | 18.60 / 4.11 | 5.1 | 28.1 | DB | -eeThe MDS incorrectly fits these galaxies with multiple components | lg asym disk + 1fc |
| 73 | ux400#055 | 15:19:40.7129 23:52:39.488 | 18.25 / 4.16 | 6.7 | 32.4 | BD | DB | asym disk |
| 74 | u2845#097 | 16:04:15.4230 43:04:15.840 | 18.75 / 4.56 | 5.1 | 20.0 | DB | B | lg asym disk |
| 75 | u2845#077 | 16:04:17.4446 43:03:47.643 | 18.70 / 4.64 | 5.3 | 33.4 | BD | B | 1fc? |
| 76 | u2845#043 | 16:04:17.7243 43:03:24.653 | 18.10 / 4.64 | 6.9 | 33.4 | D | D | lg LSB disk, dust lane |
| 77 | u2845#089 | 16:04:21.3952 43:04:35.810 | 18.32 / 4.57 | 8.1 | 28.1 | DB | B | |
| 78 | u2845#050 | 16:04:25.2398 43:04:12.562 | 17.95 / 4.14 | 6.4 | 53.8 | B | B | 1bc |
| 79 | uuc04#095 | 16:24:12.4485 48:10:14.906 | 17.66 / 4.50 | 12.0 | 23.1 | DB | DB | asym LSB disk, 1bc, merger? |
| 80 | uuc04#044 | 16:24:15.3071 48:09:37.509 | 17.89 / 4.14 | 6.2 | 32.4 | DB | B | mfc, tidal tail? |
| 81 | usa00 | 17:12:20.6910 33:35:28.969 | 17.94 / 4.19 | 8.1 | 38.3 | ID | -eeThe MDS incorrectly fits these galaxies with multiple components | merger (poss barred sp?) |
| 82 | usc12#072 | 17:22:37.0496 50:13:35.231 | 17.94 / 4.13 | 7.9 | 28.1 | B | B | |
| 83 | usc12#045 | 17:22:37.6296 50:13:00.220 | 17.88 / 4.05 | 9.8 | 34.5 | DB | DB | lg late type spiral |
| 84 | usc10#056 | 17:23:00.3707 50:10:54.617 | 18.22 / 4.02 | 5.1 | 24.2 | DB | B | 1fc, arm |
| 85 | uo501#171 | 17:55:22.4072 18:18:47.134 | 18.47 / 4.05 | 5.9 | 23.6 | B | B | |
| 86 | uo501#258 | 17:55:25.4940 18:17:09.218 | 18.46 / 4.17 | 5.3 | 27.3 | DB | DB | asym, 2bc |
| 87 | uo501#207 | 17:55:26.3237 18:17:15.018 | 18.51 / 4.52 | 6.1 | 22.1 | BD | D | 1fc |
| 88 | uo501#123 | 17:55:27.6343 18:18:55.559 | 17.97 / 4.09 | 10.9 | 31.4 | B | B | |
| 89 | uo501 | 17:55:30.3430 18:18:30.982 | 17.81 / 5.62 | 14.8 | 10.3 | B | - | |
| 90 | uqc01#065 | 18:07:04.9266 45:44:13.350 | 18.57 / 4.09 | 8.3 | 20.4 | BD | DB | |
| 91 | uqc01#097 | 18:07:06.4575 45:44:34.643 | 18.43 / 4.23 | 9.5 | 28.1 | BD | B | faint disk, 1bc (lensed?) |
| 92 | uqc00#071 | 18:07:35.4057 46:00:02.849 | 18.03 / 4.38 | 5.4 | 26.0 | ID | D | irr or asym disk + dust |
| 93 | uqc00#111 | 18:07:43.7618 45:59:45.389 | 18.26 / 4.60 | 6.7 | 18.2 | B | B | faint disk? |
| 94 | u2fq1#130 | 21:53:30.6614 17:41:45.643 | 17.91 / 4.05 | 5.1 | 48.9 | D | D | dust lane |
| 95 | u2fq1#389 | 21:53:32.4668 17:41:28.683 | 18.39 / 5.25 | 5.6 | 5.6 | D | D | LSB |
| 96 | u2fq1#166 | 21:53:32.4989 17:42:53.920 | 18.02 / 4.98 | 6.9 | 15.2 | DB | BD | |
| 97 | u2fq1#273 | 21:53:33.0947 17:42:52.077 | 18.15 / 4.43 | 5.9 | 21.7 | ID | D | 1bc, poss merger |
| 98 | u2fq1#158 | 21:53:33.3712 17:42:49.533 | 17.96 / 4.45 | 7.4 | 19.2 | DB | DB | asym disk, 1fc |
| 99 | u2fq1#128 | 21:53:33.8187 17:41:15.458 | 17.37 / 4.10 | 11.7 | 63.4 | B | DB | asym nucl, mbc, merger? |
| 100 | u2fq1#184 | 21:53:33.8420 17:43:01.576 | 18.13 / 4.59 | 7.2 | 22.1 | DB | DB | |
| 101 | u2fq1#095 | 21:53:34.0945 17:42:40.723 | 16.77 / 5.02 | 26.6 | 53.8 | DB | BD | lg disk, 2bc |
| 102 | u2fq1#416 | 21:53:34.5140 17:43:05.921 | 18.53 / 5.01 | 5.0 | 7.7 | U | G | asym, 1fc |
| 103 | u2fq1#107 | 21:53:38.5288 17:42:18.217 | 17.17 / 4.24 | 14.6 | 59.8 | B | B | faint disk? |
| 104 | u2fq1#085 | 21:53:38.6836 17:41:07.398 | 17.04 / 4.29 | 13.2 | 42.9 | BD | BD | bright S0/Sa? |
| 105 | u2fq1#115 | 21:53:38.8887 17:42:25.657 | 17.86 / 4.31 | 11.6 | 30.5 | B | B | |
| 106 | u2fq1#099 | 21:53:39.1231 17:42:25.960 | 17.51 / 4.17 | 16.2 | 59.8 | D | DB | lg disk, asym |
| 107 | u2fq1#224 | 21:53:39.7393 17:41:12.323 | 18.18 / 5.02 | 7.2 | 14.4 | DB | B | |
| 108 | u2v16 | 22:17:35.4817 00:17:34.004 | 18.82 / 4.60 | 5.9 | 10.8 | U | - | nearby comp. |
| 109 | u2h91#034 | 22:17:35.8459 00:13:51.524 | 17.70 / 4.27 | 8.8 | 67.4 | DB | DB | lg disk, poss bar, 2fcffu2h91#034 is SSA22 Hawaii#77 at z=1.02; u2h91#011 is SSA22 Hawaii#64 at z=0.653 |
| 110 | u2h91#011 | 22:17:37.6791 00:15:57.024 | 17.25 / 4.14 | 8.8 | 98.2 | D | DB | lg asym disk; ffu2h91#034 is SSA22 Hawaii#77 at z=1.02; u2h91#011 is SSA22 Hawaii#64 at z=0.653 |
| 111 | u2fq2 | 22:47:09.9607 02:05:57.959 | 17.58 / 4.34 | 10.9 | 38.3 | D | - | lg disk w/knots, ggThis object could drop off the sample as some light from the extended disk is lost in the gap between WFPC2 CCDs. |
| 112 | uec00#057 | 23:04:24.4209 03:04:10.043 | 18.19 / 4.15 | 5.7 | 23.1 | DB | DB | |
| 113 | uec00#053 | 23:04:29.4158 03:03:31.358 | 18.01 / 4.10 | 6.4 | 23.6 | DB | BD | asym disk |
| 114 | uec00#080 | 23:04:30.4987 03:04:43.728 | 18.07 / 4.20 | 6.7 | 14.6 | D | D | LSB disk or irr |
| 115 | uec00#047 | 23:04:31.2224 03:04:35.336 | 17.81 / 4.38 | 7.4 | 16.5 | D | BD | asym, dust |