Black Hole Masses in Three Seyfert Galaxies
Abstract
We analyze published reverberation mapping data for three Seyfert galaxies (NGC 3227, NGC 3516, and NGC 4593) to refine the mass estimate for the supermassive black hole in the center of each object. Treatment of the data in a manner more consistent with other large compilations of such masses allows us to more securely compare our results to wider samples of data, e.g., in the investigation of the Mbh- relationship for active and quiescent galaxies.
1 INTRODUCTION
Reverberation mapping (Blandford & McKee, 1982; Peterson, 1993) is an important technique for probing the supermassive black holes (SMBHs) at the centers of active galactic nuclei (AGNs). Measuring the time lags, , between fluctuations in the highly variable AGN continuum and the variations of emission lines arising from the broad-line region (BLR) provides a responsivity-weighted radius for the BLR gas distribution around the SMBH. When emission-line time lags are combined with calculations of the gas velocity width, , under the assumption of virialized gas motions, it becomes possible to estimate the SMBH mass.
Multiple lines of evidence suggest that to assume a virialized BLR is a reasonable approximation. In AGNs for which several emission lines have been reverberation-mapped (NGC 5548, 3C 390.3, NGC 7469, NGC 3783), an inverse relationship is found between and that is consistent with expectations from virialization (Peterson & Wandel, 1999, 2000; Onken & Peterson, 2002). In addition, the close concordance between AGNs and quiescent galaxies in the - plane under the virial assumption (relating black hole mass to the stellar velocity dispersion of the galactic spheroid; Ferrarese et al., 2001) would seem to imply that any systematic error in reverberation masses is small (a factor of 3 or less). Krolik (2001) estimated a similar level of expected systematic scatter assuming gravitational domination of the BLR.
Most of the statistical studies of reverberation-based black-hole masses use the homogeneous compilations of Wandel, Peterson, & Malkan (1999, hereafter WPM) and Kaspi et al. (2000). Missing from these compilations are AGNs observed by the “Lovers of Active Galaxies (LAG)” collaboration that monitored several AGNs in early 1990 (Robinson, 1994). Three of the LAG sources, NGC 3227 (Salamanca et al., 1994), NGC 3516 (Wanders et al., 1993), and NGC 4593 (Dietrich et al., 1994), have well-determined emission-line lags and certainly meet the quality criteria for inclusion in these studies, and indeed were included in the compilation of Ho (1999; based on H only). These galaxies were omitted from the WPM compilation only because the data had not been analyzed in the same fashion as the other sources; specifically, (a) WPM use the model-independent Monte Carlo method of Peterson et al. (1998) to assess uncertainties in emission-line lags, and (b) WPM use the FWHM of the emission-line in the root-mean-square (rms) spectrum, rather than the mean spectrum, to characterize the BLR line-of-sight velocity width, , that is used to form the virial product (). Because we have converted both our time lags and velocity widths to the AGN rest frame, our results supplement the compilation of Kaspi et al. (2000). (WPM did not correct for the time dilation of their values.)
In this contribution, we reanalyze the LAG data on these three sources in the same fashion as Kaspi et al. (2000), with the intent of enlarging that homogeneous database. The total number of AGNs which have been reverberation-mapped (a few dozen) is small enough that additional objects will assist in on-going statistical investigations of (what are hoped to be) fundamental physical relationships. The main aspect on which we have worked is the careful construction the rms spectra over the spans of the respective observing campaigns. With the rms spectra for these AGNs and updated time lag values and uncertainties, we are able to derive masses for the SMBHs in these three galaxies.
In § 2, we briefly describe the original observing campaigns and our data reduction. We explain the details of our time series and velocity width analyses in § 3. Our estimates of the SMBH mass in each galaxy are presented in § 4. In § 5, we address the Mbh- relationship, and we then summarize our conclusions (§ 6).
2 OBSERVATIONS AND DATA REDUCTION
The LAG consortium examined the H and H wavelength regimes with long slit spectroscopy of moderate resolution and with the temporal sampling rates listed in Table 1. The line marked “cont.” in Table 1 for NGC 3516 indicates the sampling statistics derived for the combination of imaging and spectroscopic measurements of the 4000-5000Å continuum. The continuum statistics for NGC 3227 and NGC 4593 are identical to the H and H entries, respectively. indicates the “excess variance,” the mean fractional variation of each dataset (see Rodríguez-Pascual et al., 1997). The ratio of the maximum to minimum flux value is given in Table 1 as .
In general, no alterations were applied to the published light curve data. However, in order to investigate the velocity width characteristics of the broad emission lines, we used the wavelength region around the narrow lines ([O III] and [S II], which should only vary on timescales much longer than the campaigns) to scale the spectra (van Groningen & Wanders, 1992). The absolute scaling was done so as to yield mean narrow-line fluxes equal to the values derived in the original papers. The slit width selected was an attempt to balance spectral resolution and total detected flux. However, the small slit width introduced a non-trivial degree of difficulty in the removal of seeing effects, as noted below.
2.1 NGC 3227
The LAG campaign on NGC 3227 was described by Salamanca et al. (1994). The analysis was complicated by the fact that the two methods they employed for removing the contribution of the stellar host gave significantly different answers: they derived a 24% contribution to the continuum by examining the magnesium triplet of a template galaxy of the same Hubble type, and a 40% continuum contribution from comparisons with the magnesium triplet absorption of the bulge of NGC 3227. We analyzed the data with each of the potential stellar levels removed and found the differences to be insignificant.
A detailed investigation of various origins of uncertainty in their flux calibration was conducted by a portion of the LAG group (Baribaud et al., 1994). In addition to the effects of slit miscentering and seeing, they estimate the uncertainties incurred by their scaling of the spectra by the narrow lines, and conclude an overall flux error of 5–8%. We have assumed the more conservative 8% errors for all of the flux data. Our analysis made use of the full LAG dataset, consisting of 23 H observations and 14 H observations. The light curve cross-correlations were made with respect to the continuum at 5020Å.
The systemic redshift of NGC 3227 was taken to be = 0.00380 0.00002 (Keel, 1996).
2.2 NGC 3516
Spectra of NGC 3516 were taken at 22 separate epochs for H and 21 epochs for H. The continuum light curve for this object was constructed from a combination of B-band imaging and spectral fits to the power-law continuum at 4905Å. The results of the LAG study have been published by Wanders et al. (1993) and Wanders & Horne (1994). The spectra we obtained for this object had already been corrected for seeing, the stellar flux from the host galaxy, and contributions from narrow lines (see Wanders et al., 1992). In addition, the [S II] and [O III] narrow lines had been subtracted from the H and H spectra, respectively, preventing any rescaling of the flux levels. Several observations were removed from the calculation of the rms spectrum for a variety of reasons (extremely poor seeing, object miscentering, and other anomalies). Among the H dataset, we have excised observations from the following dates: 31 January, 16 February, 15 April, and 13 May. From the H analysis we have removed 24 March, 15 April, and 13 May.
Conversion of time lags and line-of-sight velocity widths to the rest frame was made with = 0.00884 0.00002 (Keel, 1996).
2.3 NGC 4593
Spectra of NGC 4593 were obtained at 22 epochs around H and at 11 epochs around H, and the continuum used was at 6310Å. The H line was contaminated by strong [N II] 6548, 6584 emission, as well as a narrow H contribution. Using the shape of the narrow [O III]5007 line as a template for all of the narrow lines, and the flux ratios between the [N II] lines and narrow H that Dietrich et al. (1994) calculated, we have bracketed the amount of narrow line removal by limiting cases in which too much or too little narrow line flux was subtracted. Conducting this for each H spectrum, we then separately analyzed our oversubtracted and undersubtracted datasets. The difference between the oversubtraction and undersubtraction was on the order of 1%, much smaller than the uncertainties as well as the range of values derived by doing no rescaling of the spectra or no removal of the narrow-line contribution.
We converted our results to the galaxy’s rest frame using = 0.00900 0.00013 (Strauss et al., 1992).
3 DATA ANALYSIS
Using the published light curves, we generated the cross-correlation functions (CCFs) between the continua and the emission lines with the interpolated CCF technique as implemented by White & Peterson (1994). We calculated both the peak of each CCF () and its centroid (; above a threshold of 80% of the peak value correlation coefficient) with an interpolation unit of 0.1 days.
Uncertainties in the time lag values were estimated with the method described by Peterson et al. (1998). This model-independent technique addresses two major sources of uncertainty in the CCFs. First, the issue of flux errors is handled by adding to each flux value a randomly generated deviation. This deviation is computed such that a large number of realizations will produce a Gaussian scatter with a standard deviation equal to the quoted uncertainty (this procedure is dubbed “flux randomization (FR)”). Second, the potential errors arising from the limited temporal sampling of the observational campaign are accounted for by “random subset selection (RSS).” The RSS method consists of randomly selecting data points from a sample of size , where each selection draws from the entire sample and repeated selections are ignored. This allows us to “bootstrap” our way to reasonable error estimates, while preserving the underlying form of the time series. The FR/RSS method was implemented 1000 times for each continuum-line combination to build up a distribution of the peak and centroid time lags, denoted generally as a cross-correlation peak distribution (CCPD; Maoz & Netzer, 1989). We use the CCPD to define the time lag values within which 68% of the Monte Carlo results lie, and these values set our time lag uncertainties. Table 2 and Figure 3 show our cross-correlation results.
The procedure we applied to the mean and rms spectra of each AGN was to make two estimates of the continuum, at the extrema of where the level could potentially be set. The two resulting measurements of the velocity full-width at half-maximum, , were then averaged and the difference taken to be twice the one-sigma errors. We give the results of our measurements from both the mean and rms spectra in Table 3.
4 MASS DERIVATIONS
For consistency with previously published compilations, we calculate the reverberation mass as
| (1) |
where is taken from the rms spectrum, is the speed of light, and is the gravitational constant. The asymmetric errors in the time lags are propagated through to the masses derived from the individual lines. Then, the masses for each line are combined in a weighted average. We have measured the reverberation masses for our three targets and present the results in Table 4. Object-specific comments and comparisons with previous results follow.
4.1 NGC 3227
The original LAG estimate of the SMBH mass in NGC 3227 was 2108M⊙ (Salamanca et al., 1994). Our value of (3.61.4)107M⊙ is consistent with the mass of 4.9107M⊙ tabulated by WPM, which was based on an independent monitoring campaign (Winge et al., 1995). The value derived by Ho (1999) from H was 3.8107M⊙, also consistent with our new SMBH mass in this galaxy. Schinnerer, Eckart, & Tacconi (2000) used CO gas kinematics to calculate a lower mass limit of 1.5107M⊙ enclosed within the central 25 pc. Again, this value is fully consistent with our results.
4.2 NGC 3516
Kazanas & Nayakshin (2001) have noted the difficulty in reconciling the SMBH mass estimates for NGC 3516 arising from a variety of optical, UV, and X-ray constraints within certain models of AGN structure. Although our final estimate of = (1.680.33)107M⊙ lies slightly above a recent mass upper limit of (1.120.05)107M⊙ derived from models of the X-ray warm absorber in this galaxy (Morales & Fabian, 2002), other models of X-ray properties point towards a mass closer to 108M⊙ (Kazanas & Nayakshin, 2001). Our results for this AGN are consistent with the value of 2107M⊙ from the earlier analysis of the LAG data by Wanders & Horne (1994), and also matches well the mass of 2.3107M⊙ Ho (1999) calculated using H alone. Recent attempts at accretion disk modeling from X-ray data have given values of 3.1107M⊙ (Czerny et al., 2001) and 2107M⊙ (Chiang, 2002), both in rough agreement with the present work.
4.3 NGC 4593
For NGC 4593, we calculate that Mrev = (6.65.2)106M⊙. An earlier reverberation mapping campaign derived a mass of 2.2106M⊙ from Lyman (Santos-Lleó et al., 1995), and Kollatschny & Dietrich (1997) calculated Mrev = 7106M⊙ from the LAG H data (when corrected for our conversion between and the velocity dispersion). Ho (1999) estimated a slightly larger H time delay and found a SMBH mass of 8.1106M⊙. With such large uncertainties, these differences cannot be considered statistically significant.
5 THE Mbh- RELATIONSHIP
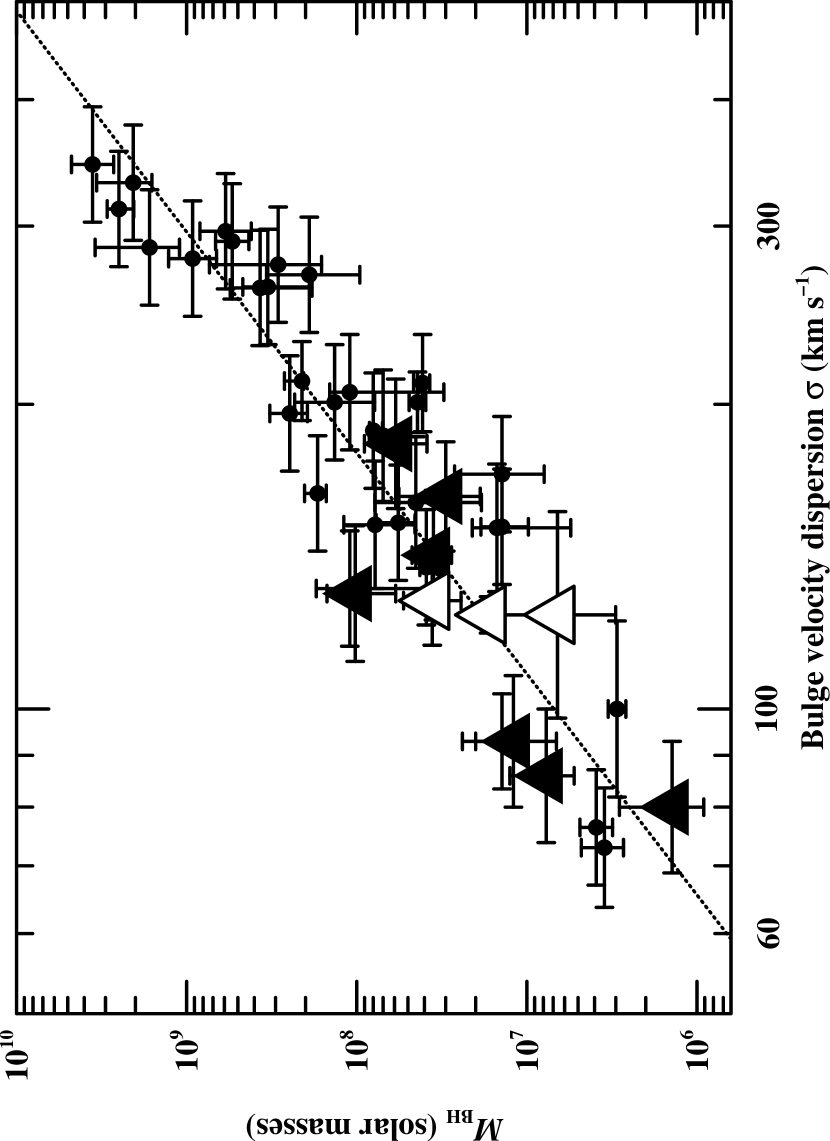
Since the discovery of the exceptionally tight correlation between a galaxy’s SMBH mass and the central value of the velocity dispersion of the galaxy’s spheroid (i.e. Mbh-; Ferrarese & Merritt, 2000; Gebhardt et al., 2000a), a number of attempts have been made to reconcile differences in the derived slope of this relationship (e.g., Tremaine et al., 2002) as well as to develop a physical framework that will naturally produce such a correlation. In addition, Gebhardt et al. (2000b) and Ferrarese et al. (2001) have examined whether SMBH masses derived by reverberation mapping are consistent with the Mbh- relationship. Because bulge velocity dispersion measurements exist for all three of our targets, we are able to enlarge the AGN sample used to investigate Mbh-.
Nelson & Whittle (1995) measured bulge velocity dispersions for 85 galaxies, including two of our targets. NGC 3227 was found to have = 12813 km s-1, and NGC 4593 has = 12429 km s-1. Di Nella et al. (1995) published a value of = 1245 km s-1 for NGC 3516. These values for , in conjunction with our derived Mrev data, are consistent with the current fits to Mbh- (Figure 4). This excellent agreement between the AGN and quiescent galaxy Mbh- relationships is additional evidence that reverberation masses are not subject to large systematic errors.
In addition, we note the relative concentrations of the AGN and quiescent galaxy data in Figure 4 toward the two ends of the relationship. This is a reflection of two facts: (1) in order to measure in AGNs, the continuum emission must be weak enough so as not to wash out the stellar absorption lines, implying the accessibility of only the dimmer AGNs, and therefore only the smaller SMBH masses; (2) the quiescent galaxies need a relatively large SMBH mass to allow the probing of the gravitational sphere of influence, whether by stellar dynamics or gas kinematics. The combination of these requirements gives rise to the observed distribution, in spite of the probable span of both galaxy types over the entire range of SMBH masses.
6 SUMMARY
As many of the forefront studies of AGNs are examining correlations between SMBH masses and properties of the AGN host galaxies, a uniform analysis methodology is important for minimizing systematic offsets between datasets. Time lags, calculated from the published light curves, were used in conjunction with rms velocity widths for optical hydrogen emission lines to estimate the reverberation masses for NGC 3227, NGC 3516, and NGC 4593. These masses, listed in Table 4, can now be added to the compilation of Kaspi et al. (2000), as they were calculated in the same manner. In addition, these masses, when combined with published data on the host galaxy spheroid velocity dispersions, strengthen the claim that reverberation masses are accurate measures of the true SMBH mass.
References
- Baribaud et al. (1994) Baribaud, T., Salamanca, I., Alloin, D., & Wagner, S. 1994, A&AS, 103, 121
- Blandford & McKee (1982) Blandford, R. D., & McKee, C. F. 1982, ApJ, 255, 419
- Chiang (2002) Chiang, J. 2002, ApJ, 572, 79
- Czerny et al. (2001) Czerny, B., Nikołajuk, M., Piasecki, M., & Kuraszkiewicz, J. 2001, MNRAS, 325, 865
- Di Nella et al. (1995) Di Nella, H., Garcia, A. M., Garnier, R., & Paturel, G. 1995, A&AS, 113, 151
- Dietrich et al. (1994) Dietrich, M., et al. 1994, A&A, 284, 33
- Ferrarese (2002) Ferrarese, L. 2002, in Current High-Energy Emission around Black Holes, ed. C.-H. Lee (Singapore: World Scientific), in press (astro-ph/0203047)
- Ferrarese & Merritt (2000) Ferrarese, L., & Merritt, D. 2000, ApJ, 539, L9
- Ferrarese et al. (2001) Ferrarese, L., Pogge, R. W., Peterson, B. M., Merritt, D., Wandel, A., & Joseph, C. L. 2001, ApJ, 555, L79
- Gebhardt et al. (2000a) Gebhardt, K., et al. 2000a, ApJ, 539, L13
- Gebhardt et al. (2000b) Gebhardt, K., et al. 2000b, ApJ, 543, L5
- Ho (1999) Ho, L. C. 1999, in Observational Evidence for Black Holes in the Universe, ed. S. K. Chakrabarti (Dordrecht: Kluwer), 157
- Kaspi et al. (2000) Kaspi, S., Smith, P. S., Netzer, H., Maoz, D., Jannuzi, B. T., & Giveon, U. 2000, ApJ, 533, 631
- Kazanas & Nayakshin (2001) Kazanas, D., & Nayakshin, S. 2001, ApJ, 550, 655
- Keel (1996) Keel, W. C. 1996, AJ, 111, 696
- Kollatschny & Dietrich (1997) Kollatschny, W., & Dietrich, M. 1997, A&A, 323, 5
- Krolik (2001) Krolik, J. H. 2001, ApJ, 551, 72
- Maoz & Netzer (1989) Maoz, D., & Netzer, H. 1989, MNRAS, 236, 21
- Morales & Fabian (2002) Morales, R., & Fabian, A. C. 2002, MNRAS, 329, 209
- Nelson & Whittle (1995) Nelson, C. H., & Whittle, M. 1995, ApJS, 99, 67
- Onken & Peterson (2002) Onken, C. A., & Peterson, B. M. 2002, ApJ, 572, 746
- Peterson (1993) Peterson, B. M. 1993, PASP, 105, 247
- Peterson & Wandel (1999) Peterson, B. M., & Wandel, A. 1999, ApJ, 521, L95
- Peterson & Wandel (2000) Peterson, B. M., & Wandel, A. 2000, ApJ, 540, L13
- Peterson et al. (1998) Peterson, B. M., Wanders, I., Horne, K., Collier, S., Alexander, T., Kaspi, S., & Maoz, D. 1998, PASP, 110, 660
- Robinson (1994) Robinson, A. 1994, in ASP Conf. Ser. 69, Reverberation Mapping of the Broad-Line Region in Active Galactic Nuclei, ed. P. M. Gondhalekar, K. Horne, & B. M. Peterson (San Francisco: ASP), 147
- Rodríguez-Pascual et al. (1997) Rodríguez-Pascual, P. M., et al. 1997, ApJS, 110, 9
- Salamanca et al. (1994) Salamanca, I., et al. 1994, A&A, 282, 742
- Santos-Lleó et al. (1995) Santos-Lleó, M., Clavel, J., Barr, P., Glass, I. S., Pelat, D., Peterson, B. M., & Reichert, G. 1995, MNRAS, 274, 1
- Schinnerer, Eckart, & Tacconi (2000) Schinnerer, E., Eckart, A., & Tacconi, L. J. 2000, ApJ, 533, 826
- Strauss et al. (1992) Strauss, M. A., Huchra, J. P., Davis, M., Yahil, A., Fisher, K. B., & Tonry, J. 1992, ApJS, 83, 29
- Tremaine et al. (2002) Tremaine, S., et al. 2002, ApJ, 574, 740
- van Groningen & Wanders (1992) van Groningen, E., & Wanders, I. 1992, PASP, 104, 700
- WPM (1999) Wandel, A., Peterson, B. M., & Malkan, M. A. 1999, ApJ, 526, 579 (WPM)
- Wanders & Horne (1994) Wanders, I., & Horne, K. 1994, A&A, 289, 76
- Wanders et al. (1992) Wanders, I., Peterson, B. M., Pogge, R. W., DeRobertis, M. M., & van Groningen, E. 1992, A&A, 266, 72
- Wanders et al. (1993) Wanders, I., et al. 1993, A&A, 269, 39
- White & Peterson (1994) White, R. J., & Peterson, B. M. 1994, PASP, 106, 879
- Winge et al. (1995) Winge, C., Peterson, B. M., Horne, K., Pogge, R. W., Pastoriza, M. G., & Storchi-Bergmann, T. 1995, ApJ, 445, 680


| Sampling Interval (days) | |||||||
|---|---|---|---|---|---|---|---|
| Galaxy | Dataset | Number | Average | Median | Fvar | Rmax | |
| NGC 3227 | H | 23 | 6.9 | 5.1 | 0.017 | 1.3670.155 | |
| H | 14 | 10.6 | 10.9 | 0.133 | 1.5970.181 | ||
| NGC 3516 | H | 18 | 8.9 | 8.8 | 0.129 | 1.5410.065 | |
| H | 18 | 9.0 | 8.0 | 0.112 | 1.4740.063 | ||
| cont. | 35 | 4.5 | 3.0 | 0.280 | 4.0270.364 | ||
| NGC 4593 | H | 22 | 7.4 | 5.0 | 0.136 | 1.6530.069 | |
| H | 11 | 15.8 | 11.7 | 0.185 | 1.9960.102 | ||
| Galaxy | Emission Line | Continuum | ||||
|---|---|---|---|---|---|---|
| (Å) | (days) | (days) | (days) | (days) | ||
| NGC 3227 | H (24% stellar) | 5020 | 25.9 | 25.8 | 25.0 | 24.9 |
| H (24% stellar) | 12.0 | 12.0 | 13.0 | 13.0 | ||
| NGC 3516 | H | composite | 13.2 | 13.1 | 13.8 | 13.7 |
| H | 7.4 | 7.3 | 10.2 | 10.1 | ||
| NGC 4593 | H | 6310 | 4.6 | 4.6 | 1.7 | 1.7 |
| H | 3.1 | 3.1 | 9.6 | 9.5 |
| H | H | |||||
|---|---|---|---|---|---|---|
| Galaxy | Dataset | |||||
| (103 km s-1) | (103 km s-1) | (103 km s-1) | (103 km s-1) | |||
| NGC 3227 | rms | 3.100.15 | 3.090.15 | 4.361.32 | 4.341.31 | |
| NGC 3516 | 3.110.04 | 3.080.04 | 3.140.15 | 3.110.15 | ||
| NGC 4593 | 3.101.09 | 3.071.08 | 4.420.95 | 4.380.94 | ||
| NGC 3227 | mean | 2.620.22 | 2.610.22 | 1.900.57 | 1.890.57 | |
| NGC 3516 | 3.510.10 | 3.480.10 | 4.090.77 | 4.050.76 | ||
| NGC 4593 | 3.270.66 | 3.240.65 | 3.310.93 | 3.280.92 | ||
| Galaxy | H-based | H-based | Combined |
|---|---|---|---|
| (106M⊙) | (106M⊙) | (106M⊙) | |
| NGC 3227 | 36.1 | 33.1 | 3614 |
| NGC 3516 | 18.2 | 10.3 | 16.83.3 |
| NGC 4593 | 6.3 | 8.7 | 6.65.2 |