The overdensities of galaxy environments as a function of luminosity and color
Abstract
We study the mean environments of galaxies in the Sloan Digital Sky Survey as a function of rest-frame luminosity and color. Overdensities in galaxy number are estimated in and spheres centered on galaxies taken from the SDSS spectroscopic sample. We find that, at constant color, overdensity is independent of luminosity for galaxies with the blue colors of spirals. This suggests that, at fixed star-formation history, spiral-galaxy mass is a very weak function of environment. Overdensity does depend on luminosity for galaxies with the red colors of early types; both low-luminosity and high-luminosity red galaxies are found to be in highly overdense regions.
1 Introduction
Elliptical and lenticular galaxies are over-represented in massive nearby galaxy clusters relative to the field (Dressler, 1980; Postman & Geller, 1984). Elliptical galaxies also tend to be redder, more luminous, more metal-rich, more gas-poor, and older in stellar population than spirals and irregulars (e.g., Tammann et al., 1979; Kormendy & Djorgovski, 1989; Roberts & Haynes, 1994). Indeed, it has also been found that color, luminosity, surface-brightness, gas content, stellar population age, and star-formation rate are all correlated with the overdensity of the galaxy environment (e.g., Kennicutt, 1983; Balogh et al., 2001; Martínez et al., 2002; Lewis et al., 2002; Blanton et al., 2002c; Gomez et al., 2002). Along the same lines, studies of the clustering of galaxies have found different clustering amplitudes for galaxies of different types, colors, and luminosities (e.g., Davis & Geller, 1976; Mo et al., 1994; Park et al., 1994; Norberg et al., 2002; Zehavi et al., 2002). What is not understood is which of the relationships with environment are causal and which are just a by-product of other, more fundamental correlations.
Conventional cosmological theories posit that galaxies reside inside dark matter concentrations or “halos” that grow from small random fluctuations at early times. The most overdense fluctuations will collapse first; in a gaussian random field, these preferentially reside within overdensities on larger scales, implying a correlation of halo mass with environment is expected (e.g., Mo & White, 1996; Lemson & Kauffmann, 1999). The relationships between the properties of a halo and the properties of the galaxy or galaxies it contains are not fully understood, so the conventional theories do not currently make strong predictions for the dependence of galaxy number overdensity on observable galaxy properties, although most studies suggest that luminosity and color will be related to overdensity (eg, Kauffmann et al., 1997, 1999; Benson et al., 2000). Whether or not this dark-matter halo picture ends up being useful or correct, and whatever turn out to be the important physical processes for making galaxies, the investigations started in this Letter will place important constraints on galaxy formation and evolution.
The Sloan Digital Sky Survey (SDSS) is the best available data set for investigation of these relationships because of its sample size, high signal-to-noise imaging, sky coverage, and complete spectroscopy (e.g., York et al., 2000). Indeed, the SDSS has already made some relevant measurements, including the dependence of clustering on luminosity and color (Zehavi et al., 2002), the star-formation as a function of environment (Gomez et al., 2002), and the mean red-galaxy spectrum as a function of environment (Eisenstein et al., 2002). In this Letter, we investigate the mean galaxy number overdensities around galaxies of different colors and luminosities.
In what follows, a cosmological world model with is adopted, and the Hubble constant is parameterized , for the purposes of calculating distances and volumes (e.g., Hogg, 1999).
2 Data sample
The SDSS is taking CCD imaging of of the Northern Galactic sky, and, from that imaging, selecting targets for spectroscopy, most of them galaxies with (e.g., Gunn et al., 1998; York et al., 2000; Stoughton et al., 2002).
All the data processing: astrometry (Pier et al., 2002); source identification, deblending and photometry (Lupton et al., 2001); calibration (Fukugita et al., 1996; Smith et al., 2002); spectroscopic target selection (Eisenstein et al., 2001; Strauss et al., 2002; Richards et al., 2002); spectroscopic fiber placement (Blanton et al., 2002b); and spectroscopic data reduction are performed with automated SDSS software.
Redshifts are measured on the reduced spectra by an automated system, which models each galaxy spectrum as a linear combination of stellar populations (Schlegel, in preparation).
The sample is statistically complete, with small incompletenesses coming primarily from (1) galaxies missed because of mechanical spectrograph constraints (6 percent; Blanton et al., 2002b), which does lead to a slight under-representation of high-density regions, and (2) spectra in which the redshift is either incorrect or impossible to determine ( percent). In addition, there are some galaxies ( percent) blotted out by bright Galactic stars, but this incompleteness should be uncorrelated with galaxy properties.
For the purposes of computing large-scale structure statistics, we have assembled a subsample of SDSS galaxies known as the NYU LSS sample10. This subsample includes not only properties of the galaxies but also of survey selection function variations and angular coverage. For each galaxy in sample10, the sample includes a computed volume representing the total volume of the Universe (in ) in which the galaxy could have resided and still made it into the sample. The calculation of these volumes is described elsewhere (Blanton et al., 2002c).
Galaxy luminosities and colors (measured by the standard SDSS petrosian technique; Petrosian, 1976) are computed in fixed bandpasses, using Galactic extinction corrections (Schlegel et al., 1998) and corrections (computed with kcorrect v1_11; Blanton et al., 2002a). They are corrected not to the redshift observed bandpasses but to bluer bandpasses , and “made” by shifting the SDSS , , and bandpasses to shorter wavelengths by a factor of 1.1 (c.f., Blanton et al., 2002a, c). This means that galaxies at redshift (typical of the SDSS sample used here) have trivial corrections.
The sample of galaxies used here was selected to have apparent magnitude in the range , redshift in the range , and fixed-frame absolute magnitude in the range . These cuts left 124884 galaxies.
Overdensity estimators on two different length scales are used. On the scale, the estimate of environment overdensity is based on the SDSS spectroscopic sample. It is a measure of the three-dimensional redshift-angle space number density excess around each galaxy. The comoving transverse distances and comoving line-of-sight distances (e.g., Hogg, 1999) are computed between each spectroscopic galaxy and its neighboring spectroscopic galaxies (not attempting to correct for peculiar velocities). Neighbors within an comoving sphere in this space are counted; the result is divided by the prediction made from the galaxy luminosity function (Blanton et al., 2002d), and unity is subtracted to produce the overdensity estimate . A galaxy in an environment with the cosmic mean density has . Although the sample used to infer is flux-limited and not volume-limited, the resulting overdensity estimates have been shown to be redshift-independent in the median (Blanton et al., 2002c). If the spatial correlation function has the form , then the mean overdensity around galaxies will be . Direct comparison of the and requires a correction for the presence of redshift distortions due to infall and “fingers of God”.
On the scale, the estimate of environment overdensity is a deprojected angular correlation function. Around each spectroscopic target galaxy, galaxies are counted in the SDSS imaging in the magnitude range corresponding to (passively-evolved and -corrected as for an early-type galaxy) and within (transverse, proper; e.g., Hogg, 1999) at the spectroscopic galaxy redshift. The count is weighted so as to recover the estimated overdensity averaged over a spherical three-dimensional Gaussian window with a radius of (proper). Details of the weighting and the method for correcting for the survey mask are given elsewhere (Eisenstein, 2002). The results do not depend on an assumed model of the correlation function but do depend inversely on the normalization of the luminosity function at the redshift in question. One advantage of this method is that the density can be estimated with a volume-limited and yet reasonably dense set of galaxies, even at the furthest reaches of the spectroscopic catalog. Another advantage is that the estimator is not affected by redshift distortions. If the spatial correlation function has the form , then the mean overdensity around galaxies is .
The two overdensity estimators and are very different; the deprojection technique is not possible on the large scale because of survey geometry constraints, and the redshift-angle sphere technique is not possible on the small scale because of peculiar velocities. Of course, that different estimators with different systematics are used on the two different scales makes their inter-comparison informative.
3 Results
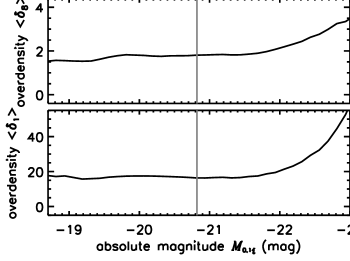
Fig 1 shows the mean dependencies of overdensity on luminosity and color separately. Both show monotonic trends, with redder and more luminous galaxies, on average, in higher density regions. In each panel the mean is weighted by the inverse selection volumes .
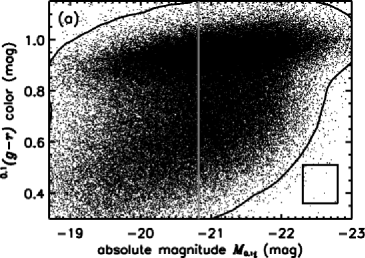
Panel (a) of Fig 2 shows the distribution of galaxies in the sample in the luminosity-color plane. The “red sequence” of old stellar populations, i.e., early-type galaxies, is visible. We will refer to galaxies on this sequence as “red” and those bluer as “blue.” The mode of the luminosity distribution is more luminous than . This is due to the classical Malmquist bias: more luminous galaxies are visible over a much larger volume and are therefore over-represented in the sample. Taking means weighted by compensates for this bias.
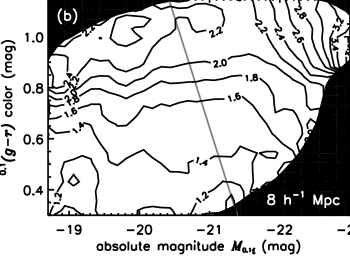
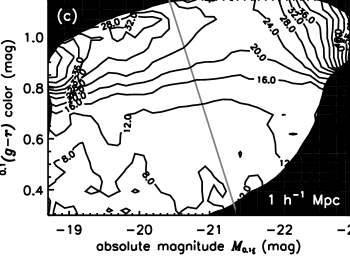
Panels (b) and (c) of Fig 2 show the weighted mean environment overdensities and computed in a sliding box of luminosity width and color width , at all colors and magnitudes at which the sliding box contains at least 200 galaxies. The trends of the two different density estimators are remarkably similar:
(1) Galaxies of every color and luminosity are, on average, in overdense regions (). There are no unclustered or void populations that can be isolated by color and luminosity, in the color and luminosity ranges considered here.
(2) Very luminous () red galaxies are, on average, in more overdense regions than the average galaxy. This is not surprising, given that many clusters contain extremely luminous galaxies (e.g., Beers & Geller, 1983).
(3) Faint () red galaxies are also, on average, in more overdense regions than the average galaxy. This may be related to the observation that the luminosity function appears more dwarf-rich in clusters than in the field (e.g., Driver et al., 1994; Bernstein et al., 1995; de Propris et al., 1995; Trentham & Hodgkin, 2002).
4 Discussion
We have shown that blue galaxies, i.e., galaxies bluer than the red sequence of old stellar populations, exhibit no correlation between their luminosities and the overdensity of their environments, at fixed color. The class of blue galaxies includes most spirals and irregulars.
On Fig 2 a line of (roughly) constant stellar mass is shown, derived by converting relations derived in the and bands (Bell & de Jong, 2001); the conversion is straightforward because and are very similar to and . The line of constant mass is close to a line of constant luminosity. Similarly, a line of constant star-formation history is close to a line of constant color, with a small slope arising from the luminosity–metallicity relation (e.g., Vila-Costas & Edmunds, 1992; Zaritsky et al., 1994; Ryder, 1995). Fig 2 shows that, for spiral galaxies, mean overdensity is monotonically related to star-formation history. That there is a strong relationship between star-formation history and environment has been suggested before, both theoretically (eg, Kauffmann et al., 1999; Benson et al., 2000) and observationally (Balogh et al., 2001; Gomez et al., 2002). What is more remarkable is that, for galaxies with the colors of spirals, at fixed star-formation history, overdensity does not appear to depend on stellar mass at all.
The reddest galaxies show strong trends in overdensity at both the luminous and faint extremes. The former trend indicates that the very most luminous galaxies lie in the very largest overdensities; probably this is related to the fact that giant galaxies lie near the centers of clusters. The latter trend suggests that though high-density regions are expected to be rich in dwarf galaxies, those dwarfs will, by and large, be much redder than typical galaxies of their luminosity (Norberg et al. 2002; Zehavi et al, in preparation). That red galaxies have a minimum in their mean overdensity at luminosities near could be partly due to the specific mixture of galaxy types at those luminosities; there is a large overlap with the distribution of spirals, and the red population contains a large number of Sa galaxies at those luminosities (e.g., Strateva et al., 2001).
At one point it was thought that dwarf galaxies might “fill the voids,” making them an underdense population in the mean. Our results rule this out, at least for dwarf galaxies selected by color and luminosity in the ranges considered here.
References
- Balogh et al. (2001) Balogh, M. L., Christlein, D., Zabludoff, A. I., & Zaritsky, D. 2001, ApJ, 557, 117
- Beers & Geller (1983) Beers, T. C. & Geller, M. J. 1983, ApJ, 274, 491
- Bell & de Jong (2001) Bell, E. F. & de Jong, R. S. 2001, ApJ, 550, 212
- Benson et al. (2000) Benson, A. J., Baugh, C. M., Cole, S., Frenk, C. S., & Lacey, C. G. 2000, MNRAS, 316, 107
- Bernstein et al. (1995) Bernstein, G. M., Nichol, R. C., Tyson, J. A., Ulmer, M. P., & Wittman, D. 1995, AJ, 110, 1507
- Blanton et al. (2002a) Blanton, M. R., Brinkmann, J., Csabai, I., Doi, M., Eisenstein, D. J., Fukugita, M., Gunn, J. E., Hogg, D. W., & Schlegel, D. J. 2002a, AJ, in press (astro-ph/0205243)
- Blanton et al. (2002b) Blanton, M. R., Lin, H., Lupton, R. H., Maley, F. M., Young, N., Zehavi, I., & J., L. 2002b, AJ, in press (astro-ph/0105535)
- Blanton et al. (2002c) Blanton, M. R. et al. 2002c, ApJ, submitted (astro-ph/0209479)
- Blanton et al. (2002d) Blanton, M. R. et al. 2002d, ApJ, submitted (astro-ph/0210215)
- Davis & Geller (1976) Davis, M. & Geller, M. J. 1976, ApJ, 208, 13
- de Propris et al. (1995) de Propris, R., Pritchet, C. J., Harris, W. E., & McClure, R. D. 1995, ApJ, 450, 534
- Dressler (1980) Dressler, A. 1980, ApJ, 236, 351
- Driver et al. (1994) Driver, S. P., Phillipps, S., Davies, J. I., Morgan, I., & Disney, M. J. 1994, MNRAS, 268, 393
- Eisenstein (2002) Eisenstein, D. J. 2002, ApJ, submitted (astro-ph/0212084)
- Eisenstein et al. (2001) Eisenstein, D. J. et al. 2001, AJ, 122, 2267
- Eisenstein et al. (2002) Eisenstein, D. J. et al. 2002, AJ, submitted (astro-ph/0212087)
- Fukugita et al. (1996) Fukugita, M., Ichikawa, T., Gunn, J. E., Doi, M., Shimasaku, K., & Schneider, D. P. 1996, AJ, 111, 1748
- Gomez et al. (2002) Gomez, P. et al. 2002, ApJ, in press (astro-ph/0210193)
- Gunn et al. (1998) Gunn, J. E., Carr, M. A., Rockosi, C. M., Sekiguchi, M., et al. 1998, AJ, 116, 3040
- Hogg (1999) Hogg, D. W. 1999, astro-ph/9905116
- Kauffmann et al. (1999) Kauffmann, G., Colberg, J. M., Diaferio, A., & M., W. S. D. 1999, MNRAS, 303, 188
- Kauffmann et al. (1997) Kauffmann, G., Nusser, A., & Steinmetz, M. 1997, MNRAS, 286, 795
- Kennicutt (1983) Kennicutt, R. C. 1983, AJ, 88, 483
- Kormendy & Djorgovski (1989) Kormendy, J. & Djorgovski, S. 1989, ARA&A, 27, 235
- Lemson & Kauffmann (1999) Lemson, G. & Kauffmann, G. 1999, MNRAS, 302, 111
- Lewis et al. (2002) Lewis, I. et al. 2002, MNRAS, 334, 673
- Lupton et al. (2001) Lupton, R. H., Gunn, J. E., Ivezić, Z., Knapp, G. R., Kent, S., & Yasuda, N. 2001, in ASP Conf. Ser. 238: Astronomical Data Analysis Software and Systems X, Vol. 10, 269–??
- Martínez et al. (2002) Martínez, H. J., Zandivarez, A., Domínguez, M., Merchán, M. E., & Lambas, D. G. 2002, MNRAS, 333, L31
- Mo et al. (1994) Mo, H. J., McGaugh, S. S., & Bothun, G. D. 1994, MNRAS, 267, 129
- Mo & White (1996) Mo, H. J. & White, S. D. M. 1996, MNRAS, 282, 347
- Norberg et al. (2002) Norberg, P. et al. 2002, MNRAS, 332, 827
- Park et al. (1994) Park, C., Vogeley, M. S., Geller, M. J., & Huchra, J. P. 1994, ApJ, 431, 569
- Petrosian (1976) Petrosian, V. 1976, ApJ, 209, L1
- Pier et al. (2002) Pier, J. R., A., M. J., Hindsley, R. B., Hennessy, G. S., Kent, S. M., Lupton, R. H., & Ivezić, Z. 2002, AJ, submitted
- Postman & Geller (1984) Postman, M. & Geller, M. 1984, ApJ, 281, 95
- Richards et al. (2002) Richards, G. et al. 2002, AJ, 123, 2945
- Roberts & Haynes (1994) Roberts, M. S. & Haynes, M. P. 1994, ARA&A, 32, 115
- Ryder (1995) Ryder, S. D. 1995, ApJ, 444, 610
- Schlegel et al. (1998) Schlegel, D. J., Finkbeiner, D. P., & Davis, M. 1998, ApJ, 500, 525
- Smith et al. (2002) Smith, J. A., Tucker, D. L., et al. 2002, AJ, 123, 2121
- Stoughton et al. (2002) Stoughton, C. et al. 2002, AJ, 123, 485
- Strateva et al. (2001) Strateva, I. et al. 2001, AJ, 122, 1861
- Strauss et al. (2002) Strauss, M. A. et al. 2002, AJ, 124, 1810
- Tammann et al. (1979) Tammann, G. A., Yahil, A., & Sandage, A. 1979, ApJ, 234, 775
- Trentham & Hodgkin (2002) Trentham, N. & Hodgkin, S. 2002, MNRAS, 333, 423
- Vila-Costas & Edmunds (1992) Vila-Costas, M. B. & Edmunds, M. G. 1992, MNRAS, 259, 121
- York et al. (2000) York, D. et al. 2000, AJ, 120, 1579
- Zaritsky et al. (1994) Zaritsky, D., Kennicutt, R. C., & Huchra, J. P. 1994, ApJ, 420, 87
- Zehavi et al. (2002) Zehavi, I. et al. 2002, ApJ, 571, 172