photopolarimetry of the long period eclipsing AM Herculis binary V1309 Ori.
Abstract
We report simultaneous photo-polarimetric observations of the long period (7.98 h) AM Her binary V1309 Ori. The length and shape of the eclipse ingress and egress varies from night to night. We suggest this is due to the variation in the brightness of the accretion stream. By comparing the phases of circular polarization zero-crossovers with previous observations, we confirm that V1309 Ori is well synchronized, and find an upper limit of 0.002 percent for the difference between the spin and orbital periods. We model the polarimetry data using a model consisting of two cyclotron emission regions at almost diametrically opposite locations, and centered at colatitude and on the surface of the white dwarf. We also present archive X-ray observations which show that the negatively polarised accretion region is X-ray bright.
keywords:
stars:individual: V1309 Ori – stars: magnetic fields – novae, cataclysmic variables – white dwarfs : stars1 Introduction
The X-ray source RX J0515.6+0105 (V1309 Ori) was preliminarily identified in the ROSAT All Sky Survey as a Cataclysmic Variable (CV) with an orbital period of 8 hrs [1993]. Garnavich et al. [1994] showed that V1309 Ori has properties which are typical of magnetic CVs (mCVs). They also found a deep total eclipse in the light curves. Pointed X-ray observations made using ROSAT [1995] showed extremely variable X-ray emission in short bursts (up to few seconds), suggesting inhomogeneous accretion of dense blobs. Detection of variable circular polarization in white light by Buckley & Shafter [1995] confirmed the classification of V1309 Ori as an AM Her star (synchronised mCVs).
The orbital period of V1309 Ori 7.98 h is 3 hours longer than in any other known AM Her system. Only three AM Hers are known to have periods over 4 hours (RX J1313–32: 4.25 h; AI Tri: 4.59 h; V895 Cen: 4.77 h: Ritter & Kolb 1998). The exceptionally long orbital period indicates that the separation between the primary and the secondary is large for mCV. According to Patterson’s [1994] scaling law, magnetic field field strengths up to 150 – 730 MG should be required to synchronize the spin of the white dwarf with the rotation of the binary system, assuming a mass for the white dwarf =0.6-1.0 M⊙ [1995]. However, spectroscopic studies have given significantly lower magnetic field values: 33 – 55 MG Garnavich et al. [1994]; 61 MG Shafter et al. [1995]; MG de Martino et al. [1998]. Frank, Lasota & Chanmugam [1995] have proposed that these low magnetic field values can be understood in terms of the standard evolutionary model, if the system is in a low accretion state for a long enough time or if the magnetic field of the secondary is strong enough (kG) to maintain synchronism. For these reasons, V1309 Ori is one of the most important objects for studying synchronization and accretion processes in mCVs and their evolution. In this paper we present the results and analysis of our polarimetric, photometric and spectroscopic observations of this system.
| UT Date | HJD Start | Filter(s) | Duration | Exp. Time | Telescope | Type of Observations |
| (at start) | (2,440,000.0+) | (hr) | (sec) | |||
| Oct 7 1997 | 10728.5920 | UBVRI | 4.42 | 10 | NOT | photopol. (lin.) |
| Oct 8 1997 | 10729.5890 | UBVRI | 4.82 | 10 | NOT | photopol.(cir. & lin.) |
| Oct 9 1997 | 10730.5875 | UBVRI | 4.65 | 10 | NOT | photopol.(cir. & lin.) |
| Nov 24 1997 | 10777.4853 | UBVRI | 8.06 | 10 | NOT | photopol.(cir. & lin.) |
| Dec 31 1997 | 10813.6973 | UBVRI | 0.17 | 10 | CASLEO | photopol. (lin.) |
| Jan 1 1998 | 10814.5737 | UBVRI | 3.17 | 10 | CASLEO | photopol. (lin.) |
| Jan 2 1998 | 10815.5954 | UBVRI | 2.85 | 10 | CASLEO | photopol. (lin.) |
| Jan 4 1998 | 10817.5781 | UBVRI | 2.37 | 10 | CASLEO | photopol. (lin.) |
| Jan 5 1998 | 10818.5980 | UBVRI | 3.01 | 10 | CASLEO | photopol. (lin.) |
| Dec 25 1998 | 11172.9840 | Blue1 & Red2 | 4.84 | 300 | ANU | spectrosc. |
| Dec 26 1998 | 11174.0080 | Blue1 & Red2 | 2.95 | 300 | ANU | spectrosc. |
| Dec 27 1998 | 11174.9310 | Blue1 & Red2 | 6.29 | 300 | ANU | spectrosc. |
NOT: 2.56 m Nordic Optical Telescope, Observatorio del Roque de los Muchachos, La Palma, Spain;
CASLEO: 2.15 m telescope, Complejo Astronomico El Leoncito, province of San Juan, Argentina;
ANU: 2.30 m Australian National University telescope, Siding Spring Observatory (SSO), Australia;
Blue1: wavelength coverage 3800Å– 5000Å
Red2: wavelength coverage 6200Å– 7500Å
2 Observations
Photo-polarimetric observations were made at the NOT (Nordic Optical Telescope, La Palma) using the Turpol-photo-polarimeter in October and November 1997 (see table 1 for the log of observations). Observations were also made on December 1997 and January 1998 with the 2.15 m CASLEO-telescope (Argentina) using the Turin-photo-polarimeter. This instrument at CASLEO is almost identical to the Turpol at the NOT.
The polarimeters have four dichroic filters, splitting the light into bands. The time resolution for photometric data is 24 sec. One polarization measurement consists of eight integrations and takes 3 minutes. In the simultaneous circular & linear mode with the /4–retarder the efficiency for circular polarization is about 70 per cent and for linear polarization about 50 per cent. With the /2–retarder 100 percent efficiency for linear polarization is achieved. The seeing was between 0.6 and 1.5 arcsec during all the nights at the NOT and the 7.5-arcsec diaphragm was used. At the CASLEO, average seeing was between 2 and 3 arcsec and the diaphragm 11 arcsec.
Sky background polarization was eliminated by using a calcite plate as a beam splitter. Sky intensity was measured at 15 – 30 min intervals. Instrumental polarization and the zero-point of position angle were determined from observations of standard stars BD+32∘3739, HD 204827, BD+64∘106, HD161056, and HD155197 [1992]. Photometric UBVRI standard stars 92282, 94242, 97351, 110340, and 114750 [1992] were used to calibrate the photometry.
Spectroscopic observations of V1309 Ori were carried out on 3 nights, starting on 25 Dec 1998, using the ANU (Australian National University) 2.3 m telescope at Siding Spring Observatory (SSO), Australia. Spectra were obtained with the double beam spectrograph using 600 lines/mm gratings. The effective wavelength coverage was 3800–5000 and 6200–7500 in the blue and red arms of the spectrograph, respectively. The conditions were photometric throughout the observations, and the effective resolution as measured from the FWHM of the arc lines was 2.1 Å. The exposure time was 300 sec for both blue and red spectra. Wavelength calibration of the flat-fielded and bias-subtracted two dimensional images was performed using He-Ar arc spectra taken at various points during the night.
The photometric ephemeris of Staude, Schwope & Schwarz [2001] (their equation (1)) is used to phase the data throughout the paper.
3 Photometry
During our observations V1309 Ori was in a high accretion state (=16), as found also in earlier photometric studies (Garnavich et al. 1994; Shafter et al. 1995). In Figure 1 we present simultaneous light curves covering nearly the full orbital cycle, obtained on November 24/25, 1997, at the NOT. Our observations made in October (NOT) 1997 and in January 1998 (CASLEO) do not cover the complete orbital cycle (and are not shown here) show that V1309 Ori was in the same brightness level (V=16) as in November 1997. We show the circular polarisation data in Figure 2 and the linear polarisation data in Figure 3.
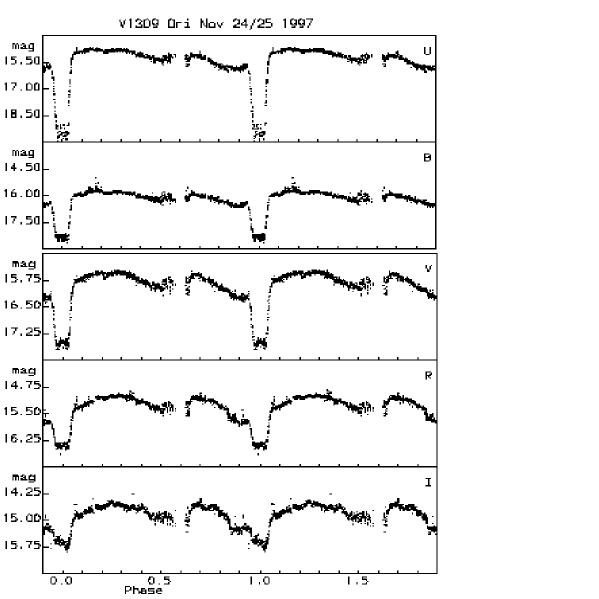


The most distinctive feature of the intensity curves (Figure 1) is the well known deep eclipse which has a duration of 0.1 orbital phase and also a strong colour dependence (up to 4 mag in , and less than 1 mag in ). Flux variations outside the eclipse are about 1.5 mag in the , and about one magnitude in the bands. Light curves show two local brightness maxima, at orbital phases and . There is a clear asymmetry between these two maxima: in the -band the first peak near is about 0.5 mag brighter than observed at , whereas in the - and -bands this difference is about 0.3 mag and in the -band typically about 0.2 mag.
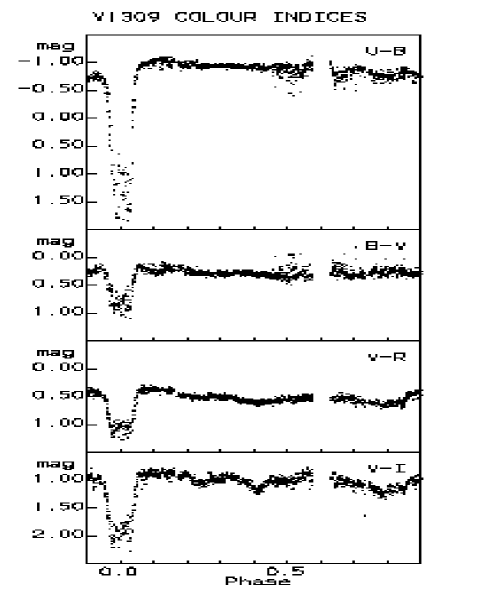
The colour indices in Figure 4 show V1309 Ori after the eclipse, where the system is also brighter than before the eclipse (Figure 1). Significant colour changes take place over the whole orbital period, when different parts of the stream are viewed at different angles. Eclipse of the secondary star by the stream also contributes, noticeably in the and bands in the phase interval 0.4-0.7.
3.1 The eclipse
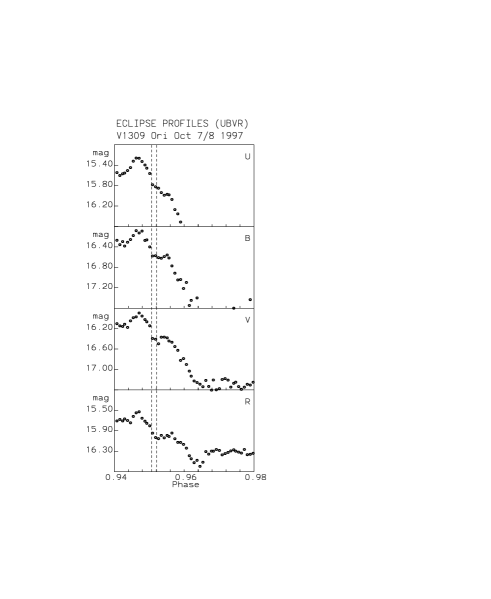
The eclipse profiles of V1309 Ori are unusual compared to other eclipsing AM Her stars such as HU Aqr or UZ For: the ingress and egress of the eclipse are very shallow and have large night to night variations (Figure 5). This suggests that there is an unusually prominent stream component. We have analyzed the colours of the ’extra’ emission defined as the flux difference between the shallowest (most disturbed) eclipse and the widest (cleanest) flat bottom light curve (Figure 5). The resulting colour indices for the additional flux = -1.0, = 0.1, and = 0.5, match the (stream dominated) colours of V1309 Ori outside the eclipse. This supports the view that that eclipse shape variations are caused by variations in the brightness or trajectory of the accretion stream.
.
Since the eclipse is composed of an eclipse of the white dwarf and stream, the mid-point of the eclipse may not be a good marker of the inferior conjunction of the secondary. This is clearly showed by Staude et al. [2001], who found that mid-eclipse of the white dwarf occurs 17220 s earlier than the observed mid-eclipse seen in the light curves.
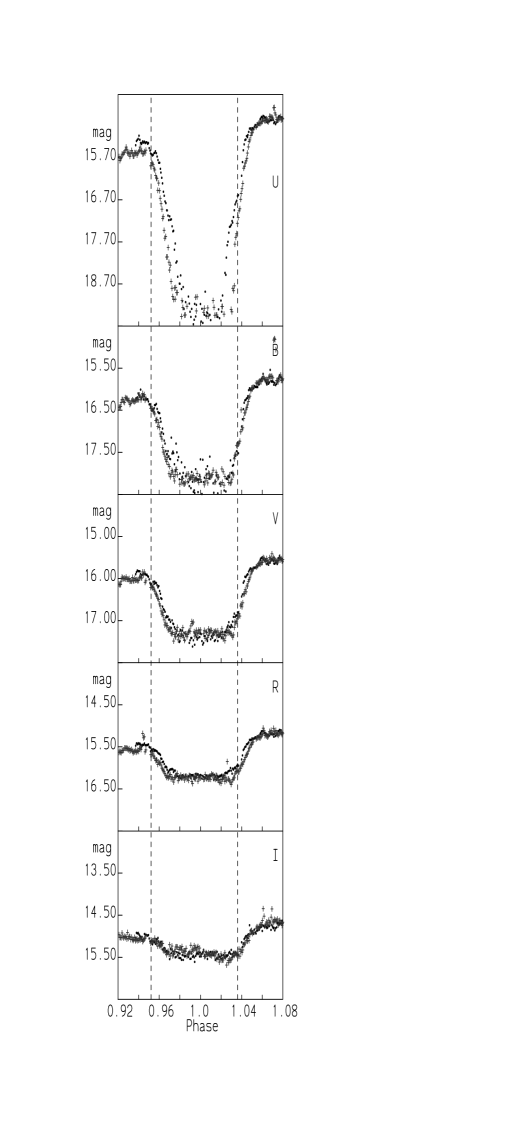
A more detailed examination of the eclipse profiles (Figure 6) reveals a rapid eclipse ingress of the white dwarf & accretion region between , seen for the first time in the optical. This drop is most prominent in data obtained in 7/8 October 1997, while on the other observing nights in October this phenomenon was not as prominent. With a time-resolution of 24 sec, we cannot determine if this rapid drop is due to the eclipse of the hot spot, or the whole white dwarf. The corresponding egress of the white dwarf should take place at =1.036 according Staude et al. [2001]. Our data (eg Figure 5), hints at a rise at orbital phase 1.04, although it is far from clear.
Interestingly, time resolved HST UV-spectroscopy by Schmidt & Stockman [2001] revealed a sharp drop in brightness, with duration of 62 sec at orbital phase , which they identified as the eclipse ingress of hot accretion spot on the surface of the white dwarf. Staude et al. [2001] did not detect the ingress and egress of the white dwarf in their broad band optical photometry, but they re-analyzed the same HST-data on V1309 Ori and concluded that the ingress (duration of 4530 sec) which occurs at orbital phase is actually due to the eclipse of the whole white dwarf.
The observed brightness of V1309 Ori during the mid-eclipse in the -band is 17.3 magnitudes and colours: , , , and . The observed value corresponds to that of a K2 dwarf, whereas other colours (, , ) fit better K5, K7 or M0 dwarf [2000]. The orbital period - secondary star relation given by Smith & Dhillon [1998] gives a much earlier spectral type for the secondary (K2-K3). The observed =0.9 shows that there is 50 per cent more flux in the B-band compared to that expected from a K7 spectral type dwarf. This extra flux might be emitted by an accretion stream which was not completely eclipsed even during the mid-eclipse. However, HST-spectroscopy analyzed by Staude et al. [2001], showed that the eclipse of the stream and the white dwarf was total in UV during their observations, implying that this was unlikely.
3.2 Quasi Period Oscillations
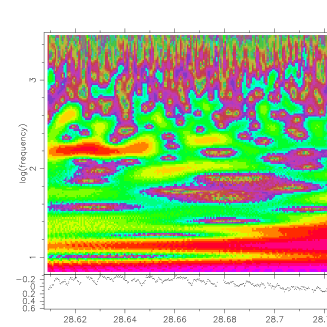
We have studied this phenomenon by performing wavelet time-series analysis of our photometric data. The main difference of using this method instead of standard Fourier analysis is that the shape of the (mother) wavelet can easily be adjusted to better correspond to the shape of the flares in flickering (for example, more triangular).
The moderate time-resolution of 24 sec of photometry does not allow us to search for variations on timescales much less than 1 min. CASLEO observations (January 1998) are not included in this analysis due to their higher noise level. In our analysis we used Morelet wavelets (for more details, see Lehto et al. 1999). Flickering up to 0.2 magnitudes occurs in the V1309 Ori light curves from night to night. This is most prominent between the orbital phases .
Our results show evidence for variability on timescales of 10 minutes (NOT observations on 6/7 October 1997; Figure 7), mostly in . Other nights also similar variability. The QPOs and flickering in the light curves have largest amplitudes near orbital phases (=0.20-0.25) when the accreting pole emitting positive circular polarization is seen face-on.
4 Polarimetry
4.1 Circular polarization
Our circular polarimetry, obtained on 24/25 November 1997, over one complete orbital cycle (Fig. 2) shows both negative and positive polarization. Positive circular polarization is observed between phases =0.0 and =0.4, while negative circular polarization is observed between phases =0.5 and =0.9. The circular polarization show strong colour dependence: polarization is strongest in and , and is fairly modest in and . This can be explained by the combined effects from cyclotron emission and dilution by the stream.
The circular polarization variations indicate that accretion occurs onto two separate regions. A single accreting pole can only give brief sign reversal when the accreting region is near the limb of the white dwarf, if the geometry is such that the angle between the line of the sight and the magnetic field can go through 90∘.
The circular polarization sign is reversed at the same orbital phases (at =0.0 and =0.4) both in our October and November 1997 data, setting tight constrains on the degree of synchronism of the spin of the white dwarf and the binary orbital period. This high degree of synchronism is strengthened when we compare our observations to the white light circular polarization data taken in December 1994 and January 1995 by Buckley & Shafter [1995]: the sign of the circular polarization changes at the same orbital phases ( and ) in their observations. An uncertainty of about 0.05 of the phase difference of the zero crossovers over more than 3000 orbital cycles corresponds to the white dwarf spin and orbital periods being equal to better than .
4.2 Linear polarization
Figure 3 (upper panel) combines our linear polarization data obtained in October, November, 1997 (NOT) and in January 1998 (CASLEO). These data have been vectorially averaged from individual observations in the bands into 40 phase bins, in order to increase the signal to noise ratio. Our linear polarization data cover a complete orbital cycle, in contrast to previous studies which were incomplete (Shafter et al. 1995; Buckley & Shafter 1995). However, the observed linear polarization in V1309 Ori is very low, less than 0.3-1.0 per cent during the orbital cycle, with no evidence for peaks near the orbital phases where the circular polarization changes its sign. Consequently, the position angle behaviour (Figure 3, lower panel) is noisy over the whole orbital cycle.
5 Spectroscopy
5.1 Doppler tomography
Doppler tomography has become a standard tool in the analysis of interacting binary star research. Given a high enough spectral and binary orbital resolution, a map can be made of the emission from a line in velocity space. The first such map of a polar was made of VV Pup [1994]. Since then the technique has been applied to several other polars (eg Schwope et al. 1999). Here we obtain emission velocity maps of V1309 Ori using the code of Spruit (1998).
Since our spectra of V1309 Ori cover 0.7 of an orbital cycle rather than a full cycle, we first determined if we could obtain useful tomograms using spectra sampling an incomplete binary orbital cycle. We extracted spectra of the polar HU Aqr from the data archive of the Isaac Newton Group, La Palma. When we use only 0.7 of the orbital cycle we find that the resulting Doppler tomograms are remarkably similar to that when we use the full orbital cycle. There are, however, some circular artifacts present in the maps and the leading face of the secondary appears to be more strongly irradiated rather than the trailing compared to the maps made using the full dataset. This test indicates that we can expect to obtain meaningful tomograms using spectra which do not fully sample the orbital cycle of V1309 Ori. Indeed, Marsh & Horne [1988] showed using simulations that useful Doppler maps can be made even when the orbital cycle has been under-sampled. However, care should be taken in not over interpreting the details of those tomograms.
V1309 Ori was found to be in a high accretion state in December 1998 with the spectra showing prominent emission lines of H and He. We generated Doppler tomograms of V1309 Ori in three emission lines (H, H and He II 4686) where we assume and =0.7 Staude et al. [2001]. We show in Figure 8 the resulting tomograms. Emission is seen from the heated face of the secondary star and from the ballistic component of the accretion stream. In the case of H, the bulk of the line emission originates from the secondary star with the stream emission being weaker. In He II the relative strength of these two components is more equal.
Doppler maps of V1309 Ori have been presented by Shafter et al. [1995] (although the spectral resolution was rather low), Hoard [1999] who presents maps in H and He II 4686 (they cover 0.8 of the orbital cycle) and also Staude et al. [2001] who show maps in H, He II 4686, 8236 and He I 4471 (they cover the complete orbit). In the case of the He II map of Staude et al. [2001] the secondary and the stream are approximately equal, while in our map the secondary is stronger and in the map of Hoard, emission from the heated face of the secondary is much weaker than the stream. Since our maps do not sample the phase range between =0.71–0.92, this could be the reason why the secondary appears brighter.
6 Archive X-ray data
ROSAT was an imaging X-ray satellite launched in 1990 with an energy range 0.1-2.0keV. It had two X-ray instruments, the PSPC and the HRI. The ROSAT data of Walter, Wolk & Adams [1995] showed evidence for a ’two pole’ nature: during half of the orbital cycle stronger X-ray emission is seen, and during the rest of the cycle weaker emission is observed. We have extracted further ROSAT archive data of V1309 Ori and phased the data of Staude et al. [2001]. We show in Table 2 the data which we have used. (There are three datasets in the archive where V1309 Ori was not significantly detected). We have scaled the data so that PSPC had an effective area of 8 times that of the HRI.
We corrected the time of each event to the barycenter of the solar system. We then phased each event on the ephemeris of Staude et al (2001) and binned the light curve. (The ephemeris is accurate enough that the phasing error is very small). We show this light curve in Figure 9. There is some uncertainty in comparing these various light curves since we do not know if they were in the same accretion state. However, as found by Walter et al. [1995], V1309 Ori is X-ray bright for approximately half the orbital cycle. It is faint from 0.0-0.5, and bright around 0.5-0.6 and 0.8–0.95. The X-ray bright phases correspond to the phases which are negatively circularly polarised.
| Date | Instrument | Exp time (s) |
|---|---|---|
| 1993 Sep 10 | PSPC | 3054 |
| 1994 Feb 28 | PSPC | 1759 |
| 1995 Sep 01 | HRI | 5825 |
| 1996 Aug 25 | HRI | 14747 |
7 Cyclotron model calculations
We have modelled the observed circular polarization variations (Figure 2) using simulation codes for cyclotron emission described in Piirola et al. (1987a, b; 1990, 1993). The cyclotron fluxes and polarization dependence on the viewing angle (the angle between the line of the sight and the magnetic field) have been adopted from the model grids of Wickramasinghe & Meggitt [1985] for constant temperature shocks (T keV). These were originally presented in 10 degree divisions, which we have then interpolated in one degrees divisions over whole range of viewing angle . Calculations are then made by dividing emission regions to equidistant points along a line on the white dwarf surface, for which Stokes parameters Q, U, V and I are calculated independently as an approximation for flat and extended regions. The height of the shock is assumed to be negligible compared with the white dwarf radius.
7.1 Unpolarized background
Based on the earlier studies of V1309 Ori (Shafter et al. 1995; Schmidt & Stockman 2001; Staude et al. 2001) and our observations (§3) it is clear that variations in the light curves are mostly caused by prominent stream emission with a smaller fraction due to cyclotron emission. It is therefore necessary to include a large unpolarized background when modelling the polarised light curves. We have done this in two different ways: (1) with constant background as first approximation, and (2) adopting the observed total flux as a function of the orbital phase as the variable unpolarized background. The latter case is more realistic for V1309 Ori due to the large amount of the unpolarized flux from the stream emission which varies during orbital cycle. The diluting flux from stream emission in V1309 Ori is 5–10 times larger than the peak cyclotron flux, estimated from the fast drop of intensity at the eclipse of the compact source observed at phase (§3.1). The X-ray temperature is chosen = 10 keV according to observations of de Martino et al. [1994].
7.2 Parameters for accretion geometry
Two-pole accretors, for example VV Pup [1989], UZ For [1990], DP Leo [1993] and QS Tel [1995], have been found to show different magnetic field strengths in the accretion regions located in opposite hemispheres: up to factor of 2 difference in the field strengths has been measured. The more strongly accreting pole has normally the weaker magnetic field. In the case of V1309 Ori there are no major differences seen in the wavelength dependence of the positive and negative excursions of the observed circular polarization curves (Figure 2), suggesting that both accreting regions are accreting nearly equally. Therefore, we have chosen the electron temperature and the plasma parameter ( =105) to be the same in both regions. We assume an inclination of i=78∘ Staude et al. [2001]. Parameters such as the longitude of the emission region(s) on the surface of the white dwarf, and extension of the accretion regions were varied to match the gross features seen in the circular polarization behaviour. Due to very low level of the linear polarization (less than 0.5 per cent), and noisy position angle variations, we have not tried to use linear polarization to fix any model parameters. Another reason for not doing so is that scattering from free electrons of the stream can introduce significant linear polarization effects, dominating over the low linearly polarized flux of cyclotron origin.
Estimates of the colatitude of the accretion region can be made if we assume that the observed circular polarization from different poles is not significantly affected by possible overlap of the polarized emission from another accretion region. We can estimate for this region using the duration of the self-eclipse of the accretion region and equation (1) of Visvanathan & Wickramasinghe [1981]. Using the circular polarisation data shown in Figure 2, we find for the positive pole, and for the negative pole, assuming an inclination by Staude et al. [2001].
7.3 Results from the modelling
Observed circular polarization variations can be reproduced reasonably well with a model consisting of two separate emission regions, one centered at colatitude = 145∘ (the positive pole), seen closest to the observer at , and another region centered in at = 35∘ (the negative pole), seen closest to observer . For both regions we have adopted in Figure 10 longitudinal extension of 30∘ (in white dwarf rotational coordinates), but these values are not strongly constrained. Extensions in the range 10∘ – 60∘ give almost similar results. Point-like emission region gives too sharp polarization variations and very extended emission regions (larger than ) too smooth and low-amplitude curves.
The model shown in Figure 10 assumes that cyclotron harmonics 6, 5, 4, 3, and 2, dominate in the passbands, respectively. This corresponds to a magnetic field of about 50 MG, which is similar to the estimated values for magnetic field (33– 55 MG Garnavich et al. 1994; 61 MG Shafter et al. 1995). For a 50 MG field the wavelengths of the harmonics 6 to 3 are at , , and , i.e. one cyclotron harmonic clearly dominates in each of the bands. Our band () falls about half-way between the 3rd and 2nd harmonics at . The best correspondence to the observed circular polarization variations is achieved using the model where unpolarized background varies in a similar way to the total observed flux over the orbital cycle (Figure 10, continuous line).
Our model parameters for the location of accretion regions (in white dwarf rotation coordinates), positive pole at and negative pole at , are similar to the values reported by Harrop-Allin et al. [1999], who modelled white light data of Buckley & Shafter [1995]: and . In contrast Staude et al. [2001] derived values of = 17∘ and from their Doppler maps. In that study it was assumed that only one accretion region was visible. Although it is possible for an accretion region to show both positive and negative circular polarisation, it is only for a short phase duration if we observe the ‘underside’ of the shock.

8 Discussion
8.1 A well synchronised system
By comparing our circular polarization curves with those found in the literature we confirm that the spin of the white dwarf in V1309 Ori is synchronised with the orbital period to a high degree. The zero-crossings of circular polarization take place at the same phase of the orbital period as found by Buckley & Shafter [1995], which puts an upper limit of per cent for the difference of the white dwarf spin and orbital period. There are four polars which have been found to show a small (1 percent) degree of asynchronism. The polar showing the smallest, V1432 Aql, is 0.28 percent asynchronous [1997]: over two orders of magnitude greater than V1309 Ori.
8.2 Accretion geometry
Our circular polarimetry curves (Figure 2) shows clear positive and negative excursions which indicate that V1309 Ori has two accreting poles. This is consistent with previous polarisation observations. The X-ray data from the ROSAT archive suggests that the negative circularly polarised pole is brighter in X-rays. It is possible that it is bright because of the increased mass transfer at this pole. Alternatively, it might be due to the fact that the accretion flow to this pole is very inhomogeneous, with the dense parts of the flow accreting directly into the white dwarf without causing a shock and therefore liberating its energy at soft X-rays.
We note that Staude et al. [2001] based on optical/UV photometry and optical spectroscopy did not find any evidence for a second accretion pole, although they could not exclude one. Their modelling predicts that the one accreting pole would show a maximum in the soft X-ray light curve at =0.045 and would show a self eclipse at =0.55. However, the ROSAT data does not confirm this view. Indeed, we see maximum flux at =0.55 and a minimum at =0.045.
The X-ray data does show a dip around =0.7. This is unlikely to be due to absorption of X-rays by the accretion stream since the stream does not cut through our line of sight to the accretion region at this phase. It is also unlikely that this dip is due to that observation being at a lower accretion state since the same observation shows a peak at =0.6. The cause of the dip in X-rays is unclear but maybe due to a fraction of the accretion region being self-eclipsed by the white dwarf at these phases.
8.3 The mass of the white dwarf
Along the ballistic flow, emission extends to km s-1, km s-1 in our maps and also the maps of Hoard (1999). The maps of Staude et al.[2001] show the flow extending to km s-1. Taking from our maps (giving a velocity of 820 km s-1) and using (where is velocity and is distance from the white dwarf), we find that the end of the ballistic flow is =2.4 and cm distant from the white dwarf for =0.6 and 0.7respectively.
We can compare these estimates to the expected distance from the white dwarf that material gets coupled by the magnetic field () using equation (1b) of Mukai [1988]. We assume =50 MG (typical of the estimates made for V1309 Ori), =3 (the radius of the stream in units of cm: the value estimated for HU Aqr, Harrop-Allin et al. 1999) and =10 (the mass transfer rate in units of 1016 g s-1, Harrop-Allin et al. 1997). We find that for =0.6 and 0.7we get = 3.4 and 2.1 cm respectively. Although there is some considerable degree of uncertainty in how applicable the above formulation for actually is, it is interesting that for masses between 0.6–0.7the predicted value of is consistent with our Doppler maps. This range of mass is consistent with that estimated by Staude et al. [2001].
8.4 QPOs and their timescales
Our photometric observations show evidence for QPOs on time scales of 10 min with amplitudes up to 0.2 magnitudes. This compares with 6.7 and 15.5 min: Shafter et al. [1995]. There are some examples of other AM Her systems where flickering on time scales of few minutes have been observed: 4.5 min in BL Hyi [1984], 4 – 11 min in QQ Vul [1987], and in AI Tri 6.5– 7 min and 13.5 – 14 min [1998]. We speculate that the QPOs in V1309 Ori are due to ’blobby accretion’, already observed in X-ray data (Walter, Wolk & Adams 1995; de Martino et al. 1998).
We compare these timescales with those derived by King [1989], and King [1995] (see also Chanmugam 1995). The irradiation of the accretion flow may ionise the subsonic accretion flow below the inner point and modulate gas flow through this point on the timescale of the dynamical time scale in the Roche potential near . The equation presented by King [1989]
| (1) |
where is the scale height and is local sound speed near , predicts the timescales for these oscillations. The orbital period of 479 minutes gives us a prediction of 26 minutes for V1309 Ori. The observed timescales of QPOs in V1309 Ori, 10 and 15 minutes, are approximately half of the predicted. The QPOs are seen strongest in , and are negligible in the longer wavelengths, which may due to reason that only a fraction of flow will undergo these oscillations near , as pointed out by King [1995].
8.5 Eclipse profiles
Several eclipsing polars have been observed with high signal to noise and high time resolution. These include HU Aqr [1999] and UZ For [2001]. Both of these systems show a sharp eclipse ingress lasting several seconds. This sharp drop in intensity is associated with the eclipse of the bright accretion region on the white dwarf. In the case of UZ For there are two sharp intensity drops, indicating that there are two accretion regions visible during the eclipse.
One of the most striking features about the eclipse profiles of V1309 Ori is the obvious lack of a sharp ingress or egress which indicate the (dis)appearance of the white dwarf and/or hot spots in the surface of the white dwarf behind the secondary. The relative faintness of the accretion region(s), compared to the bright accretion stream in V1309 Ori, may be the reason for this.
After the eclipse of the white dwarf, the accretion stream is still visible for a length of time. Observations of other polars such as HU Aqr (Glenn et al. 1994, Bridge et al. 2002) show that this length of time can vary from one cycle to the next. The fact that we observe a variable eclipse ingress of the accretion stream in V1309 Ori is therefore not un-typical of polars. However, what does make V1309 Ori unique amongst polars is the fact that the eclipse egress is highly variable: all other polars show a rapid rise at the same phase coming out from eclipse. The fact that V1309 Ori does not implies either that we can observe the stream above the orbital plane before the white dwarf is visible, or that the accretion stream travels far enough around the white dwarf so that it is visible before the white dwarf itself.
To investigate if this further, we shown in Figure 11 the view of the system at two different phases (= 0.96 and 1.04). We use the following system parameters in determining these: , =0.67, [2001] and a white dwarf - secondary star separation of 1.47 cm (determined using the above parameters and standard Roche lobe geometry). We also show a single magnetic field line originating from the negative circularly polarised accretion region ( and face onto the observer at =0.2, §7.3). In Figure 11, the accretion streams leading to both poles are visible at . At only the stream leading to the negative pole is visible. The white dwarf appears before the stream leading to the positive pole is visible. Even if the negative pole is not visible at 0.04, the emission from the stream leading to that pole is. We take =0.2: this implies cm. This is consistent with our findings in §8.3. This shows that for this accretion stream geometry the accretion stream is visible after the white dwarf has been eclipsed and also before the white dwarf comes out of eclipse. If the stream emission was highly variable then this could explain the variable egress profile.
8.6 Evolution
Garnavich et al. [1994] and Shafter et al. [1995] noted that the secondary star in V1309 Ori is oversized for its spectral type (M0 - M1) and mass (0.4–0.6 ). Indeed, recent binary evolution models (eg Smith & Dhillon 1998 and Baraffe & Kolb 2000) which assume an unevolved donor star and typical mass transfer rates, all predict either a much earlier or later spectral type for V1309 Ori than observed (cf Figure 1 of Baraffe & Kolb 2000).
However, by assuming an evolved donor it is possible to match the observed spectral type to the predicted value. For instance, from Figure 3 of Baraffe & Kolb [2000], for an initial secondary star mass of =1.2, a central Hydrogen abundance at the start of mass transfer of =0.05, and a mass transfer rate of ) g s-1) we find we that a spectral type of M1 is predicted for an orbital period of 8 hrs. This is within the estimated range of values required to satisfy conditions for observed oversized secondary to fill its Roche lobe (the main uncertainties are the distance and the mass of the white dwarf, eg Harrop-Allin et al. 1997, de Martino et al. 1998).
As already noted by King, Osborne & Schenker [2002], V1309 Ori is indeed a good possible candidate for a binary system which has gone through a supersoft source phase and contains a nuclear evolved donor star. Szkody & Silber [1996] and Schmidt & Stockman [2001] have noticed that V1309 Ori has extraordinary strong excitation lines of and ) which may support such an interpretation.
9 Acknowledgments
Nordic Optical Telescope is operated on the island of La Palma jointly by Denmark, Finland, Iceland, Norway, and Sweden, in the Spanish Observatorio del Roque de los Muchachos of the Instituto de Astrofisíca de Canarias. This work has been supported by the European Commission through the Activity “Access to Large Scale Facilities” within the Programme “Training and Mobility of Researchers” awarded to the Instituto de Astrof́isica de Canarias to fund European Astronomers access to its Roque de Los Muchachos and Teide Observatories (European Northern Observatory), in the Canary Islands. SK is grateful for the Finnish Academy of Sciences and Letters for support. We would like to thank also the Australian National University for the allocation of telescope time and Dr Henk Spruit for the helpful advice and generous use of his Doppler Tomography software. The ROSAT data were extracted from the Leicester Database and Archive Service.
References
- [2000] Baraffe I., Kolb U., 2000, MNRAS 318, 354
- [1993] Beuermann K., Thomas H.-C., 1993, AdSpR 13, 115
- [2002] Bridge, C., Cropper, M., Ramsay, G., Perryman, M. A. C., de Bruijne, J., Favata, F., Peacock, A., Rando, N., Reynolds, A. P.,2002, MNRAS 336, 1129
- [1995] Buckley D.A.H, Shafter A. W., 1995, MNRAS 275, L61
- [1995] Chanmugam G., 1995, in “Cape workshop on magnetic cataclysmic variables” eds. Buckley D.A.H. and Warner B., ASP Conf. Ser. 85, 317
- [2000] Cox. A. N.,2000, Allens Astrophysical Quantities, Fourth Edition, AIP, Springer-Verlag, New York,
- [1993] Cropper M. S., Wickramasinghe D. T., 1993, MNRAS 260, 696
- [1998] de Martino D. et al., 1998, A&A 332, 904
- [1994] Diaz M. P., Steiner J. E., 1994, A&A 283, 508
- [1995] Frank J., Lasota J.-P., Chanmugam G., 1995 ApJ 453, 446
- [1994] Garnavich P. M., Szkody P., Russel M. R., Zurek D. R., Hoard D. W., 1994, ApJ, 435, L141
- [1997] Geckler, R. D., Staubert, R., 1997, A&A325, 1070
- [1994] Glenn, J., Howell, S., Schmidt, G., Liebert, J., Grauer, A., Wagner, R. M., 1994, ApJ, 424, 967
- [1999] Harrop-Allin M.K., Cropper M., Hakala P. J., Hellier C., Ramseyer T., 1999, MNRAS 308, 807
- [1999] Hoard D. W., 1999, In ‘Annapolis workshop on magnetic cataclysmic variabless’, ASP Conf Series, Vol 157, p 201.
- [1989] King A.R., 1989, MNRAS 241, 365
- [1995] King A.R., 1995, in “Cape workshop on magnetic cataclysmic variables” eds. Buckley D.A.H. and Warner B., ASP Conf. Ser. 85, 21
- [2002] King A. R., Osborne J. P., Schenker K., 2002, MNRAS 329, L43
- [1992] Landolt, A., 1992, AJ 104, 340
- [ 1999] Lehto H. J., Katajainen S., Piirola V., 1999, in proceedings “ Astrophysics with the NOT” conference held in Turku August 12-15, 1998, eds. H. Karttunen and V. Piirola, University of Turku
- [1988] Marsh, T., Horne, K., 1988, MNRAS 235, 269
- [1988] Mukai, K., 1988, MNRAS, 232, 175
- [ 1987] Osborne J. P., Cropper M., Christiani S., 1987, Space Sci.Rev. 131, 643
- [1994] Patterson, J., 1994, PASP 106, 209
- [2001] Perryman M. A., Cropper M., Ramsay G., Favata F., Peacock A., Rando N., Reynolds A., 2001, MNRAS, 324, 899
- [1987a] Piirola V., Reiz A., Coyne G. V., 1987a, A&A 185, 189
- [1987b] Piirola V., Reiz A., Coyne G. V., 1987b, A&A 186, 120
- [1990] Piirola V., Reiz A., Coyne G. V., 1990, A&A 235, 245
- [1993] Piirola V, Hakala P., Coyne C. V., 1993, ApJ 410, L107
- [1998] Ritter H., Kolb U., 1998, A&AS 129, 83
- [1992] Schmidt G.D., Elston R., Lupie O.L., 1992, AJ 104, 1563
- [2001] Schmidt G. D., Stockman H. S., 2001, ApJ 548, 410
- [1999] Schwope A. D., Schwarz R., Staude A., 1999, In ‘Annapolis workshop on magnetic cataclysmic variabless’, ASP Conf Series, Vol 157, p 71.
- [1995] Shafter W. A., Reinsch K., Beuermann K., Misselt K. A., Buckley D. A. H., Burwitz V., Schwope, A. D., 1995, ApJ 443, 319
- [1998] Schwarz R., et al, 1998, A&A 338, 465
- [1990] Schwope A. D., Beuermann K., Thomas H. C., 1990, A&A 230, 120
- [1995] Schwope A. D., Thomas H. C., Beuermann K., Burwitz V., Jordan S., Haefner R., 1995, A&A 293, 764
- [1984] Singh K. P., Agrawal P. C., Riegler G. R., 1984, MNRAS 208, 679
- [1998] Smith D. A., Dhillon V. S., 1998, MNRAS 301, 767
- [1998] Spruit H. C., 1998, astro-ph/9806141
- [2001] Staude A., Schwope A. D., Schwarz R., 2001, A&A 374, 588
- [1996] Szkody P., Silber A., 1996, AJ 112, 289
- [1981] Visvanathan N., Wickramasinghe D. T., 1981, MNRAS 196, 275
- [1995] Walter F. M., Wolk S. J., Adams N. R., 1995, ApJ 440, 834
- [1985] Wickramasinhge D. T., Meggit S. M. A., 1985, MNRAS 214, 605
- [1989] Wickramasinghe D. T., Ferrario L., Bailey J., 1989, ApJ 342, L35