Carbon Chemistry in interstellar clouds
Abstract
We discuss new developments of interstellar chemistry, with particular emphasis on the carbon chemistry. We confirm that carbon chains and cycles are ubiquitous in the ISM and closely chemically related to each other, and to carbon. Investigation of the carbon budget in shielded and UV illuminated gas shows that the inventory of interstellar molecules is not complete and more complex molecules with 4 or more carbon atoms must be present. Finally we discuss the consequences for the evolution of clouds and conclude that the ubiquitous presence of carbon chains and cycles is not a necessary consequence of a very young age for interstellar clouds.
keywords:
ISM: molecules – ISM: clouds – ISM individual (IC 63, L 134N, Horse head nebula, TMC-1)1 Introduction
Nearly 120 molecules have now been observed in various sources in the interstellar medium. Emission or absorption lines from these molecules carry important information on the physical conditions and the chemical properties of the various sources where they have been recognized. However, only a very limited number of molecules is used for that purpose, while much more information is available. The use of molecular lines detected with high resolution spectroscopy for studying the interstellar medium, and the star formation processes, are still largely unexplored. High resolution spectroscopy, either using heterodyne techniques in the radio domain, or with high dispersive power spectrometers, yields not only the line intensities but information on the gas dynamics through the analysis of line profiles. Many lines can be analysed together for studying physical conditions. Different approaches can be used to solve the radiative transfer equation, from the simplest LTE model to sophisticated multidimensional models. Also, other line properties can be exploited to get information on the magnetic field, either directly from the Zeeman effect on paramagnetic molecules, or indirectly with other techniques (e.g. [\astronciteHoude et al.2003]). And finally, the molecular abundances are the basic information for the chemistry. The question which arises then is how to select the best molecule and the best lines to get useful information.
All interstellar molecules can not be detected in the various environments of the ISM. This evolution of the emerging spectrum, hence of the chemical properties, is tightly connected to the physical conditions and environment of the source. With the advent of more sensitive receivers and better mapping techniques, it is now possible to study extensively the chemical properties of specific sources. For example [*]Tur:00 have performed detailed observational studies and modeling of a large set of interstellar molecules in cloud cores. We present in this paper new studies of interstellar chemistry devoted to carbon chemistry and the condensation processes on dust grains, which make use of molecular line observations.
2 Hydrocarbons in interstellar chemistry
Carbon is the fourth most abundant element in the interstellar medium, and also the more versatile for building molecules. Carbon chemistry can therefore be viewed as the core of interstellar chemistry. Most interstellar molecules (74 %, or 85 out of 114) have at least one carbon atom. The heaviest and most complex molecules are organic molecules with carbon. This statistics does not take into account the PAHs, nor the DIBs carriers which most likely hypothesis are large organic molecules ([\astronciteHerbig1995]). Carbon, neutral or ionized, is also one of the main reactants in interstellar chemistry networks, due to the large number of organic molecules, but also to the reactivity and versatility of Carbon, which can participate in numerous chemical reactions at any temperature, from the very cold dense cores, to warm and hot gas. Therefore understanding the carbon chemistry is of major importance in astrochemistry, and for star formation. As a first step, we discuss diffuse clouds and photon dominated regions, and determine the carbon budget. We then discuss dark clouds chemistry and compare the carbon budget in all environments. At last we compare observations and state of the art models.
2.1 Diffuse gas
While CH, CH+ and CN are known in the ISM since the 40’s, the detection of other molecules in diffuse gas has paused for a while. But recent deep observations have revealed and/or confirmed the presence of diatomic, triatomic and even more complex molecules in diffuse gas. Carbon clusters (C2, C3) are now almost routinely detected in the visible towards bright stars ([\astronciteMaier etal.2001], [\astronciteRoueff et al.2002]). C3 can be seen in the far infrared through its low energy vibration mode ( [\astronciteGiesen et al.2001], [\astronciteCernicharo, Goicoechea and Caux2000]); and maybe also C4 [*]Cerni:02. Detections in the far infrared are obtained towards the massive star forming region SgrB2 close to the Galactic Center, and sample more opaque clouds than typical diffuse clouds. Typical numbers for column densities and abundance ratio are given in Table 1.
Using radio telescopes [*]Ll:00 have shown that CCH and c-C3H2 are ubiquitous in diffuse gas, confirming previous work by [*]Cox:89. These two species are spatially correlated and present a well defined abundance ratio N(CCH)/N(c-C3H2) = in diffuse clouds ([\astronciteLucas and Liszt2000]). The previous work used strong background continuum sources such as quasars to search for molecular absorption lines. The supernova remnant, Cas A, one of the strongest radio source in the sky, is a good target to search for absorption lines. [*]Bell:95 and [*]Bell:83 have reported the detection of C3N and C4H along this line of sight. Though the physical conditions are not as accurately determined as in the diffuse clouds, these observations confirm the presence of rather complex molecules in different environments exposed to UV radiation.
Diffuse clouds ; Absorption lines
Molecule
N(X)
Ref.
(cm-2)
C
0.008
1
CH
1
1
C2
1
1
C3
15
2
C4 ?
3
CCH
4
c-C3H2
30
4
C4H
30
5
PDRs
| Molecule | N(X) | Ref. | ||
|---|---|---|---|---|
| (cm-2) | ||||
| CCH | 1 | 4 | ||
| c-C3H2 | 18 | 4 | ||
| C4H | 9 | 6 | ||
| c-C3H | 50 | 6 | ||
| l-C3H | 90 | 6 | ||
| l-C3H2 | 6 |
References : 1) [*]Fed:94, [*]Rachford:02, [*]Shuping:99 2) [*]Roueff:02 3) [*]Cerni:02 4) [*]Ll:00 5)[*]Bell:83 6) This work.
2.2 Photodissociation regions
A natural question therefore arises : if carbon chains are present in the diffuse interstellar medium, what happens in photon dissociation regions ? As in diffuse clouds, the chemical processes are dominated by the radiation in PDRs, but the gas is denser. The radiation field, also more intense than in diffuse clouds, is generally well measured. Also, with the new data obtained with ISO, and particularly the mid-IR emission due to PAHs, it is possible to estimate the gas density from the mid-IR data and compare with determination from molecular lines (see e.g. the case of the horsehead nebula ([\astronciteAbergel et al.2003], [\astronciteTeyssier et al.2003]). We have detected simple carbon chains and cycles in four nearby photodissociation regions : the interface near HD 147889 in Ophiuchus, NGC 7023, IC 63 and the horsehead nebula. We report here the results for the last two sources but similar conclusions can be drawn for all PDRs ([\astronciteFossé2003]). The horsehead nebula showed the brightest lines and deserved a more extensive study ([\astronciteTeyssier et al.2003]).
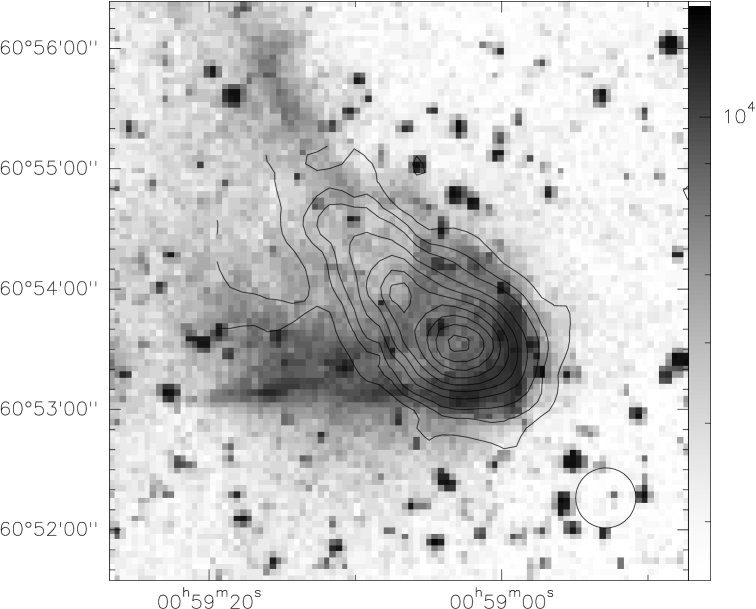


IC 63 is a small cometary globule illuminated by the B0.5 star Cas (HD 5394), at a distance of 230 pc. The PDR has been studied and characterized by [*]Jan:94 and [*]Jan:96. The gas density is rather high in the ”head” of the nebula, cm-3 but slightly lower in the ”tail” (104 cm-3). The gas is warm with T K due to the intense radiation field, in units of the Habing ISRF ([\astronciteHabing1968]). From the overall shape of the nebula, it is likely that the molecular gas is currently photo-dissociated and evaporated by the intense radiation. Indeed the total column density of molecular hydrogen is rather moderate for a dense cloud, with a peak value of N(H2) = ([\astronciteJansen, Van Dishoeck and Black1994]). Using the IRAM 30m telescope, we have detected CCH, c-C3H2 and C4H in IC 63 and searched for c-C3H and l-C3H. Examples of spectra are shown in Figures 1 and 2. We found that CCH and c-C3H2 are present everywhere in the nebula, both at the CO peak and in the tail where 13CO disappears. Compared to the line profiles at the peak position, the lines are a factor of two weaker in the tail, and their centroid is redshifted. The same difference is also seen in 12CO spectra while 13CO is barely seen in the tail (Fig. 2). Both the large scale distribution and the similarity of profiles with 12CO indicate that CCH and c-C3H2 are present in the external layers of the PDR, where the radiation field destroys 13CO. C4H looks similar to CCH and c-C3H2 though the S/N is rather low for this species. We derived column densities of N(CCH) cm-2 and N(c-C3H2) cm-2, N(C4H) = cm-2 for this source. The upper limits are N(c-C3H) cm-2, N(l-C3H) cm-2.

Lines are stronger in the horsehead nebula, where both C3H isomers, the cyclic and linear forms, are detected. As in IC 63, all hydrocarbon maps are very similar to each other, but rather different from those of CO and isotopes ([\astronciteTeyssier et al.2003]). A scatter plot between intensities of CCH, c-C3H2, C4 and C18O is shown in Fig. 3. While the correlation is perfect between CCH and both C4H and c-C3H2, the scatter plot with C18O shows a larger dispersion. A closer inspection reveals that the signal from CCH remains constants near 1 Kkms-1 at the positions the furthest away from the cloud edge, while C18O lines get brighter there. From these correlations, and knowing the physical conditions in the horsehead nebula, we derived typical abundance ratio for the hydrocarbons, which can be compared with the results in diffuse clouds. They are listed in Table 1. C4H and c-C3H2 have very similar abundances in PDRs, and are about one order of magnitude less abundant than CCH. Both C3H isomers are less abundant than c-C3H2. The same is true for the linear isomer l-C3H2 compared to the cyclic isomer.
2.3 The carbon budget
| Number of Carbon Atoms | ||
|---|---|---|
| 1 (C+, C, CO, …) | 1 | |
| 1 (CH, CH+, …) | ||
| 2 (C2, C2H, …) | ||
| 3 (C3,c-C3H2, …) | ||
| 4 (C4, C4H, …) |
This table shows for molecules with a given number of carbon atoms (Column 1), the total abundance relative to H2 (Column 2) and the total number of carbon atoms locked in molecules this size compared to the available number of Carbon atoms in the gas phase (Column 3). We used a gas phase Carbon abundance realtive to H of .
Abundances and abundance ratio of carbon chains are very similar in PDRs and in diffuse gas. We present below a tentative carbon budget, combining the information obtained at all wavelengths in diffuse clouds and in PDRs. Since all molecules are not observed in the same sources, this carbon budget has only a statistical meaning, and numbers cannot be very accurate. We have coadded typical abundances for molecules with a given number of carbon atoms, from one to four (see Table 2). Nevertheless, the comparison of the fraction of carbon atoms locked into molecules of various sizes (Column 3) shows a clear trend. It decreases steeply with the number of carbon atoms for small molecules, but then tends to flatten for molecules having three or more carbon atoms. If the trends continue for larger species, the detection of larger carbon clusters or carbon chains looks promising for the near future. The only work so far is the negative search for C4 and C5 towards Oph ([\astronciteMaier, Walker and Bohlender 2002]). Despite the brightness of this star the limits achieved so far do no rule out the presence of these carbon clusters with an abundance 10 times lower than C3. Searches are necessary in more opaque lines of sight where larger column densities for all species are expected.
2.4 Models
Chemical models are now capable of dealing with very large
reaction rates sets, including complex molecules. We used two
different reaction rates sets, the UMIST-95 file ([\astronciteLe Teuff, Millar and Markwick2000])
and the New standard model (NSM - [\astronciteTerzevia and Herbst1998]) coupled with the
Meudon PDR code ([*]LB:93, and
http://aristote.biophy.jussieu.fr/MIS/).
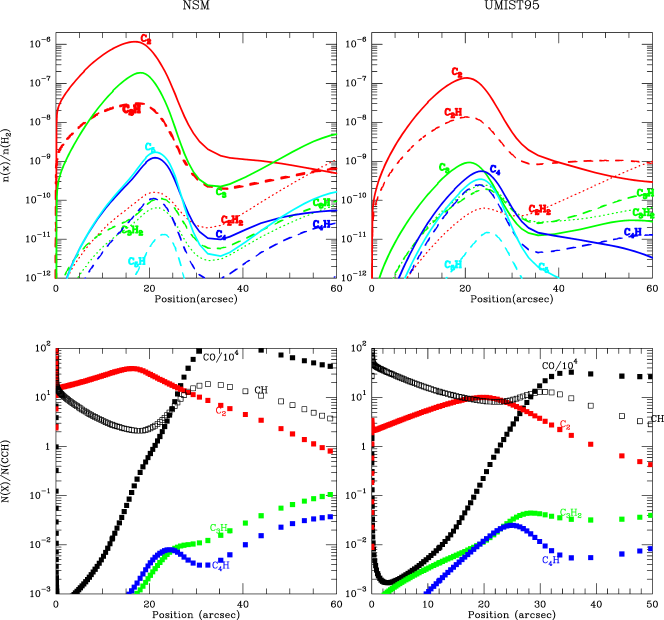
Results are shown in Figure 4 for physical conditions
adapted to the horsehead nebula, namely a gas density of
cm-3 and a radiation field 100 times more
intense than the mean value, G0 = 100. We show for each model
the variations of selected molecular abundances as a function
of the distance to the cloud edge, as well as the spatial
variations of abundance ratio relative to CCH. A good spatial
correlation with CCH (as c-C3H2 in Fig. 3) would
produce a constant abundance ratio in these plots.
Predictions obtained from both the
UMIST-95 and NSM sets follow the same general trend with a peak of
carbon chains at arcsec (AV = 2 mag) and a second peak
deeper into the cloud. Also the chemistry in the UV dominated region
is very simple, with pure carbon clusters (C2, C3, etc.)
being more abundant that radicals (C2H,C3H, etc.)
which are themselves more abundant than more hydrogenated species
(C2H2, C3H2, etc.). Finally abundance ratios of both
C3H2 and C4H with CCH do not vary much inside the cloud
(for Positions larger than 20 arcsec) but decrease sharply at the
cloud edge. This simple behavior is in contrast
with our measurements :
– C3H2 is always more abundant than C3H, this is true
for the cyclic isomer alone and when different isomers are combined.
– C4H and c-C3H2 have almost the same abundance,
, a factor of ten at least larger than the
predicted value
– All hydrocarbons observed are detected in the UV illuminated region
where the PAH emission is observed, while the model predict a spatial
offset.
While models are able to reproduce fairly well the formation of CO, and marginally the CCH abundance, severe problems remain for larger molecules. Since the main destruction process is photodissociation – an efficient mechanism in PDRs – new formation routes must be found for explaining the large abundances of C4H and C3H2 observed in PDRs. It is likely that some reaction rates used in current models are inaccurate, and that important reactions are still missing. We need more observations on simple species to progress, especially on neutral and ionized carbon which are the main reactants in the chemical reaction networks.
3 Chemistry in dark clouds
3.1 Carbon chemistry
Since the same networks are used to probe dark cloud and PDR chemistry, we may learn on the formation processes by comparing abundances and abundances ratio in different environments. TMC-1 in the Taurus molecular cloud is known as the ISM ”carbon factory”, in which long carbon chains and cyanopolyyne have been detected. Neutral carbon itself is known to be abundant both in TMC-1 ([\astronciteSchilke et al.1995], [\astronciteMaezawa et al.1999] and in L 134N ([\astronciteTatematsu et al.1999]). According to these authors, the constancy of the antenna temperature of the ground state fine structure line of atomic carbon in dark clouds, T , indicates that atomic carbon is abundant in the sources and acts as a coolant. The corresponding kinetic temperature is about 9 K, a typical figure for dark clouds. Since the emission is very extended, it is likely that carbon is present in the molecular envelope, and helps in cooling this envelope down to 10 K. Is the presence of long carbon chains related to neutral carbon ? Are long carbon chains present in other dark clouds ? We performed a restricted survey of carbon chains in L134N, to have a comparison with TMC 1 and answer these questions. The results will be described in more detail elsewhere ([\astronciteFossé2003]), and are just summarized below.
In deep integrations we obtained new detections of C3H (cyclic and linear), C4H and C6H in L134N. A CCH map is shown in [*]Dickens:00. Compared to molecules tracing the cloud core such as NH3 and N2H+ (e.g. [\astroncitePagani2003], [\astronciteBergin et al.2003]), CCH peaks are spatially separated from dense gas but coincide with those of C4H and other hydrocarbons ([\astronciteDickens et al.2000], [\astronciteFossé2003]). From the low line intensity, and the different spatial distribution, we conclude that carbon chains reside in cold but not very dense molecular gas in L134N: n(H2) = cm-3 and T = 10 K. The column densities are nevertheless rather large, and reach similar values as towards the cyanopolyyne peak in TMC-1, namely N(CCH) cm-2, N(C4H) = cm-2 and N(C6H) = cm-2.
These conclusions are consistent with the presence of atomic carbon in dark cloud envelopes. Carbon chains, which are detected both in diffuse or dark clouds, and also in PDRs, seem to be always seen in places with rather large abundances of carbon, either atomic or ionized. Though unexpected, since the formation of hydrocarbons is driven by chemical reactions involving C and C+, the observed abundances and abundance ratio constrain efficiently current models.
3.2 Carbon budget in dark clouds
| Number of Carbon Atoms | ||
|---|---|---|
| 1 (C+, C, CO, …) | 1 | |
| 1 (CH, HCN, CS …) | ||
| 2 (C2H, C2S…) | ||
| 3 (c-C3H2, HC3N, CH3CCH …) | ||
| 4 (C4H, C4H2, …) | ||
| 5 (HC5N, C5H, …) | ||
| 6 (C6H, C6H2…) | ||
| 7 (HC7N, …) | ||
| 8 (C8H, …) | ||
| 9 (HC9N, …) | ||
| 11 (HC11N, …) |
The table shows for molecules with a given number of carbon atoms, the total abundance relative to H2 in TMC-1 and the total number of carbon atoms compared to the available number of Carbon atoms in the gas phase. We assumed a gas phase CO abundance relative to H2 of and a total H2 column density of cm-2. Data on TMC-1 from [*]Tur:00, [*]Pratap:97, [*]Bell:98, [*]Fosse:01, [*]Dickens:01.
As for PDRs we have computed the carbon budget for cold dark clouds. Due to the presence of ice mantles on dust grains, the absolute column densities of H2 are uncertain in this case. Nevertheless the numbers quoted in Table 3 can be compared, at least relative to each other. We used TMC-1 as most molecules have been detected towards this source, and assume a total extinction of 30 magnitudes, a column density of N(H2) = cm-2 and a gas phase CO abundance relative to molecular hydrogen of . Depletion on ices is causing a deficit of gas phase carbon compared to the situation in diffuse clouds, as seen by the lower abundance of gas phase CO relative to H2. In addition to CO, gas phase carbon is locked in organic molecules with 3 or 4 carbon atoms in TMC-1 (cf Table 3). There is a clear decrease of the fraction of carbon tied in more complex molecules. It is likely that the available information on organic molecules with 5 or more carbon atoms is incomplete, since a lower number of molecules this size are detected, compared with smaller molecules. Other species might still remain to be identified. For example, pure carbon clusters are likely present in dark clouds, but could not been taken into account in the above statistic due to the lack of definite detections.
3.3 Chemistry and depletions
The widespread presence of molecular ices on dust grains in shielded regions is now well established. These ices contribute in modifying the grain optical properties and in favoring grain coagulation. In the Taurus cloud, water ice is seen for lines of sight with extinction larger than a threshold of AV mag, [*]Teixeira:99, while CO ice appears for larger AVs, near 6 magnitudes. It is therefore certain than many gas phase molecules, including carbon monoxide and water, are condensed on grain mantles in cloud interiors, though a few of them only have an solid phase abundance high enough to be detectable in the infrared (the typical limit is a few % of the water ice, or a few times 10-6 relative to hydrogen, [*]nummelin:01). The inventory of ices has been completed thanks to the ISO mission, both towards YSOs and towards background field stars. These lines of sight are particularly interesting for chemistry since they sample random lines of sight across clouds, which are likely representative of the bulk of shielded molecular gas. Both the total extinction and the chemical composition of the solid phase are fairly well known.
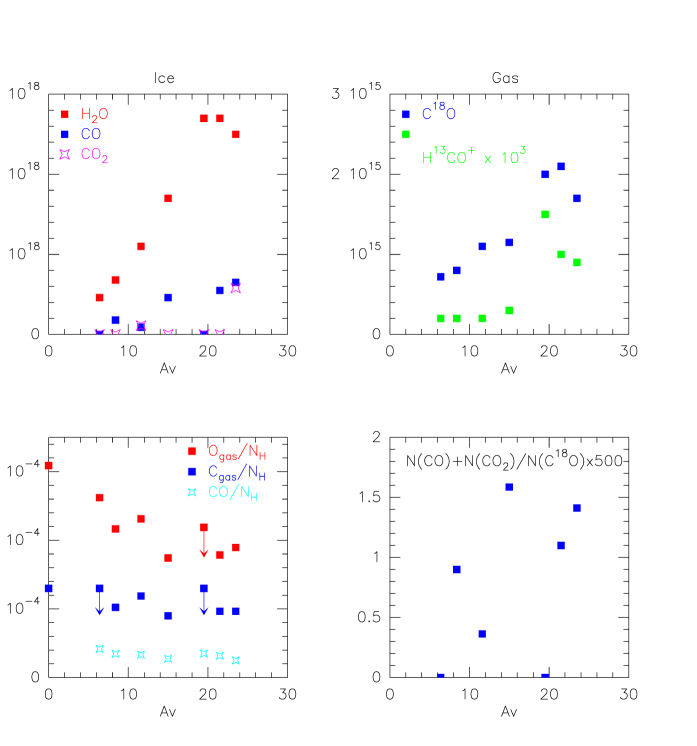
We have selected a sample of seven lines of sight in the Taurus molecular clouds – two of them being located in TMC-1 – to investigate the relationship between solid and gas phase chemical composition. We used the IRAM 30m telescope to perform the observations in December, 2000. Properties of the background sources are summarized in Table 4. Fig. 5 shows that, while CO isotopes are readily detected for all lines of sight with AV between 6 and 21 magnitudes, molecular ion lines are weak or absent for AV lower than 15 magnitudes. At this point, the amount of carbon in the solid phase (condensed as CO or CO2 ice) is larger than the amount of carbon in the gas phase (primarily as CO). Dense prestellar cores have similar C18O column densities as the lines of sight with the largest extinction in our sample, cm-2 for AV = 20 mag but larger column densities of molecular ions. Because the total extinction through these dense cores is very large, at least 50 mag or even more are derived from star counts in L134N ([\astroncitePagani2003]), it is expected that the remaining fraction of molecules in the gas phase is low. Indeed, indirect evidences of large depletions of molecules onto grains have been given based on comparisons with the the continuum emission from dust grains, star counts, and the spatial distribution of different molecules (see e.g. [\astroncitePagani2003]; [\astronciteBergin et al.2003]), in agreement with the moderate depletions reported here for lower extinctions. Note that because CO gets converted into CO2 and possibly other species on grains, the amount of carbon condensed on grains, hence the impact of molecular ices on the chemistry, is larger than what can be derived from the concentration of CO ice only. An inventory of the ice composition, including CO2 and possibly CH3OH, is necessary for determining the carbon and oxygen budget of the solid phase.
It is interesting to analyze the chemical differences in TMC-1 itself. Two lines of sight through TMC-1 belong to our sample, Tamura 8 in the ammonia rich region (North) and E 0484 in the carbon rich region (South) and have similar total extinction of mag and water ice column densities cm-2, while the gas phase abundances we observed follow the general trends in TMC-1 of larger column densities of molecular ions in the ammonia rich region compared to the carbon rich region. Since the formation of molecular ices in clouds is a rather slow process ([\astronciteRuffle and Herbst2000], [\astronciteRuffle and Herbst2001]), the presence of molecular ices everywhere in the Taurus cloud, with well defined dependence on total extinction but no dependence on the gas phase composition, is a strong argument against different ages for different regions. For most of the lines of sight, the abundance of water ice relative to molecular hydrogen (deduced from AV) is comparable or larger than , which means that a significant fraction of the available oxygen is condensed. Other processes such as those discussed below are more likely to contribute in producing the marked gas phase chemical differences. A deeper investigation of the selected lines of sight in TMC-1 may bring clues on the origin of the chemical differentiation since both the total gas column density and the composition of dust grains are known.
| Name | AV | H2O∗ | CO∗ | CO | CO |
|---|---|---|---|---|---|
| mag | |||||
| Elias 6 | 6.4 | 4.6 | … | … | 3.6 |
| Elias 3 | 8.4 | 6.8 | 1.8 | … | 4.0 |
| Elias 13 | 11.6 | 11 | 0.9 | 1.1 | 5.5 |
| Elias 15 | 15.0 | 17 | 4.6 | … | 5.8 |
| E 04384 | 19.5 | 27 | … | … | 10 |
| Tamura 8 | 21.5 | 27 | 5.5 | … | 10 |
| Elias 16 | 23.5 | 25 | 6.5 | 8.5 |
For sources listed in column (1), Column (2) gives the extincion, Column (3) the column density of water ice, Column (4) the column density of CO ice, Column (6) the column denisty of CO2 ice, and Column (6) the column density of gas phase CO deduced from C18O data (see text). All column densities are given in units of 1017 cm-2. Data from Teixeira and Emerson (1999), Nummelin et al. (2001) and Murakawa et al. (2000).
4 Discussion and Perspectives
In all interstellar environments, dark and diffuse clouds, and PDRs, carbon chains and cycles are closely related to each other, and to atomic carbon. They are present in large abundances in the moderately dense molecular gas but avoid the darkest and densest cores. This conclusion is valid for the pure carbon chains and cycles. Other carbon species, like cyanopolyynes are found in high density regions. Though their formation mechanism also involves carbon, the difference between nitrogen and carbon chemistry may contribute to the different spatial distribution. The difference of incident radiation between diffuse or UV illuminated gas on one side, and dark clouds on the other side, affects somewhat the relative abundance of carbon molecules in permitting the growth of larger chains (compare the abundance of C4H in TMC-1 and in the horsehead nebula) but the chemistry looks nevertheless very similar. Another major difference between diffuse or UV illuminated gas on one side, and dark clouds on the other side, is the condensation of abundant gas phase molecules on dust grains. The main impact of condensation on the chemistry is the enhanced abundance of molecular ions in depleted region. The reason for this is that the destruction channels for molecular ions are not only dissociative recombination reactions with electrons, but also reactions with abundant gas phase molecules. The depletion of CO on dust grains therefore leads to lower destruction rates for molecular ions and larger abundances. While the composition of molecular ice depends mainly on the total extinction, marked chemical differences are found in lines of sight with similar column densities. Also, measured abundances of carbon chains and cycles are often larger than steady state predictions. The usual explanation for understanding the large abundances, is to invoke the so-called ”early time chemistry”, in which clouds are seen in an early evolutionary stage since their formation, in which the available carbon, initially ionized, has not be completely transformed into CO. However, several arguments show that ”early time chemistry” cannot be the sole explanation. Early time chemistry is efficient because the formation of molecular hydrogen and the conversion of carbon to CO takes a very long time ( years) when starting from atomic gas. It is thus tempting to use molecular abundances in dark clouds as a chemical clock. However the same arguments leading to doubt on “early time ” chemistry, are also against this “‘chemical clock ” idea for dense cores.
i) Since the same molecules, with similar abundances, are seen in many different clouds, at different evolutionary stages, such as PDRs, pre-stellar clouds, clouds having already formed stars, how could we be viewing “early time” chemistry in all cases ? For example, clouds having already formed stars and clouds associated with PDRs cannot be presented as “young” since they have already had time to collapse and form stars, and for PDRs the newborn stars have had time to disrupt their parent clouds. Even if the evolution is not uniform across a cloud (chemical time scales depend on the density, so that more diffuse regions evolve at a slow pace compared to dense cores) the requirement of “early time”, i.e. a cloud age lower than 105 years is very strong compared to the typical time scale for cloud formation and evolution towards forming stars ( years, [\astronciteHartmann, Ballesteros-Paredes and Bergin2001]).
ii) A second argument against “early time” chemistry is the heavy dependence of the predicted chemical abundances on the initial conditions [*]Lee:96 while observations show well defined chemical properties.
iii) Finally, as stated above, molecular ices are commonly detected in dark clouds which indicate the gas has had time to evolve, and built gas phase and solid phase molecules ([\astronciteRoberts and Herbst2002]).
Other processes are known to strongly affect the chemistry, and may favor the presence of carbon and carbon chains in cloud envelopes. The propagation of UV radiation depends on the grain optical properties. [*]Casu:01 have shown that grain growth in dark clouds affects the grain optical properties hence the propagation of UV radiations and the photodissociation rates in dense gas. This effect leads to higher abundances of neutral and ionized carbon compared to models using the grain properties valid for diffuse gas. It must be remembered that photons play a very important role in interstellar chemistry, even in dark clouds since the interaction of cosmic rays with hydrogen leads to the production of UV photons deep into the clouds. In addition, the chemical equilibrium for moderately dense gas can be carbon rich, the HIP solution ([\astronciteLe Bourlot et al.1995]) even without any incident UV photons. These last two explanations rely on microscopic processes and choice of elemental abundances. But the structure and dynamical state of interstellar clouds also affects the chemistry. Clumpy cloud models, such as those of [*]spaans:97 or [*]storzer:96 can explain the widespread distribution of carbon by the accumulation of many clump surfaces, rich in carbon, in telescope beams. Since UV radiation can penetrate deeper into clumpy clouds than in homogeneous structures, each clump surface behaves as a mini-PDR in this context. Another idea is to include the effect of turbulence in homogeneous clouds. The main effect of turbulence is to increase the diffusion between the cloud surface and its interior. A small level of turbulent diffusion, compatible with the observations, can maintain higher abundances of atomic carbon and atomic hydrogen in cloud envelopes than in steady state models, in agreement with observations of atomic hydrogen in dark clouds ([\astronciteWillacy, Langer and Allen2002]).
It is likely that all additional physical mechanisms described above, both microscopic (change of optical properties of dust grains, abundances) and macroscopic (turbulence, chemistry) and possibly others still to uncover, contribute significantly to the chemistry. There are so many unknowns in the physical properties and chemistry of dark clouds, that deriving the age of clouds from their chemical abundances is not reliable. Clues from the age of embedded stars, if any, the geometry, the environment etc. must be used to retrace the history of interstellar structures. To progress, the whole evolution of interstellar clouds, from their formation in the warm neutral gas, to their concentration in molecular gas, and finally the birth of new stars, must be better understood than it is now.
Acknowledgements.
The authors thank J. Cernicharo for letting them use his radiative transfer code, D. Teyssier and A. Abergel for using their work on the horsehead nebula. The authors thank J. Pety for helping with the processing of IRAM plateau de Bure data.References
- [\astronciteAbergel et al.2003] Abergel A., Teyssier D., Bernard J.P. et al. 2003, A&A in press.
- [\astronciteBell, Feldman and Matthews1983] Bell M. P., Feldman P.A., Matthews H.E., 1983, ApJ 273, L35
- [\astronciteBell and Matthews1995] Bell M.P., Matthews H.E., 1995, ApJ 438, 223
- [\astronciteBell et al.1998] Bell M.B.,Feldman P.A., Watson J.K.G., Mc Carthy M.C., et al., 1998, ApJ 518, 740
- [\astronciteBergin et al.2003] Bergin E., This volume.
- [\astronciteCasu, Cecchi-Pestellini and Aiello2001] Casu S., Cecchi-Pestellini C., Aiello S., 2001, MNRAS 325, 826.
- [\astronciteCernicharo, Goicoechea and Caux2000] Cernicharo J., Goicoechea J.R., Caux E., 2000, ApJ 534, L199
- [\astronciteCernicharo, Goicoechea and Bénilan2002] Cernicharo J., Goicoechea J.R., Bénilan Y., 2002, ApJ Letter in press
- [\astronciteCox, Walmsley and Güsten1989] Cox P., Walmsley C.M., Güsten R., 1989, A&A 209, 382
- [\astronciteDickens et al.2000] Dickens J.E., Irvine W.M., Snell R.L., Bergin E.A., Schloerb F.P., Pratap P., Miralles M.P. 2000, ApJ 542, 870.
- [\astronciteDickens et al.2001] Dickens J.E., Langer W.D., Velusamy T., 2001, ApJ 558, 693.
- [\astronciteFederman et al.1994] Federman S.R., Strom C.J., Lambert D.L., Cardelli J.A., Smith V.V., Joseph C.L., 1994, ApJ 420, 756
- [\astronciteFossé et al. 2001] Fossé D., Cernicharo J., Gerin M., Cox P., 2001, ApJ 552, 168
- [\astronciteFossé2003] Fossé D., 2003,PhD Thesis
- [\astronciteHartmann, Ballesteros-Paredes and Bergin2001] Hartmann L., Ballesteros-Paredes J., Bergin E.A., 2001, ApJ 562, 852.
- [\astronciteHabing1968] Habing H.J., 1968,BAN 19, 421
- [\astronciteHerbig1995] Herbig G.H., 1995, ARAA 33, 19
- [\astronciteGiesen et al.2001] Giesen T.F., Van Orden A.O., Cruzan J.D., 2001, ApJ 551, L181
- [\astronciteHoude et al.2003] Houde M., et al. 2003, This volume
- [\astronciteJansen, Van Dishoeck and Black1994] Jansen D.J., van Dishoeck E.F., Black J.H., 1994, A&A 282, 605
- [\astronciteJansen et al.1996] Jansen D., van Dishoeck E.F., Keene J., Boreiko R.T., Betz A.L., 1995, A&A 309, 899 and315, 327
- [\astronciteLe Bourlot et al.1993] Le Bourlot J., Pineau des Forêts G., Roueff E., Flower D.R., 1993, A&A 267, 233
- [\astronciteLe Bourlot et al.1995] Le Bourlot J., Pineau des Forêts G., Roueff E., Flower D.R., 1995, A&A 302, 870
- [\astronciteLee et al.1996] Lee H.H., Herbst E.,Pineau des Forêts G., Roueff E., Le Bourlot J., 1996, A&A 311, 690
- [\astronciteLe Teuff, Millar and Markwick2000] Le Teuff Y.H., Millar T.J., Markwick A.J., 2000, A&A suppl. 146, 157
- [\astronciteLucas and Liszt2000] Lucas R., Liszt H.S., 2000,A&A 358, 1069
- [\astronciteMaezawa et al.1999] Maezawa H.,Ikeda M., Ito T., Saito G., Sekimoto Y., et al., 1999, ApJ 524, L129.
- [\astronciteMaier etal.2001] Maier J.P.,Lakin N.M., Walker G.A.H., Bohlender D.A., 2001, ApJ 553, 267
- [\astronciteMaier, Walker and Bohlender 2002] Maier J.P., Walker G.A.H.,Bohlender D., 2002, ApJ 566, 332
- [\astronciteMurakawa, Tamura and Nagata2000] Murakawa K., Tamura M., Nagata T., 2000, ApJ suppl. 128, 603.
- [\astronciteNummelin et al.2001] Nummelin A., Whittet D. C. B., Gibb E. L., Gerakines P. A., Chiar J. E., 2001, ApJ 558, 185
- [\astroncitePagani2003] Pagani, L. ,2003, This volume.
- [\astroncitePratap et al.1997] Pratap P., Dickens J.E., Snell R.L., Miralles M.P., Bergin E.A., Irvine W.M., Schoerb F.P., 1997, ApJ 486, 862
- [\astronciteRachford et al.2002] Rachford B.L., Snow T.P.,Tumlison J. et al., 2002, ApJ 577, 221
- [\astronciteRoberts and Herbst2002] Roberts H., Herbst E., 2002, A&A 395, 233.
- [\astronciteRoueff et al.2002] Roueff E.,Felenbok P., Black J.H., Gry C., 2002, A&A 384, 629
- [\astronciteRuffle and Herbst2001] Ruffle D.,Herbst E.,2001, MNRAS 324, 1054
- [\astronciteRuffle and Herbst2000] Ruffle D.,Herbst E.,2000, MNRAS 319, 837
- [\astronciteSchilke et al.1995] Schilke P.,Keene J., Le Bourlot J., Pineau des Forêts G., Roueff E., 1995, A&A 294, L17
- [\astronciteShuping et al.1999] Shuping R.Y.,Snow T.P., Crutcher R., Lutz B.L., 1999, ApJ 520, 149
- [\astronciteSpaans and van Dishoeck1997] Spaans M., van Dishoeck E., 1997, A&A 323, 953.
- [\astronciteStörzer, Stutzki and Sternberg 1996] Störzer H., Stutzki J., Sternberg A., 1996, A&A 310, 592.
- [\astronciteTatematsu et al.1999] Tatematsu K., Jaffe D.T., PLume R., Evans N.J., Keene J., 1999, ApJ 526, 295
- [\astronciteTeixeira and Emerson1999] Teixeira, T. C.; Emerson, J. P., 1999, A&A 351, 292
- [\astronciteTerzevia and Herbst1998] Terzevia R., Herbst,E., 1998, ApJ 501, 207
- [\astronciteTeyssier et al.2003] Teyssier D., Fossé D., Gerin M., Pety J., Abergel A., Habart E., 2003,This volume
- [\astronciteTurner,Herbst and Terzevia2000] Turner B.E., Herbst E., Terzevia R., 2000, ApJ suppl. 126, 427
- [\astronciteWillacy, Langer and Allen2002] Willacy K., Langer W.D., Allen M., 2002, ApJ 573, L119