Microlensing induced absorption line variability
Abstract
Gravitational microlensing has proven to be a powerful probe of both the structure at the heart of quasars and the mass function of compact objects in foreground lenses. This paper examines the potential of gravitational microlensing in probing the scale of structure in absorbing material within the lensing galaxy. We find that, in this high optical depth regime, significant variations in the equivalent width of absorption features can be induced, although the details of these are dependent upon the scale of structure of the absorbing material. The paper concludes with an examination of the absorption line variability observed in the gravitationally lensed quasar PKS1830-211, demonstrating how this may indicate the presence of small scale structure in the cold molecular gas present within the lensing galaxy.
keywords:
gravitational lensing – line: profiles – quasars: individual: PKS1830-2111 Introduction
With the advent of dedicated monitoring programs, gravitational microlensing of quasars has provided some of the strictest limits on the scale of the central accretion disk (e.g. Wyithe, Agol & Fluke 2002) and extended emission line material (Lewis, Irwin, Hewett & Foltz 1998). As well as imaging the source, microlensing also probes the nature of the lensing galaxy, with the statistics of microlensing variability constraining the mass function of the microlensing masses in the intervening system (Wyithe et al. 2000; Wyithe & Turner 2001).
In this paper we demonstrate how microlensing provides a further probe of the distribution of material within a lensing galaxy. Rather than focusing upon the point-like microlensing masses, we examine the influence of material responsible for producing absorption signatures in the spectrum of the more distant quasar. This absorption signature is time dependent, as relative movement of the microlenses results in differing microimage brightnesses.
In Section 2 we outline the general approach, with an extension into the high optical depth microlensing regime in Section 2.1. Sections 3 and 4 describe the cloud distributions employed in this study and the magnification maps from which the results are taken. Section 5 examines whether the radio spectral variability observed in the lensed radio quasar PKS 1830-211 is consistent with the hypothesis presented in this paper, while the conclusions to this study are presented in Section 6.
2 Microlensing through variable absorption
The most dramatic influence of a microlens as is crosses the line-of-sight to a distant source in the resultant variation in the apparent brightness of that source. Such variability has been seen for not only microlenses within our own Galaxy (Alcock et al. 1993), but also in microlensing of distant quasars (Irwin et al. 1989; Corrigan et al. 1991).
If galaxies were comprised solely of smoothly distributed matter then gravitationally lensed images would be just single distorted versions of the source. Due to the granularity of matter, distributed on the small scale in compact objects such as stars, a closer examination of gravitationally lensed images would reveal them to be comprised of a myriad of microimages. These are distributed on scales smaller than current imaging resolution and only a single composite macro image is observed. These images possess a distribution of brightnesses which is dependent upon the relative positions of the microlensing masses and the projected position of the source. The brightness weighted mean position of the resulting light distribution will not necessarily lie at the position of the macroimage in the smooth matter lens. Hence, as microlensing is a temporal phenomenon, the movement of a microlensing mass produces a time varying astrometric offset. For microlensing events in the Galactic halo (Paczynski 1998), the astrometric shifts are of the order of several milliarcseconds and will be readily detectable with the launch of space-based interferometers such as SIM (http://sim.jpl.nasa.gov/).

Typically it is assumed that the various light paths pass through empty space, or through a smooth matter component that does not absorb the light. As well as stars, galaxies contain continuously distributed material, namely gas and dust. This material is clumped on a range of scales, with indications that the interstellar medium exhibits fractal structure (Elmegreen 1997). Figure 1 presents a (very) schematic example of microlensing through inhomogeneous absorption material; the dashed line depicts the path of light from the source to an observer in the absence of a microlensing mass. In this example, this path does not impinge upon any absorbing material and the spectrum of the source does not possess any absorption feature, as represented by the dashed line in the inset spectrum. With a microlensing mass close to the line-of-sight, however, the light from the source follows one of two paths from the source to the observer. With this example, one of these paths passes though a cloud of absorbing material, resulting in an absorption imprint. As the individual microimages are unresolved, the resultant spectrum will be the sum of the light from the two paths, one of which possesses an absorption trough; this is illustrated as the solid line in the inset spectrum. As microlensing is a temporal phenomenon, the spectrum of the source will begin unabsorbed. As the microlensing mass passes through the line-of-sight, the absorption will be seen to appear and change, until finally the microlensing mass moves away from the line-of-sight and the spectrum returns to its unabsorbed state.
Seen at cosmological distances, however, microlensing by individual stars is unlikely to show such an effect. This can be seen when considering the physical separation of the rays of light through the lens. When there is a good alignment between the source and lens, the resulting images undergo a similar magnification and are separated by roughly twice the Einstein Radius, hence
| (1) |
where are the angular diameter distances between the observer , lens and source . For solar mass objects at cosmological distances, this is of order parsecs, and hence inhomogeneities in the absorbing material would have to occur on scales substantially smaller than this to influence the individual light paths and hence modify the absorption line profile.

2.1 High optical depth microlensing
The light from macro imaged quasars shines through relatively dense regions of the lensing galaxy where the optical depth to microlensing is of order unity. In this regime, many stars influence the light from the quasar and the resulting lensing is correspondingly more complex than that seen for an isolated mass. The details of these are described in several recent reviews and will not be reproduced here (e.g. Wambsganss 2001).
At such high optical depths, the observed macroimage is actually composed of an unresolved myriad of microimages. The relative brightnesses of these images change as the microlensing stars change their position in front of the source. Recently, Lewis & Ibata (1998) examined the astrometric shift in the macroimage as a result of the changing microimage configuration, finding appreciable shifts of milliarcseconds; such shifts will be readily observable with the next generation of space-based interferometers.
The numerical approach of Lewis & Ibata (1998) was to image the quasar source as it shines through an ensemble of microlensing masses; from this the brightness weighted macroimage centroid can be simply calculated. It is, however, quite straightforward to extend this approach to consider the influence of a distribution of observing material amongst the lensing masses; such an approach was adopted here.
In summary, the numerical routine was based on the ray tracing procedure which has been the work horse in the study of gravitational microlensing (e.g. Kayser, Refsdal & Stabell 1986), in which a large number of rays are fired through a population of lensing masses. Considering where each ray intercepts the source plane, a microlensing magnification map can be derived and the statistics of microlensing induced variability inferred (e.g. Wambsganss 1992). For the purposes of this study, absorbing material is added between the microlensing masses, attenuating the rays as they pass through the lensing galaxy. The presence of absorbing material will influence the form of the magnification map, as regions will receive less rays than they would without it. Hence, a comparison between the ‘raw’ magnification map, with no absorbing material, and that in the presence of the attenuating screen, gives the relative strength of the absorption line to the continuum. It is assumed that the clouds are effectively massless, not contributing to any additional gravitational microlensing convergence (Wambsganss 1992; Lewis & Irwin 1995; Schechter & Wambsganss 2002).

The complex patterns seen in gravitational microlensing magnification maps depend strongly on the surface density of microlensing objects (the optical depth ) and the large scale shear over the star field (the shear ). Furthermore, for a particular macrolens and source, where the physical scales are fixed, varying the mass function of the microlensing masses also changes the patterns of the magnfication maps (Kayser, Refsdal & Stabell 1986; Wambsganss 1992). Hence, the potential parameter space available for study is considerable. For this study, a fiducial microlensing parameters of and were employed, considering a source region which is 20 Einstein radii in extent. The corresponding star field is scattered over a region of radius Einstein radii in the lens plane.
3 Absorption Cloud Distribution
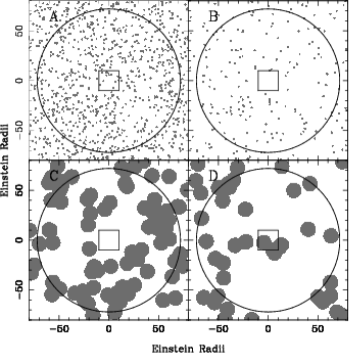
Absorption clouds can be distributed in a multitude of ways, with varying shapes and sizes and absorption profiles etc. and hence the potential parameter space to be explored is immense. Such an exploration is beyond this current contribution, and so, for the purposes of this study, the absorption clouds are simply represented as being circular with uniform absorption. Two fiducial cloud sizes were considered, the larger possessing a radius of 8 Einstein radii (ER), the smaller clouds being Einstein radii. Two densities of each cloud distribution were also considered. Model A possesses small clouds scattered with a density of 391 clouds per 100 square Einstein radii, model B also has small clouds, but scattered with a density of 40 clouds per 100 square Einstein radii. Model C utilises large clouds, with a density of 31 clouds per 100 Einstein radii and model D again uses large clouds with a density half that of model C. Figure 2 presents examples of the four cloud distributions employed in this study; the grey-scale represents the distribution of the absorbing material, whereas the points are the positions of the stars. Furthermore, the clouds were considered to be either completely opaque, absorbing all photons (absorption model A) or producing 50% absorption (absorption model B).
Studies of the interstellar medium reveal that clouds are distributed fractally, possessing structure on a range of scales (Elmegreen 1997). When sources possess a fractal distribution it is found that the scales of structure are imprinted on the light curve as the source is microlensed (Lewis 2002). While it is expected that any fractal structure in the absorbing clouds will result in similar imprinting of a scale of structure on the microlensing light curve, the calculations required go beyond this study and are deferred for further work.
4 Magnification Maps
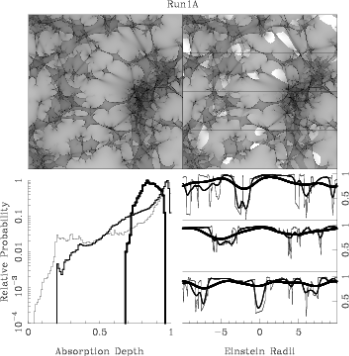
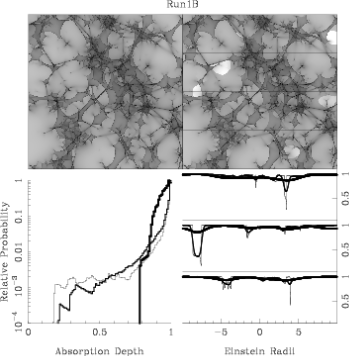
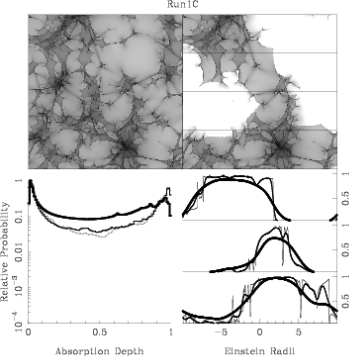
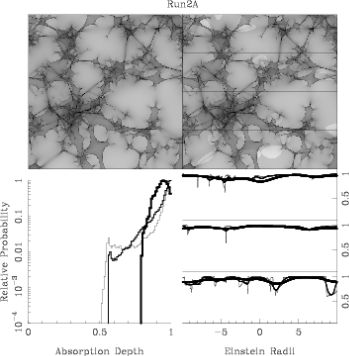
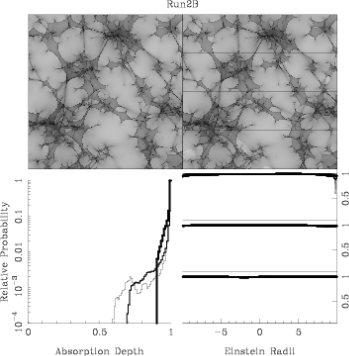
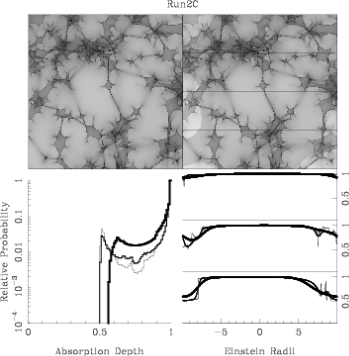
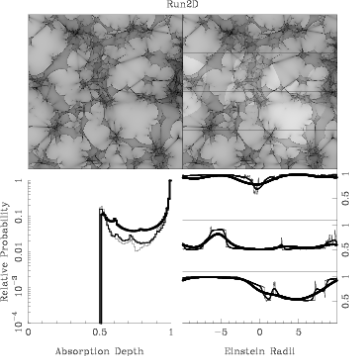
Figures 4 to 11 present the results of the numerical simulations detailed in the previous sections. The left hand upper panel presents the microlensing magnification map without considering the influence of absorbing material, with dark areas corresponding to regions of magnification, while the light areas represent regions of demagnification; the sharp boundaries corresponding to caustics in the map are clearly visible. The upper-right hand panel again presents a magnification map, but in this case any rays which impinge on absorbing clouds as they pass through the microlensing screen are appropriately denuded. With this, the upper-left hand panel can be seen to be the magnification of continuum emission, while that in the upper-right hand panel is that in the absorption line. The relative depth of the emission line seen at any particular instant is the ratio of these two maps. This can be simply seen if one considers a large screen of absorption that uniformly and completely covers the microlensing star field. Hence, the magnification map in the absorption line would uniformly possess values that are a fixed fraction of those in the continuum map, such that the ratio of the two would be a constant and would demonstrate that, in this case, that there would be no absorption line variability.
The lower-right hand panel presents several cuts across the magnification map with the absorption. There are three paths (indicated by the lines across the upper-right hand panel). The absorption depth indicates how deep a line would cut into a normalised continuum; a value of one indicated no absorption of the continuum, whereas 0 indicates complete extinction in the line. Three Gaussian source sizes were considered: 0.02, 0.2 and 1 Einstein radii. In the figures, the lightest lines correspond to the smallest source, whereas the darkest lines are the largest.
Finally, the lower-left hand panel presents a relative measure of the probability of a particular absorption occurring (normalised to the peak probability). Again, the lightest line in this panel corresponds to the smallest source, and the darkest line is that for the largest source.
Neglecting the influence of gravitational microlensing, what would be expected if the cloud distributions described in Section 3 drifted across a source? If the source is smaller than the size of the clouds, then either source will appear unabsorbed or completely covered by an absorbing cloud. If we assume that the absorbing material drifts across the sky with a velocity V, then the typical time scale that the source lies behind an absorbing cloud is . While completely behind a cloud, however, a source will not display any absorption line variability, and so another important time scale is the time taken for a cloud to pass from being unabsorbed to completely absorbed; for a source smaller than the absorbing cloud. A more detail discussion of the temporal properties of the light curve appears later in this section.
The effects of microlensing can be seen when considering the top two panels of each of the simulation outputs. When comparing the left-hand panel (the magnification map without absorption) and the right-hand panel (the same map but including the presence of the absorbing material), it is clear that the presence of the absorbing material denudes regions of the magnification map. Due to the gravitational lensing distortion, these regions are are not circular, like the absorbing clouds, but rather are distorted. For the simulations where large, opaque clouds are considered (C & D), this results in large sections of the magnification map being essentially zero (Figures 6 & 7). When the opacity of the clouds is 50%, the effect is less severe.
Examining Figures 4 to 11, several features of the absorption line variability are apparent. Even with the limited range of absorption cloud distributions presented in this paper, it is clear that quite complex variability in the strength of an absorption line results. As with the strength of microlensing induced magnification, the degree of variability is seen to be strongly dependent upon the angular size of the source, with small sources displaying the most most dramatic and rapid variability. The variability strongly reflects the size of the clouds with the larger clouds leaving a longer imprint on the absorption line light curve. For virtually all the scenarios considered, the source size was substantially smaller than the absorbing cloud (the exception being the largest source in models A & B, where the source is comparable to the size of the clouds). Hence, if the influence of microlensing is neglected, a source would therefore find itself unobscured by absorption material or completely behind a cloud, with a small transition region. This would lead to an essentially binary distribution when considering the absorption depth probabilities, with a peak at one and another at the absorption strength of the clouds (zero for model 1 and 0.5 for model 2). Figure 3 presents the relative probability for a particular absorption depth occurring in this non-microlensed case, clearly revealing the strong binary nature of the expected absorption depths. As revealed in Figures 4 to 11, there is a significant probability in all cases to get absorption depths in between the two extremes, with quite different distributions to the non-microlensing case. In the non-microlensing case, absorption depths at levels between the two potential extremes can only occur if the source lies partly behind an absorbing cloud. With microlensing, however, this is further augmented by the fact that the observed macroimage is composite and consists of many microimages. Unless all these microimages suffer absorption then the observed depth of the absorption line will be less than a single source viewed through a cloud.
In further addressing the influence of microlensing, it is instructive to examine the cloud distributions in Figure 2; the squares in the centre of each plot represent the source region over which the magnification map is calculated. Hence, paths across this square at the same location as those in Figures 8 to 11 (only model 2 is considered as they employ the specific cloud distributions in Figure 2) represent the same light curve durations as those presented in the microlensed case. Firstly, it is apparent that in the absence of microlensing, Run2B and Run2C should exhibit no absorption line variability as they possess no clouds within the central box. When considering the influence of microlensing, Run2B does appear to show little variability, but significant changes do occur (as revealed by the absorption depth probability distribution). Run2C, however, shows more significant variability, with the gravitational microlensing effect ‘folding’ the absorption information into the inner square. An examination of the cloud distribution of Run2D suggests that, in the absence of microlensing, the uppermost path in Figure 11 should be unobscured, while the lower path should be completely obscured. This is quite different to the behaviour when microlensing is considered, with the light curves displaying more complex variability.
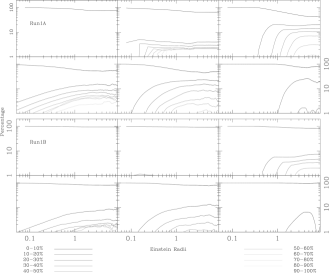
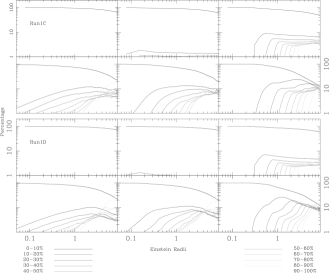
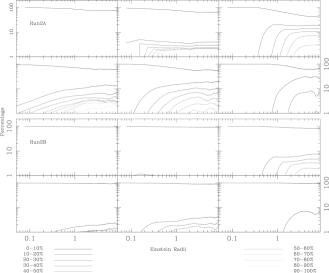
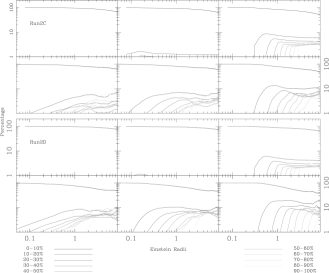
In further examining the temporal properties of light curves with and without microlensing, a study was made of the expected change in the absorption depth as a function of time; as routine spectroscopic monitoring of lensed systems is not currently undertaken, any observations are likely to be randomly spaced in time. For this, this study considers the statistics of two measurements of the absorption line depth as a function of their separation in Einstein radii; this separation can be converted to time by considering the relative velocities of the source and lens. The results of this study are presented in Figures 12,13, 14 and 15; for each model (labeled at the far left) consists of six panels. The upper three panels present the statistics for the non-microlensing cases, the lower three panels are for the microlensing case. In each set of three, the left-to-right subpanels are for the smallest to largest source. The x-axis present the separation in Einstein radii; as the typical crossing time of an Einstein radius of a cosmological source is of order decades, a small range in Einstein radius was considered. The y-axis presents the percentage of observations with this separation displaying variation within a particular range, denoted by the greyscale key at the bottom of the plot; note that both axes are logarithmic. The percentage changes are in terms of the maximal possible change, which is unity for models Run1, and 0.5 for models Run2.
Examining Figure 12 reveals that the temporal behaviour is complex. Comparing firstly the smallest sources in each model, it is clear that observations at small separations in the non-microlensing case are dominated by the smallest changes in absorption. Within increasing separation, however, the largest absorption change grows in importance, reflecting the binary nature of the probability curves presented in Figure 3. Examining the same panels for the microlensed case we see that absorption line variability is more likely to be seen at small separation (except model Run2B), although the differences are smaller than the maximum; hence, for the smallest source, more rapid variability will be apparent in the light curves of microlensed systems, although at a value less than the maximum. Considering the middle source size, the situation is more complex. Again, the shortest time scales are dominated by there being essentially no change in the observed absorption line depth in both cases. For the non-microlensed case, however, the several models display more significant variability into the shortest time scales. With microlensing of the middle source size, it is apparent that significant variation at the very shortest time scales is unlikely, although the probability of observing more significant changes is enhanced over the non-microlensing case. The situation for the largest source size is more complex, with all of the non-microlensing models displaying similar shapes (although different normalization) for the various distribution. With microlensing, however, the models present differing distributions. Examining the distributions presented in Figure 4 through 11 it is clear that due to the very smooth nature of the light curve for the largest source, with no rapid variability occurring on short time scales. While, from the figure, longer time scale variability is apparent for such sources, on the shorter time scale important to observational programs, significant variation will not be seen for large sources. Hence, we can conclude that for the smaller sources, microlensing leads to an enhancement in the possibility of observing a change in observations at different epochs.
Is there a correlation between the expected microlensing induced fluctuations of the continuum and the expected variability in the depth of the absorption lines? When examining the magnification maps in the various figures, it is apparent that the value of the magnification at a particular location is actually the sum of rays that have traversed differing regions of the lens plane. With the presence of absorbing material, however, some rays being collected in the source plane will be attenuated. A closer examination of the magnification maps reveals that some caustic structures can lie over regions which have been strongly absorbed. Hence, we would expect some correlation between the continuum variability and the observed variations in the absorption depth. This can be seen in Figure 16 which presents the light curves and absorption variability for the lower path across the magnification map in Figure 4. The top panel presents the light curve (darker line) and absorption variability (lighter line) for the smallest source considered, whereas the lower panel presents the same for the largest source. It is clear that, for the smallest source, that some changes in the observed absorption correlated strongly with changes in the continuum brightness (e.g. rapid change in both at +1Einstein radii), but other dramatic changes in either the light curve or absorption strength occur unaccompanied. A similar trend is seen in the larger source (middle panel), but in the largest source considered, much of the structure is washed out and no strong correlations occur.
This paper has considered the simple situation of comparing continuum flux with that at the centre of an absorption line, with the absorption line profile simply scaling with this central depth. The true situation could be more complex, as the absorbing clouds are likely to possess a range of velocities. Hence, the cloud distributions presented in Figure 3 would represent the view at a specific wavelength, whereas other wavelengths may present a different cloud distribution. Hence, as well as the overall strength of the absorption line changing due to the influence of gravitational microlensing, the form of the line profile will also be time dependent (e.g. Lewis & Belle 1998).
5 PKS 1830-211
Jauncy et al (1991) resolved the double radio source PKS 1830-211 into a ring-like structure, uncovering its gravitational lens nature. Wilkind & Combes (1996) identified absorption due to five different molecular species, revealing the lens to be at a redshift of z=0.89, whereas the quasar source was found to be at a redshift of z=2.51 (Lidman et al. 1998). Several approaches have successfully modelled the gravitational lensing potential (Kochanek & Narayan 1992; Nair, Narashimha & Rao 1993). Recently, Winn et al. (2002) and Courbin et al. (2002) 111It should be noted that these two papers have differing interpretations of the same data, leading to different gravitational lens models. identified the lensing galaxy in PKS 1830-211, a face-on spiral, in deep HST imaging; this naturally explains the large quantities of molecular gas seen in PKS 1830-211 as the images are observed through the spiral arms of the lensing galaxy.
As the quasar images of PKS 1830-211 are seen through the disk of a spiral galaxy suggests that our view of this system may be further distorted by the influence of gravitational microlensing as stars stream across the image of the quasar. Lovell et al. (1998) presented the results of monitoring campaign of PKS 1830-211 at 8.6GHz, from which the time delay between the images was determined to be days. It is clear, however, that there are no strong differences between the image light curves that would suggest the influence of gravitational microlensing. Oshima et al. (2001), however, noted that the relative image brightnesses in PKS 1830-211, as observed with ASCA (Advanced Satellite for Cosmology and Astrophysics), were markedly different to those determined from radio observations, leading them to conclude that microlensing was playing a role in the observed properties of this system. While it appears that the emission at 8.6GHz comes from too large a region to be significantly enhanced by microlensing (see Wambsganss 1992; however Koopmans & de Bruyn 2000 identified microlensing at 8.5GHz in CLASS B1600+434), Garrett et al. (1997) noted structural changes, on scales of milliarcsec, in 15GHz and 43GHz maps taken at several epochs. Garrett et al. (1997) suggested that these variations were due to millilensing by masses of . Interestingly, Jin et al. (1999) observed PKS 1830-211 with the VLBA at 43GHz over eight epochs, finding that the centroids of the core emission varied significantly (80 microarcseconds over a period of 2 weeks). Similarly, a comparison to archival 43GHz data from one year earlier revealed that the core separation had changed by 280microarcseconds.
Wiklind & Combes (1998) presented new observations of the molecular absorption lines associated with the lens at . These reveal that the gravitationally lensed images lie behind distinct absorption clouds separated by km/s. When comparing to previous observations, Wiklind & Combes (1998) discovered that the profile of the line changed over a month time scale; while these changes are relatively small, they are significant.
Is the change of centroid position in PKS 1830-211 consistent with it undergoing microlensing at radio wavelengths, and if so, is this responsible for the observed absorption line variability? The Solar mass Einstein radius in the source plane for PKS 1830-211 is pc222The values have a weak cosmological dependence., and sources must be smaller than this if they are to be significantly enhanced. This corresponds to an angular scale of microarcseconds. In their study of the quadruple lens Q2237+0305, Lewis & Ibata (1998) found that image shifts of 20-30 Einstein radii can occur on time scales substantially shorter than the crossing time of an Einstein radius. For PKS 1830-211 this crossing time is yrs, and the subsequent caustic crossing time will be of order weeks to months. Hence, it is expected that the separation between the images in PKS 1830-211 will change by microarcseconds on this time scale. It should be noted, however, that the degree of the expected astrometric shifts are a function of several parameters, especially the macrolensing shear. Given the ring-like nature of PKS 1830-211 (Jauncy et al. 1991), this may be substantial in the vicinity of the images of the quasar core, potentially accounting for the large scale shifts observed by Garrett et al. (1997). More detailed simulations, undertaken using the macrolensing parameters for PKS 1830-211, are required before this can be fully addressed.
If the observed line profile variability in PKS 1830-211 is due to microlensing, then the clouds must be of parsec/subparsec scales. Rather than reflecting individual clouds, however, these may represent inhomogeneities in a larger scale absorption distribution, which could, potentially, be fractal (Elmegreen 1997). It is apparent that PKS 1830-211 is subject to gravitational microlensing to some degree, although the evidence is currently only suggestive that the observed line profile differences are due to the absorption mechanism outlined in this paper. Hence, further spectroscopic monitoring of the radio absorption lines, as performed by Wiklind & Combes (1998), is required. Coupled with detailed numerical simulations, such monitoring may provide clues to the distribution of absorbing material in galaxies on subparsec scales.
6 Conclusions
Employing a numerical approach, this paper has investigated the influence of a combination of microlensing and a distribution of absorbing material within the lensing galaxy upon temporal changes in the depth of absorption lines in quasar spectra. It is found that the action of macrolensing compresses the large scale absorption cloud information into smaller region, as seen by the source, whereas the microlensing ‘folds’ the absorption patten. Several clouds distributions were examined, and significant modulation of the depth of the absorption line resulted. The form of the absorption line variability differed significantly from the simple case where the light from the quasar shone solely through an absorbing medium with no additional influence from gravitational lensing. Hence, such variability could influence systems suffering gravitational microlensing. Due to the small size of the Einstein radius of stellar mass objects at cosmological distances, however, only sub-parsec scale variations in absorbing material will result in an observable effect.
The gravitationally lensed quasar, PKS 1830-211, possess several temporal features that are consistent with it undergoing gravitational microlensing. Furthermore, PKS 1830-211 possesses a number of prominent molecular absorption lines visible at radio wavelengths. In one of these, , small, but significant variations in the absorption line profile over a period of six months have been reported. The analysis presented in this paper suggests that these changes may be due to the influence of gravitational microlensing. It is important to note, however, that currently very little is known about the scale of structure of absorbing material within external galaxies and hence the identification of any line variability as being due to microlensing may be problematic. While this paper has demonstrated that microlensing induced absorption line variability is not perferctly correlated with the variability of the brightness of the macrolensed images, some correlation does exist. Hence, long term photo-spectral monitoring at high resolution of potential systems, such as PKS 1830-211, is required before such a conclusion is confirmed.

Acknowledgements
GFL gratefully acknowledges discussions with Joachim Wambsganss and Rachel Webster on aspects of microlensing. Joachim Wambsganss is also thanked for providing his microlens code on which this study is based. We also thank Terry Bridges for allowing us to hammer odin, the computer on which these simulations were undertaken. The referee, Stuart Wyithe, is thanked for comment which improved this contribution.
References
- [Alcock et al. 1993] Alcock C., Akerloff C. W., Allsman R. A., et al., 1993, Nature, 365, 621
- [Corrigan et al. 1991] Corrigan R. T., Irwin M. J., Arnaud J., et al., 1991, AJ, 102, 34
- [Courbin et al. 1998] Courbin F., Lidman C., Frye B. L., Magain P., Broadhurst T. J., Pahre M. A., Djorgovski S. G., 1998, ApJ, 499, L119
- [Elmegreen 1997] Elmegreen B. G., 1997, ApJ, 477, 196.
- [Frye et al. 1997] Frye B., Welch W. J., Broadhurst T., 1997, ApJ, 478, L25
- [Garrett et al. 1997] Garrett M. A., Nair S., Porcas R. W., Patnaik A. R., 1997, Vistas in Astronomy, 41, 281
- [Gerin et al. 1997] Gerin M., Phillips T. G., Benford D. J., Young K. H., Menten K. M., Frye B., 1997, ApJ, 488, L31
- [Irwin et al. 1989] Irwin M. J., Webster R. L., Hewett P. C., Corrigan R. T., Jedrzejewski R. I., 1989, AJ, 98, 1989
- [Jin et al. 1999] Jin C., Garrett M. A., Nair S., Porcas R. W., Patnaik A. R., 1999, New Astronomy Review, 43, 767
- [Kayser et al. 1986] Kayser R., Refsdal S., Stabell R., 1986, A&A, 166, 36.
- [Kochanek & Narayan 1992] Kochanek C. S., Narayan R., 1992, ApJ, 401, 461
- [Koopmans & de Bruyn 2000] Koopmans L. V. E., de Bruyn A. G., 2000, A&A, 358, 793
- [332re] Lewis, G. F., 2002, MNRAS, Submitted
- [Lewis & Belle 1998] Lewis G. F., Belle K. E., 1998, MNRAS, 297, 69
- [Lewis & Ibata 1998] Lewis G. F., Ibata R. A., 1998, ApJ, 501, 478
- [Lewis et al. 1998] Lewis G. F., Irwin M. J., 1998, MNRAS, 276, 103
- [Lewis et al. 1998] Lewis G. F., Irwin M. J., Hewett P. C., Foltz C. B., 1998, MNRAS, 295, 573
- [Lidman et al. 1999] Lidman C., Courbin F., Meylan G., Broadhurst T., Frye B., Welch W. J. W., 1999, ApJ, 514, L57
- [Lovell et al. 1996] Lovell J. E. J., Reynolds J. E., Jauncey D. L., et al., 1996, ApJ, 472, L5
- [Lovell et al. 1998] Lovell J. E. J., Jauncey D. L., Reynolds J. E., Wieringa M. H., King E. A., Tzioumis A. K., McCulloch P. M., Edwards P. G., 1998, ApJ, 508, L51
- [Nair et al. 1993] Nair S., Narasimha D., Rao A. P., 1993, ApJ, 407, 46
- [Oshima et al. 2001] Oshima T., Mitsuda K., Ota N., Yonehara A., Hattori M., Mihara T., Sekimoto Y., 2001, ApJ, 551, 929
- [Paczynski 1998] Paczynski B., 1998, ApJ, 494, L23
- [Schneider et al. 1992] Schneider P., Ehlers J. ;., Falco E. E., 1992, Gravitational Lenses, XIV, Springer-Verlag Berlin Heidelberg New York.
- [sdsdssd] Schecter, P. L., Wambsganss, J., 2002, astro-ph/0204425
- [Swift et al. 2001] Swift J. J., Welch W. J., Frye B. L., 2001, ApJ, 549, L29
- [Wambsganss(1992)] Wambsganss, J. 1992, ApJ, 392, 424
- [Wambsganss(2001)] Wambsganss, J. 2001, PASA, 18, 207
- [Wiklind & Combes 1996] Wiklind T., Combes F., 1996, Nature, 379, 139
- [Wiklind & Combes 1998] Wiklind T., Combes F., 1998, ApJ, 500, 129
- [winwinwin] Winn, J. N., Kochenek, C. S., McLeod, B. A., Falco, E. E., Impey, C. D., Rix, H.-W. 2002, astro-ph/0201551
- [ssdsdsd] Wyithe J. S. B., Agol E., Fluke C. J. 2002, astro-ph/011281
- [Wyithe & Turner 2001] Wyithe J. S. B., Turner E. L., 2001, MNRAS, 320, 21
- [Wyithe et al. 2000] Wyithe J. S. B., Webster R. L., Turner E. L., 2000, MNRAS, 315, 51