The Shroud Around the Twin Radio Jets in NGC 1052
We discuss multiple Very Long Baseline Interferometry (VLBI) continuum and spectral line imaging observations and Westerbork Synthesis Radio Telescope spectroscopy of the compact variable nuclear radio jet source in the elliptical galaxy NGC 1052. Absorption and emission signatures reveal ionised, atomic, and molecular components of the surrounding medium.
Ten epochs of Very Long Baseline Array (VLBA) data at 15 GHz, spanning almost six years, show bi-symmetric jets, in which multiple sub-parsec scale features display outward motions of typically ( km s-1 Mpc-1) on each side. The jets are most likely oriented near the plane of the sky.
Multi-frequency VLBA observations at seven frequencies between 43 and 1.4 GHz show free-free absorption in the inner parsec around the nucleus, probably together with synchrotron self-absorption. The free-free absorption is apparently due to a structure which is geometrically thick and oriented roughly orthogonal to the jets, but which is patchy. The western jet is covered more deeply and extensively, and hence is receding.
Hi spectral line VLBI observations reveal atomic gas in front of the approaching as well as the receding jet. There appear to be three velocity systems. Broad, shallow absorption asymmetrically straddles the systemic velocity spanning to 85 km s-1. This gas could be local to the AGN environment, or distributed on galactic scales. Superimposed in the range 25 to 95 km s-1 are several sharper (3–15 km s-1) features, each detectable over a few tenths of a pc at various places along the inner 2 pc of the approaching jet. The third, deepest system is at “high velocities”, which is receding by 125 to 200 km s-1 with respect to the systemic velocity of NGC 1052. It may have a continuous velocity gradient across the nucleus of some 10 km s-1 pc-1. This atomic gas seems restricted to a shell 1–2 pc away from the core, within which it might be largely ionised.
Westerbork Synthesis Radio Telescope spectroscopy has revealed the 18 cm OH main lines (1667 and 1665 MHz) in absorption along the full velocity span of to 200 km s-1, with their line ratio varying roughly from 1:1 to 2:1. They are deepest in the high velocity system, where the OH profiles are similar to Hi, suggesting co-location of that atomic and molecular gas, and leaving unclear the connection to the H2O masing gas seen elsewhere. In the high velocity system we have also detected the 18 cm OH satellite lines: 1612 MHz in absorption, and 1720 MHz in emission. The conjugate behaviour of the satellite line profiles, and the variable main line ratio resemble the situation in Cen~A and NGC 253.
Key Words.:
Galaxies: active – Galaxies: jets – Galaxies: nuclei – Galaxies: individual: NGC 1052 – Radio lines: galaxies1 Introduction
The elliptical galaxy NGC 1052 is a low luminosity AGN which has a well-studied LINER optical spectrum (e.g., Gabel et al. gab00 (2000)) and an unusually prominent central radio source, with a flux density of 1–2 Jy and a fairly flat spectrum between 1–30 GHz, which is variable on timescales of months to years (e.g., Heeschen heeyi (1968), heeup (1970); Heeschen & Puschell hee83 (1983)). Since NGC 1052 is comparatively nearby111We adopt =65 km s-1 Mpc-1, with no corrections for local deviations from the Hubble flow, so that the optical stellar absorption line heliocentric redshift, km s-1 or (Sargent et al. sar77 (1977)), corresponds to a distance of 22 Mpc and implies that 1 mas corresponds to 0.1 pc, very detailed scrutiny of the active nucleus and its inner environment are possible. This is important because the extension to lower luminosity of the active nucleus/relativistic jet phenomenon has not been well studied.
A 1.4 GHz Very Large Array (VLA) image of NGC 1052 shows a core-dominated radio structure, with only about 15% of the flux density in extended emission: there are two lobes spanning kpc, possibly with hot spots (Wrobel wro84 (1984)). The core luminosity at 5 GHz is W Hz-1 (Kellermann et al. kel98 (1998), hereafter K98). Thus, while NGC 1052 is clearly in the luminosity class of classical FR I radio sources, its radio spectrum, morphology, and size (the entire radio source has dimensions smaller than the host galaxy), suggest that it may be akin to Gigahertz-Peaked-Spectrum or Compact-Steep-Spectrum sources, which are generally thought to be young jets, propagating through, and perhaps interacting with, a rich inner galactic medium (see the review by O’Dea ode98 (1998)).
Early Very Long Baseline Interferometry (VLBI) observations showed that most of the radio emission is from a sub-pc scale core (Cohen et al. coh71 (1971)), extended over 15 milliarcseconds (mas) in position angle 63∘ (Jones et al. jon84 (1984)). Recent work by Kadler et al. (2002a ) shows that coincident X-ray, optical, and radio knots, at distances of some 500 pc on both sides of the core, are aligned with the parsec-scale radio jets. The emission extended further out to a few kpc seems to be more along a position angle of 95∘, as already seen in the VLA image by Wrobel (wro84 (1984)). Davies & Illingworth (dav86 (1986)) found the parsec-scale jets to be approximately perpendicular to the gas rotation axis, which they measured to be at ∘ using the optical emission lines. The same orientation is also seen in the neutral, Hi 21 cm line emitting gas component (van Gorkom et al. van86 (1986), hereafter vG86). But, as is not uncommon in elliptical galaxies, the gas rotation axis is oriented well away from that of the stars, which is at position angle 25∘, close to the projected photographic minor axis of the galaxy (e.g, Davies & Illingworth dav86 (1986)). NGC 1052 is probably a triaxial system, and it is plausible that the gas, which has sub-solar abundances (Sil’chenko sil95 (1995)) and a gas-to-dust ratio comparable to that in our local Galaxy, was acquired as a result of one or more mergers or tidal interactions, for example with the nearby spiral NGC 1042 (see vG86; Davies & Illingworth dav86 (1986); Plana & Boulesteix pla96 (1996)).
There is much observational evidence for the presence of a substantial amount of gas and dust along the line of sight to the nucleus. First, Chandra observations reveal an X-ray jet embedded into a 0.5 keV thermal plasma (Kadler et al. 2002a ). Optical images show a faint diffuse kpc-scale dust lane extending along the projected minor axis (e.g., Carter et al. car83 (1983); Davies & Illingworth dav86 (1986)). Also, Gabel et al. (gab00 (2000)) have imaged an H emission line filament on scales of 100 pc. Towards the nucleus there is reddening of the continuum light (e.g., Carter et al. car83 (1983)), as well as the nebular emission lines (Gabel et al. gab00 (2000)). Polarised optical broad lines (Barth et al. bar99 (1999)) give evidence for the presence along our direct line of sight to the AGN of the kind of toroidal obscuring region often invoked in unification models for various kinds of active galaxies (e.g., Antonucci ant93 (1993)). The soft X-ray spectrum also shows strong absorption, indicating a substantial, and possibly inhomogeneous column depth of ionised gas towards the active nucleus (Guainazzi & Antonelli gua99 (1999); Guainazzi et al. gua00 (2000); Weaver et al. wea99 (1999); Kadler et al. 2002a ).
Hi 21 cm line absorption has been found towards the bright nuclear radio source at velocities ranging from 1480–1680 km s-1, i.e. extending redward from systemic over 200 km s-1 (Shostak et al. sho83 (1983); vG86). Around 1640 km s-1 H2O maser emission has been detected (Braatz et al. bra94 (1994)) and imaged with the VLBA (Claussen et al. cla98 (1998)). Recently, 1667 and 1665 MHz OH absorption near 1640 km s-1 has also been detected (Omar et al. oma02 (2002)). The presence of CO lines is unclear: Wang et al. (wan92 (1992)) claimed a detection of CO(1–0) in emission near 1420 km s-1, but the peak strength of 150 mK is much above the 20 mK 3 upper limit claimed by Wiklind et al. (wik95 (1995)), and is also not confirmed by Knapp & Rupen (kna96 (1996)). Meanwhile, Knapp & Rupen (kna96 (1996)) did find tentative absorption features in CO(1–0) in the velocity range 1550–1700 km s-1. As they point out, lines at that velocity might also be visible in the CO(1–0) and CO(2–1) spectra of Wiklind et al. (wik95 (1995)). Since there is now confirmed molecular gas at this velocity in OH and also in H2O masers, it is important to verify the CO results.
This paper deals with various aspects of the radio jets and the measurements of ionised atomic and molecular gas in their surrounding medium. Section 2 collects the details of all of the observations and the data reduction. In Sect. 3 we discuss the morphology and kinematics of sub-pc scale features in the jets, based on 15 GHz VLBA observations made at a total of ten different epochs, spanning a period of more than five years. In Sect. 4 we present the broad-band continuum spectra of various jet components, which indicate extensive, asymmetric free-free absorption; this is based on VLBA observations at seven frequencies, spanning the range from 1.4 GHz up to 43 GHz. Kellermann et al. (kel99 (1999), hereafter K99) reported on motions and free-free absorption in NGC 1052, now fully described in this paper. Kameno et al. (kam01 (2001), hereafter Ka01) later analysed another dataset also showing free-free absorption. Kadler et al. (2002a ; 2002b ) analysed further multi-frequency data finding free-free absorption also, and linearly polarised emission at 5 GHz. Section 5 shows the spatial and velocity distribution of the Hi absorption on sub-pc scales, based on Hi 21 cm spectral line VLBI observations. Section 6 deals with Westerbork Synthesis Radio Telescope (WSRT) observations of all four 18 cm OH lines, using the new wide band multi-channel digital backend (DZB) which is very well suited for observing spectral lines over wide bandwidths with multiple spectral channels. We find the OH 1665 and 1667 MHz lines over a much wider velocity range than originally discovered by Omar et al. (oma02 (2002)), and we also find for the first time the presence of the OH 1612 and 1720 MHz lines, in absorption and emission, respectively.
2 The observations and data reduction
Table 1 gives an overview of all observations of NGC 1052 which we discuss in this paper. These include VLBA multi-epoch 15 GHz continuum monitoring, VLBA multi-frequency continuum imaging, VLBI Hi 21 cm line imaging, and WSRT OH 18 cm line spectroscopy.
2.1 Multi-epoch VLBA monitoring
We first recognised NGC 1052 as a source of special interest from our 15 GHz (2 cm) VLBA study of the morphology and kinematics of strong compact radio sources (K98; Zensus et al. zen02 (2002)) when we saw the striking and unusual bi-symmetry of the parsec-scale jets. Thus, since 1995, we have included NGC 1052 in most of our multi-snapshot 15 GHz VLBA survey observing sessions. Sources are typically observed for 4–8 minutes per hour during 8-hour blocks, using all antennas of the VLBA where the source is above 10∘ elevation. The survey observations and data reduction are further described in K98, and that paper contains the 15 GHz image of NGC 1052 obtained at epoch 1997.20. We have also obtained some deeper 15 GHz VLBA images from dedicated observing runs on NGC 1052. All ten 15 GHz images are displayed in Fig. 1. The kinematics are discussed in Sect. 3.
| Date | Array | Remarks | ||
|---|---|---|---|---|
| [yyyy/mm/dd] | [min] | [GHz] | ||
| 1995/07/28 | 40 | 15.4 | VLBA | 15 GHz monitoring |
| 1995/12/16 | 40 | 15.4 | VLBA | 15 GHz monitoring |
| 1996/07/10 | 24 | 15.4 | VLBA | 15 GHz monitoring |
| 1996/10/24 | 120 | 15.4 | VLBA | Continuum imaging |
| 1997/03/13 | 100 | 15.4 | VLBA | 15 GHz monitoring |
| 1997/07/09 | 62 | 5.0 | VLBA | Continuum imaging |
| 1997/07/09 | 62 | 8.4 | VLBA | Continuum imaging |
| 1997/07/09 | 100 | 15.4 | VLBA | Continuum imaging |
| 1997/07/12 | 120 | 22.2 | VLBA+Y1 | Continuum imaging |
| 1997/07/12 | 180 | 43.2 | VLBA+Y1 | Continuum imaging |
| 1997/07/15 | 410 | 1.4 | VLBA | Contin. + line imaging |
| 1997/07/15 | 410 | 1.7 | VLBA | Contin. + line imaging |
| 1998/02/01 | 100 | 15.4 | VLBA | Continuum imaging |
| 1998/07/19 | 570 | 1.4 | VLBA+ Y27+Eb | Line imaging |
| 1998/11/01 | 36 | 15.4 | VLBA | 15 GHz monitoring |
| 1999/11/07 | 44 | 15.4 | VLBA | 15 GHz monitoring |
| 2001/03/15 | 45 | 15.4 | VLBA | 15 GHz monitoring |
| 2001/12/22 | 585 | 1.7 | WSRT | Spectrum OH-main |
| 2002/01/07 | 240 | 1.7 | WSRT | Spectrum OH-main |
| 2002/02/16 | 420 | 1.7 | WSRT | Spectrum 1720 |
| 2002/02/18 | 210 | 1.7 | WSRT | Spectrum 1720 |
| 2002/02/19 | 380 | 1.7 | WSRT | Spectrum 1720 |
| 2002/02/23 | 250 | 1.6 | WSRT | Spectrum 1612 |
| 2002/02/24 | 510 | 1.6 | WSRT | Spectrum 1612 |
2.2 Multi-frequency VLBA imaging
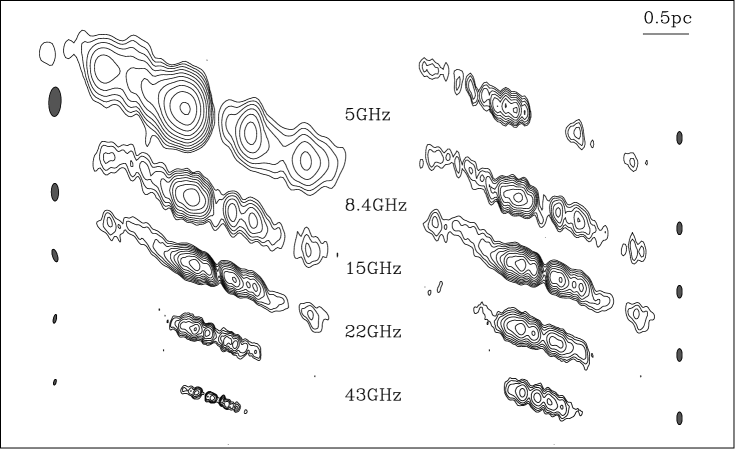
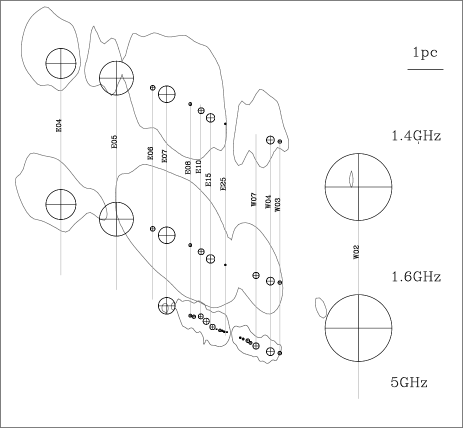
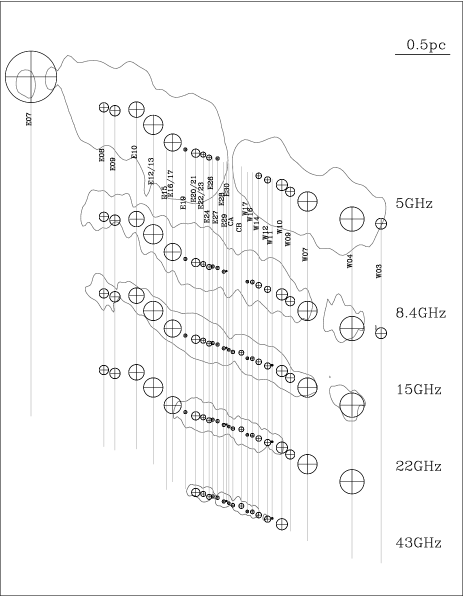
We report on nearly simultaneous multi-frequency VLBA continuum observations of NGC 1052, made on 1997 July 9 at 5, 8, and 15 GHz, and on 1997 July 12 at 22 and 43 GHz; for the latter, a single VLA antenna (“Y1”) was added to the VLBA in order to improve short baseline coverage. The observing frequency was changed every 5–10 minutes. Both left- and right-circular polarisation were recorded with 2-bit samples over 4 contiguous 8 MHz bands; the record/no-record duty cycle was 50%, since there was a time-averaged total data rate limit of 128 Mbit s-1. On 1997 July 15, a 4 MHz wide band at 1411.204–1415.204 MHz, targeting the Hi 21 cm line, was recorded continuously with 2-bit samples at 16 Megasamples s-1 (twice the Nyquist rate), in both hands of circular polarisation. This setup optimises the sensitivity for limited-bandwidth signals. We have obtained excellent Hi spectral line data, as well as a 1.4 GHz continuum image from the line-free channels, as described below. Simultaneously, using separate local oscillator (LO) settings in other base-band converter (BBC) channels, we also alternated every 5–10 minutes between recording 1654.958–1658.958 MHz and 1656.945–1660.945 MHz, in the same mode as for the 1.4 GHz channels, in order to search for possible OH lines. We have since discovered that this setup would not yield adequate sensitivity for OH spectral line imaging (see Sect. 6), and we have simply combined all of the data to yield a 1.6 GHz continuum image. All continuum datasets were reduced in standard fashion (e.g., K98): amplitude calibration and fringe-fitting in aips, followed by editing, iterative self-calibration and cleaning in difmap. Special care was taken during fringe-fitting at 43 GHz to obtain as many secure detections on long baselines as possible. The continuum images are displayed in Fig. 4, and the resultant broad-band continuum spectral information is analysed in Sect. 4. We identified ”components” in the images which appeared at the same place at all (or most) wavelengths, and fitted Gaussians at these fixed locations to the visibility data. The component locations are shown on top of the images in Fig. 5. Due to spectral effects as well as differences in resolution, it was not possible to find all components at all epochs, but it was always possible to obtain a unique relative registration through the cross-identification of several components in both jets between adjacent frequencies, working gradually from the centre outward at progressively lower frequencies. The determination of relative flux densities of features observed at the different frequencies of course suffers from all of the usual VLBI imaging problems, ranging from inaccurate, time variable a priori gain factors and system temperatures, through floating gains incurred during self-calibration, to flux density lost from (over)resolved structures. Conservatively, we would caution against over-interpretation of phenomena which would require relative flux density measurements accurate to better than 10–20%. Further details on the multi-frequency analysis and the kinematics are given in Figs. 6, 7, and 9.
2.3 VLBI Hi line observations
The 1997 July 15 data spanned 1411.204–1415.204 MHz, which covers about 850 km s-1, centred on km s-1 for the Hi 21 cm line. The data were correlated with 4 sec accumulation intervals and 512 spectral channels over the 4 MHz wide band, yielding a spectral resolution of 2 km s-1. On 1998 July 19, we obtained a full-track 1.4 GHz VLBI spectral line observation, using the ten antennas of the VLBA, together with the VLA operating as a tied array (“Y27”), and the Effelsberg radio telescope (“Eb”). Unfortunately, we found that for Effelsberg and the Mauna Kea VLBA antenna, which are rather isolated on opposite ends of the VLBI array, uncertainties in the self-calibration were too large to make a reliable contribution to the final results. In this second observation we simultaneously used 8 MHz and 1 MHz wide bands, 1409.01–1417.01 MHz and 1412.51–1413.51 MHz, co-centred on km s-1, in the two senses of circular polarisation, recorded with 2-bit samples at 16 Megasamples s-1 each (a factor 8 oversampled w.r.t. the Nyquist rate for the narrow bandwidth). Correlation using 16 second accumulation intervals took place with 1024 spectral channels, yielding spectral resolutions of 2 km s-1 (the same as for the 1997 dataset) and 0.25 km s-1, respectively. Initial reduction of the spectral line datasets took place in aips: after a priori amplitude calibration and fringe fitting, complex passband solutions for each of the antennas were obtained from the strong sources 3C 454.3 and 3C 84, observed immediately preceeding and following NGC 1052. After application of the solutions, the two parallel hands of polarisation were added (cross-polarisation correlation did not take place). All further analysis took place in difmap. The spectral channels well away from the absorption line complex were averaged and used for continuum self-calibration and imaging. The dataset with 1 MHz bandwidth from 1998 has no line-free channels, and so the continuum self-calibration solutions from the co-centred 8 MHz wide band were adopted. The resultant 1997 1.4 GHz image is shown in Fig. 4, and this dataset was used in the multi-frequency analysis presented in Sect. 4. The antenna phase corrections as a function of time derived from the continuum were then applied to all line channels. Spectra at different positions along the jets were determined from Gaussian components fitted directly to the visibility data, guided by the desire for an optimum discrimination between the locations of the various absorption line components. The model was first developed using the integrated continuum channels, and the flux densities of the model components were then re-fitted separately for each spectral line channel, while their positions and sizes were kept fixed. We have determined that the results are stable against reasonable perturbations, for example, slightly altered model positions, or using different sliding averages over the line channels. The resultant spectra are shown in Fig. 11 and Fig. 12 for those components where the spectral signal-to-noise ratio was useful.
2.4 WSRT OH line observations
Triggered by the discovery of the 18 cm OH main lines (1665 and 1667 MHz) near km s-1 by Omar et al. (oma02 (2002)), we have used the new, wide-band, multi-channel backend (DZB) at the WSRT to obtain high quality spectra to probe the presence of all four 18 cm OH lines (1612, 1665, 1667, and 1720 MHz) over the full velocity range seen in Hi. A number of scans were obtained in the period December 2001 – February 2002 (see table 1). The main lines are sufficiently close together in frequency to observe jointly; we have used a 10 MHz wide band which probes a wide velocity range, as discussed in Sect. 6. Each of the satellite lines (1612 and 1720 MHz) was observed separately with a 5 MHz wide band. In all cases there were 512 spectral channels over the band (half the nominal DZB capacity), Hamming tapered to avoid spectral ringing of radio frequency interference (RFI), should it occur. The resultant spectral resolution is near 7 km s-1 for the main lines, and around 3.5 km s-1 for the satellite lines. We used 2-bit sampling, and a data accumulation interval of 60 sec. Initial phase, flux density, and passband calibration was based on the strong, unresolved sources 3C 48 and 3C 147, which were always observed immediately before and after NGC 1052. The spectral slope remaining in Fig. 13 is attributable to unmodeled spectral index differences between the calibrators and NGC 1052, and the flux density scales are accurate to 5% or better. We added the two orthogonal linear polarisations (no cross-polarisation correlation was carried out) after separate calibration. Self-calibration on the average of the line-free channels was then performed to find time-dependent complex gain corrections, and these were applied to the visibilities in each of the spectral channels. NGC 1052 is by far the dominant point source, in the centre of the field, and the final spectra were obtained simply as a vector average over all times and interferometers. The angular resolution of the WSRT is around 13 arcsec, and we did verify that the results are not affected by the presence of the lobes, containing less than 50 mJy each, and situated at 11 and 14 arcsec to the east and west, respectively. The data for the line with rest frequency 1612 MHz were significantly affected by RFI emitted near 1603 and 1605 MHz, possibly due to GLONASS satellites. Significant stretches of time had to be edited out, and all data on baselines shorter than 750 m were completely removed. Even so, for this line the noise at velocities below 1500 km s-1 is dominated by residual RFI.
3 Kinematics

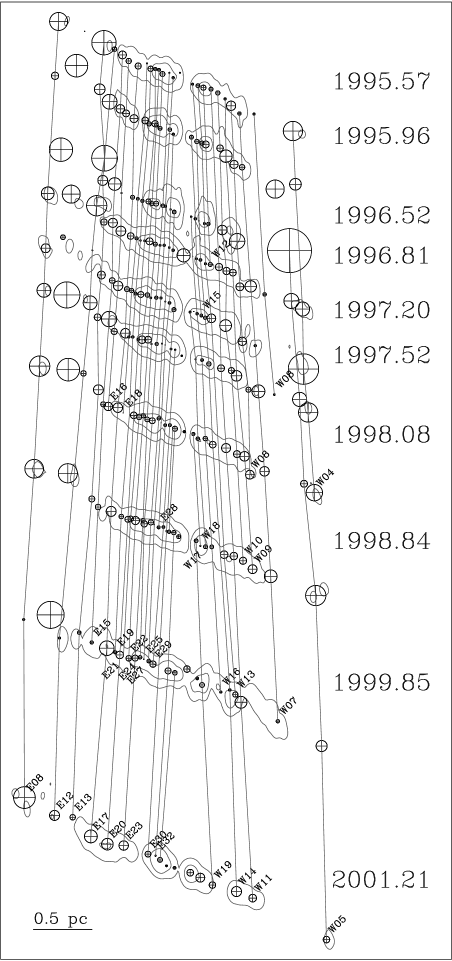
Ten epochs of VLBA data at 15 GHz have been accumulated, spanning the period 1995 July - 2001 March. The relative alignment of the images, shown in Fig. 1, is explained below. At all epochs the source appears symmetric with oppositely directed, slightly curved jets. Note the prominent gap 0.1–0.2 pc west of the brightest feature in most images. From the equivalent colour images a movie has been produced, which can be viewed at the 2-cm Survey web site, http://www.nrao.edu/2cmsurvey. The frames in this movie were generated by linear interpolation of the clean models over time at every pixel between the ten epochs of observation. Note that this procedure will create a non-physical appearance whenever features move by more than half a synthesised beam width between epochs; this is indeed the case several times during the sequence.
The ten 15 GHz images clearly reveal motions away from the centre of symmetry. However, at the high linear resolution we have achieved, this source shows complex structure and evolution, not easily described by a simple collection of discrete components moving with well-defined velocities throughout the nearly six-year time period spanned by our observations. The flux density of features evolves rapidly, on time scales of months, and new features seem to arise frequently in both inner jets. There is thus the risk of stroboscopic effects whenever the time coverage is insufficiently dense; indeed, we have omitted 2001.21, the last 15 GHz epoch, from our motion analysis because we are not sure we can unambiguously tie in the evolution of the jet emission over the sixteen-month interval to the previous epoch. A quantitative analysis of the jet flow is also made more difficult by the differing coverage and varying sensitivity among epochs. These are due to the effects of weather and to occasional technical failures at one or more telescopes.
Nevertheless, we have achieved a reliable quantitative motion analysis, which helps to constrain the geometry of the jets and surrounding medium in NGC 1052. For each epoch we used difmap to carry out an iterative least-squares fit to the visibility data of a series of circular Gaussian features which reasonably approximate the actual images, as verified by inspection of the residuals between the visibility data and the model in the image plane. The development of a component set consistent over time was guided by extensive visual cross-comparisons of the ten images (Fig. 1). Many of the components found at 15 GHz are also seen in the higher resolution 43 GHz image which is shown in Fig. 4. While not every component should be interpreted as a true physical entity (a plasmon or a “cannon-ball”), we are confident that the set as a whole is an appropriate representation of many morphological features which can be distinctly tracked as they persist for multiple epochs. These features are labelled in Figs. 2 and 3.
In order to solve for the motions of the components with respect to the origin of ejection, one should ideally know beforehand the location of the origin at each epoch. However, our observations were not phase-referenced to a celestial position calibrator source. Furthermore, as is shown in Sect. 4, the origin of ejection is likely to be in the central emission gap, and therefore there is no recognisable, persistent, stationary emission feature on which to align the models and images. But, as demonstrated by Figs. 2 and 3, we have found that a plausible relative alignment of the epochs exists, in which the motions of most of the components, on both sides of the centre, are consistent with being linear on the sky and constant over time. The jets are clearly curved, and this is reflected by the fact that we have found components moving along different position angles. While a simple ballistic model fits well, we cannot rule out that mild accelerations and decelerations or bending may occur as the components traverse a significant fraction of a parsec over a number of years. In order to determine that, a longer monitoring is required.
| Comp. | |||
|---|---|---|---|
| ID | [pc yr-1] | [pc yr-1] | [pc yr-1] |
| E08 | 0.067 | 0.013 | 0.068 |
| E12 | 0.090 | 0.006 | 0.090 |
| E13 | 0.062 | 0.032 | 0.070 |
| E15 | 0.063 | 0.020 | 0.066 |
| E16 | 0.067 | 0.017 | 0.069 |
| E17 | 0.066 | 0.036 | 0.075 |
| E18 | 0.084 | 0.011 | 0.084 |
| E19 | 0.074 | 0.033 | 0.081 |
| E20 | 0.074 | 0.027 | 0.079 |
| E21 | 0.073 | 0.029 | 0.079 |
| E22 | 0.070 | 0.033 | 0.078 |
| E23 | 0.071 | 0.029 | 0.076 |
| E24 | 0.070 | 0.036 | 0.078 |
| E25 | 0.068 | 0.045 | 0.081 |
| E27 | 0.069 | 0.043 | 0.082 |
| E28 | 0.080 | 0.058 | 0.099 |
| E29 | 0.081 | 0.045 | 0.093 |
| E30 | 0.071 | 0.038 | 0.080 |
| E32 | 0.049 | 0.028 | 0.056 |
| W19 | 0.050 | 0.022 | 0.055 |
| W18 | 0.079 | 0.061 | 0.100 |
| W17 | 0.074 | 0.023 | 0.078 |
| W16 | 0.077 | 0.022 | 0.080 |
| W15 | 0.065 | 0.029 | 0.072 |
| W14 | 0.074 | 0.013 | 0.075 |
| W13 | 0.074 | 0.018 | 0.076 |
| W12 | 0.046 | 0.020 | 0.050 |
| W11 | 0.061 | 0.025 | 0.066 |
| W10 | 0.067 | 0.026 | 0.072 |
| W09 | 0.072 | 0.026 | 0.077 |
| W08 | 0.067 | 0.052 | 0.085 |
| W07 | 0.080 | 0.018 | 0.082 |
| W06 | 0.087 | 0.033 | 0.094 |
| W05 | 0.087 | 0.065 | 0.109 |
| W04 | 0.071 | 0.041 | 0.082 |
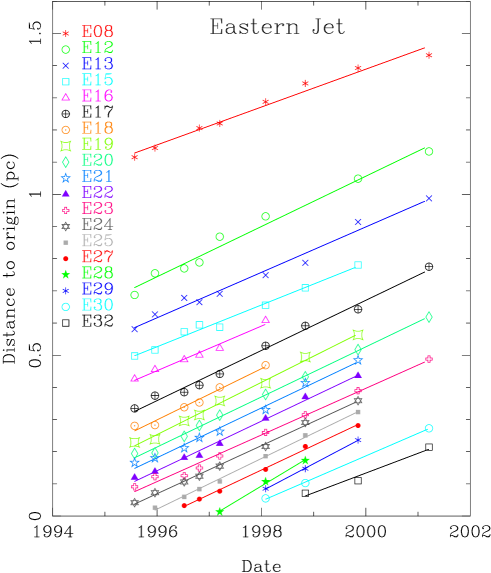
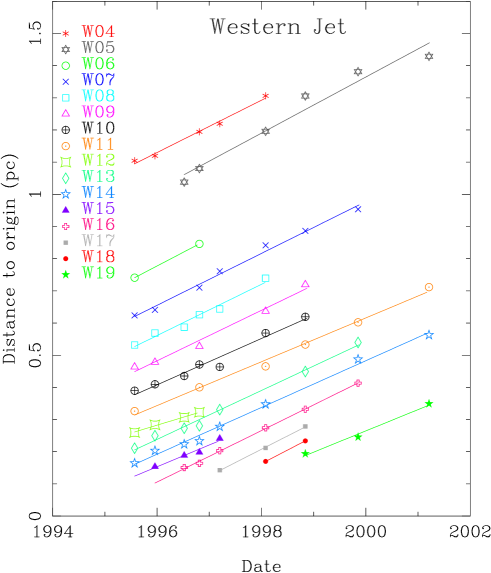
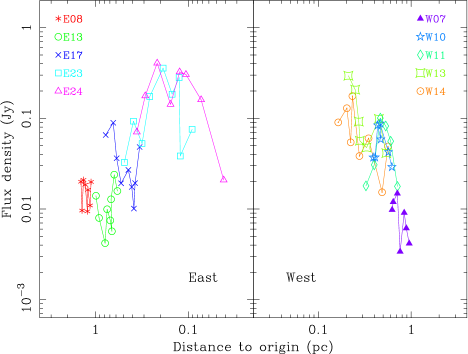
For ballistic motions, one can treat the orthogonal velocities on the plane of the sky separately. Using all of the component positions at all of the epochs (except 2001.21) together, we have therefore performed a single least-squares fit to solve for relative offsets on the sky between all epochs, simultaneously with linear velocities for all individual components. Table 2 gives the resultant velocities for each of the components identified in Fig. 2. In Fig. 3 we show the measured component positions, with the best-fit relative inter-epoch alignments applied. The lines show the best-fit linear velocity of each component for which we had confidence in the cross-epoch identification. At most epochs we detected additional radio emitting features. While appearing to move outward with roughly similar velocities, these features are too diffuse or too faint to have their position tightly constrained, and we have omitted them from the simultaneous least-squares fit.
The absolute location (0,0) of the stationary kinematic origin, or core, is in principle given by the intersection of the back-extrapolated ballistic trajectories, since the jets are somewhat curved. However, we have found that this procedure is rather sensitive to the chance configuration of available components. We estimate that the absolute location of the centre used in the figures and tables is uncertain by about mas (0.02 pc), although the relative alignment between the epochs is much better. We find that our multi-epoch registration (not available for the data studied by Ka01) provides an indispensable basis for an accurate study of the detailed geometry of the radio source and the enshrouding absorption (Sect. 4, 5), with respect to a well-defined kinematic centre.
The data establish quite clearly that the features on the two sides move in opposite directions with roughly equal apparent velocities of mas yr-1 ( pc yr-1), which corresponds to a linear velocity of 0.260.04. These apparent velocities could in principle be pattern motions which differ from the actual bulk flow speed. But if the bulk flow were substantially more relativistic than the observed motions, this would likely lead to greater asymmetry between the approaching and the receding jet than is observed in flux density (unabsorbed, as seen only at 43 GHz, see Sect. 4), arm-length, and speed. If the velocities are intrinsically the same in both jets, then the jets must be oriented fairly close to the plane of the sky; a lower limit to the jet inclination of 57∘ is obtained by taking the opposite extremes allowed by the errors for the relativistic velocities in the two jets: 0.090 pc yr-1 in the approaching jet, and 0.066 pc yr-1 in the receding jet.
4 Ionised gas
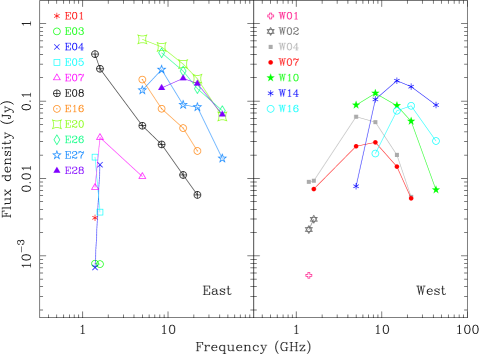
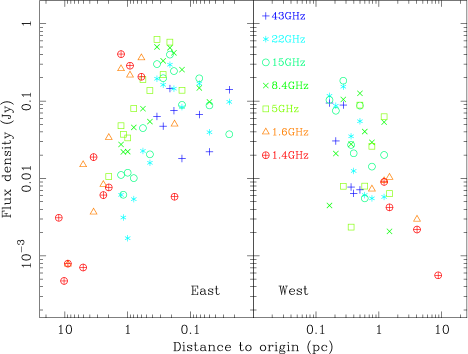
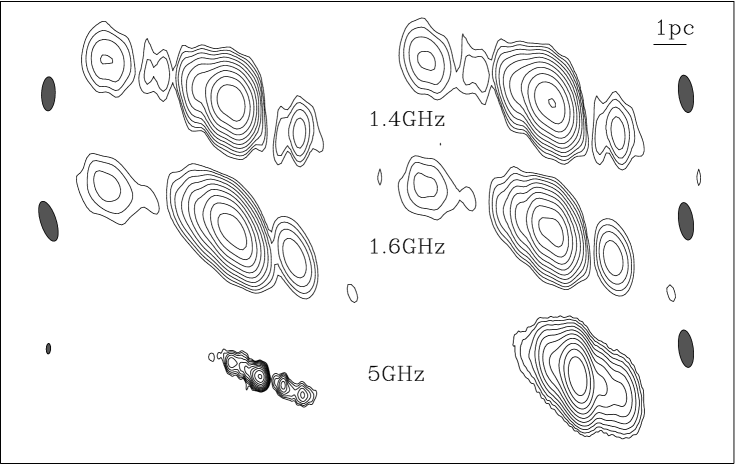
Figures 4 and 5 show VLBA images and models at 43, 22, 15, 8, 5, 1.6, and 1.4 GHz, all observed within a few days of each other at epoch 1997.52 (Table 1). Individual component spectra are shown in Fig. 6; it is obvious that there is a very wide range of spectral shapes, which proceed from steep, through convex, to highly inverted, from the outer jets towards the middle. Figure 7 provides a good illustration of this general dependence of spectral shape on distance from the centre (a well-defined location thanks to the tie-in to the kinematic analysis through the co-eval 15 GHz dataset).
On both sides of the gap there are components with a low-frequency surface brightness well below 1010 K, and a low-frequency spectral cutoff steeper than if expressed as a power law. As we have first reported in K99, we believe that the only plausible explanation for these sudden truncations is free-free absorption from ionised gas somewhere along the line of sight to the radio jets, which, in its simplest form, leads to an exponential spectrum; Ka01 came to the same conclusion based on three frequencies observed at a later epoch. On the other hand, other components have more gently convex spectra, and brightness temperatures in excess of 1010 K, quite compatible with typical synchrotron self-absorbed inner jet components of AGN. It is likely that (intrinsic) synchrotron self-absorption and (external) free-free absorption both play a role in fixing the observed spectral shape of individual jet components of NGC 1052, and if conditions are such that similar peak frequencies result from both effects, it is difficult to disentangle the two.
As a result of the free-free absorption, the images of Fig. 4 show, in going from high to low frequency, the opening up of a distinctive hole in the middle of the radio structure. Note that in contrast to Ka01, with our unambiguous localisation of the kinematic centre we can ascertain that none of the components visible at any frequency lower than 43 GHz corresponds to the core. At 43 GHz the source structure appears to be fairly symmetric, which, like the similarity between the velocities on both sides, suggests that relativistic beaming effects are small, and that the jets are therefore probably directed fairly close to the plane of the sky. While at lower frequencies the hole is deepest over the central region, the attenuation is much more pronounced along the western jet than at corresponding locations along the eastern jet. At 0.5 pc along the eastern jet, and 1–2 pc along the western jet, the signature of free-free absorption becomes more and more difficult to distinguish from plausible intrinsic, synchrotron-self-absorbed, spectral shapes.
As we have previously reported (K99), the most straightforward way to explain the observations is if the eastern jet is approaching us, and the western jet receding from us, so that the latter gets covered more deeply behind the free-free absorbing medium, almost regardless of the detailed geometry of that medium. Substantial coverage of the approaching jet is obtained naturally if the absorber is geometrically thick. It could very well be a thick disk- or torus-like region, as postulated in many AGN unification models, oriented more or less perpendicular to jets directed fairly close to the plane of the sky.
Variations on this scenario with a thinner disk or torus, either not oriented orthogonal to the jets, or warped, are possible. Furthermore, there is quite a variety of spectral shapes in our 1997.52 dataset (Fig. 6), and the observed flux density variations of individual components tracked over time at 15 GHz (illustrated in Fig. 8) shows that the absorbing region, while possessing a fairly well-defined overall geometry, has substantial patchiness in detail. We therefore think it is not very meaningful to use a single epoch to enter into detailed modeling of the (a)symmetry between the jet flux densities, in order to try to derive more stringent bounds on the jet and screen geometry, or to attempt spectral decompositions into intrinsic shapes and absorption contributions, in an effort to find detailed radial or transverse opacity profiles. We plan to improve this situation with multi-epoch multi-frequency monitoring, in which we hope to use a series of moving components to trace out overlapping parts of the profile.

In order to gain an impression of the overall trend of free-free absorption opacity as a function of distance from the centre, we show in Fig. 9 the frequency at which components with a convex spectrum have their greatest flux density; this should be close to the turnover frequency which would be found if a detailed spectral decomposition were possible. The turnover frequency decreases roughly with distance along the jets to the power 0.7–1, and is fairly consistently a factor of 4–5 lower along the eastern jet than at the corresponding distance along the western jet. We compute from at 43 GHz (the highest turnover frequency seen) that the volume density would be cm-3 if the free-free absorbing gas would be distributed uniformly along a path-length of 0.5 pc with a temperature K.
5 Atomic gas
Figure 10 shows that the integrated Hi absorption starts around 1440 km s-1, just blueward of the systemic velocity, km s-1, and then continues towards higher velocities (redshifts) over more than 300 km s-1. Figures 11 and 12 depict spatially resolved Hi spectra from July 1997 and 1998, in flux density and optical depth, respectively, at all locations where the signal-to-noise ratio allowed detection of line absorption at the level of a few percent. The spectrum of the western jet is shown for both epochs, but its flux density is so severely attenuated by free-free absorption that it was not possible to detect Hi absorption with the modest sensitivity of the 1997 VLBA-only data. The more sensitive 1998 dataset does reveal very high opacity (up to 25%) absorption towards the brightest part of the western jet, situated about 1.5 pc from the centre. We did not detect any line features at 2 pc or larger distances along the eastern jet; Fig. 11 shows, as an illustration, the 1997 spectrum at 2 pc, where the 2 optical depth limit is 2% for features with 20 km s-1 FWHM. We believe that there are likely to be three absorption systems with different characteristics, at least two of which are probably due to atomic gas on parsec or sub-parsec scales, local to the AGN environment, rather than distributed on galactic scales.
The most distinct, deepest absorption occurs above 1600 km s-1. From the 1998 dataset, we see in Fig. 12 that the western jet shows a 20–25% deep line centred at 1620 km s-1, with a FWHM of about 20 km s-1 and a possible blue wing. At 1 pc along the eastern jet there is a roughly 10% deep peak near 1640 km s-1 with a FWHM of some 18 km s-1, while at 1.5 pc east of the centre there is a 5% deep feature centred near 1652 km s-1 with a FWHM of 30 km s-1. The 1997 dataset (Fig. 11) gives similar results for the eastern jet although the details are dependent on the precise locations of the background features. We have the impression that these features are all part of a single ”high velocity system”. This absorber then has a west-to-east velocity gradient of some 10 km s-1 pc-1, with the possible blue wing in the west and the increasing velocity width in the east perhaps indicating an even larger velocity gradient towards its outer edges; these could be the tell-tale signs of a rotating structure. The high velocity system is absent at 2 pc and larger distances, as far as can be determined along the eastern jet. Even more interestingly, while the high velocity system has prominent Hi absorption along both the receding and the approaching jet, it appears to have a central hole: there is no high velocity absorption deeper than 0.4% (2 limit) towards the relatively bright innermost jet component, centred 0.6 pc east of the core. This shows a lack of neutral gas in the central parsec around the AGN, while, as discussed in Sect. 7, both ionised and molecular gas do exist close to the centre.
By contrast, there is a “low velocity system”, which is fairly smooth but relatively shallow, with optical depth 1–2%. It spans 1440–1570 km s-1, asymmetrically straddling the systemic velocity km s-1, determined from galactic absorption lines (Sargent et al. sar77 (1977)). Since it is found equally in all jet components where the signal-to-noise ratio is adequate, the low velocity system could either arise near the AGN or in gas on much larger than parsec scales.
Superimposed, in the velocity range 1500–1570 km s-1 are some sharper features, having widths of 3–15 km s-1 and depths up to 5%, which predominate at quite specific locations along the inner 2 pc of the eastern jet. The most prominent one, centred at 1522 km s-1 with a FWHM of 6 km s-1, is seen mostly at 0.6 pc from the core, where it raises the local total absorption depth to 10%. Remarkably, a sharp absorption line near 1549–1550 km s-1 is evident both 0.6 pc and 1.3 pc east of the centre, giving an optical depth of 5–6%, but there is no line deeper than 2% (2 limit) near this velocity towards the intervening eastern jet component at 0.9 pc. It is also noteworthy that these sharpest features (as ascertained from our higher resolution 1998 dataset) are remarkably kinematically quiescent, with a FWHM of only 3–5 km s-1.


The full velocity extent of the absorption is roughly similar to that found in the 1982/3 VLA spectrum obtained by vG86. However, the detailed profile in the lower velocity range has evolved markedly over time, as we illustrate by convolving our 1998 integrated spectrum to the ten times lower spectral resolution of the older data (Fig. 10). Furthermore, the peak absorbed flux density, which occurs in the high velocity system at both epochs, has increased to about 45 mJy in our integrated 1997 profile, as compared to about 15 mJy in 1982/3, while the total flux densities are quite comparable: 840 mJy in 1982/3, compared to 950 mJy in 1997 summed over all VLBI components (the recent L-band WSRT observations show that the arcsecond-scale lobes in addition contain less than 50 mJy each). Thus, the peak optical depth, computed from the integrated flux densities, was 5% in 1997, but only 2% in 1982/3. Shostak et al. (sho83 (1983)) have published earlier data, from 1979 using the old WSRT line backend, and from 1981/2 with the VLA. They report a fairly consistent continuum flux density of 800 mJy in 1979, and a peak optical depth of only 1%, but we have the impression that, in view of the lower sensitivity and possible spectral baseline uncertainties evident in their figures, the peak depth is not inconsistent with the 2% seen in 1982/3 by vG86. However, even despite the limited sensitivity and spectral resolution, it looks like in the oldest spectra, the absorption in the lower velocity range might be at least as deep as the high velocity absorption, whereas in both the 1982/3 spectrum and in our 1998 data convolved to 20 km s-1 resolution, the high velocity system optical depth is at least a factor of 2 in excess of the optical depth at lower velocities. All of these changes can be easily understood since the absorption at the different velocities covers regions of the jet which have a typical size of 1 pc or even rather less, and that the emitting components move with a velocity of (Sect. 3), so that the continuum in the background of an absorber is “refreshed” entirely in a decade or less.
Optical depths ranging from 2% to 20%, and a typical FWHM of 20 km s-1, imply column depths of – cm-2, and hence densities of – cm-3 if there were a uniformly filled path-length of 0.5 pc, comparable to the transverse extent of many individual absorbers. The normalisation here adopts a typical Galactic spin temperature, K, but conditions close to an AGN (e.g., Maloney et al. mal96 (1996)) may well raise this by one or two orders of magnitude.
6 Molecular gas
It is clear from Figs. 13 and 14 that while the deepest OH absorption feature, 0.4% in the 1667 MHz line near 1640 km s-1, corresponds to that originally detected by Omar et al. (oma02 (2002)), 18 cm OH is in fact detectable over a wide range in velocity. The frequency difference of 2.0 MHz between the 1667 and 1665 MHz main lines could potentially be confused with a velocity difference of 350 km s-1 in the same line. That is somewhat more than the velocity range seen in Hi absorption, and indeed, it seems from Fig. 13, where the velocity interval 1430–1780 km s-1 is indicated for both lines, that it is fortunately just possible to discriminate uniquely between the two lines. Having extracted both of the main lines from the single WSRT spectrum shown in Fig. 13, we see in Fig. 14 that their profiles match strikingly well, which is further evidence that the velocity range over which detectable OH occurs does not exceed 350 km s-1 and that there is thus no significant overlap in the spectrum between the OH main lines. The peak absorption depth in the 1667 MHz line is about 0.4% at 1640 km s-1 and suggests a column depth of the order of cm-2 if we take a line width of 20 km s-1 and K. Figure 14 shows that the ratio between the OH 1667 and 1665 MHz lines ranges from near 1 at low velocities to approximately 2 in the high velocity system. The ratio in local thermal equilibrium (LTE) would be 1.8, but at the densities that prevail in the interstellar medium it is expected that OH is hardly ever thermalised.


We have also been able to detect with high confidence the satellite 18 cm OH lines, 1612 and 1720 MHz, in the high velocity system, around 1640–1650 km s-1; the profiles are shown in Fig. 14 along with the main lines. While, just like the main lines, the 1612 MHz line is in absorption, with a peak optical depth of about 0.4%, the 1720 MHz line is in emission, with about equal strength ! There is some evidence in the spectrum for the occurrence of the 1720 MHz line in the low velocity system, around 1470 km s-1, again in emission, but we regard this as quite tentative. Our sensitivity to features in the 1612 MHz line at these velocities was decreased by RFI. Thus, the two satellite OH lines probably have conjugate (i.e. mirror image emission and absorption) profiles. This has been known in Galactic conditions and has been observed in Cen~A (van Langevelde et al. van95 (1995)) and NGC 253 (Frayer et al. fra98 (1998)). Generally, it results from excitation of OH molecules in a far infra-red (FIR) radiation field when the OH column density is sufficiently large and the FIR OH lines become optically thick. The behaviour was successfully modelled for Cen~A in a non-LTE approach by van Langevelde et al. (van95 (1995)); competing pumping mechanisms determine which line is in emission and which one in absorption in specific density and temperature regimes. It appears that the NGC 1052 observations, where the main lines have a ratio close to the LTE value and the satellite lines show conjugate behaviour, resemble the conditions close to the Cen~A circumnuclear disk. In NGC 1052 there is also a circumnuclear infrared excess (Becklin et al. bec82 (1982)), and we favour an interpretation in which this OH absorption occurs in the nuclear region. We plan to model this in more detail when VLBI spectral imaging of the OH lines is available to constrain the geometry.
7 Discussion
The general picture which emerges from the data presented in the previous sections supports the scenario often invoked in AGN (unification) models. The central engine produces twin radio jets, which lie along the polar axis of a toroidal or disk-like region into which matter is accumulating. However, some important questions remain.
The jet velocity in NGC 1052 is only mildly relativistic, rather than approaching the velocity of light, as in many other AGN. Our observations may refer only to a slowly moving external surface of the jets, so that the radiation from a faster moving central spine is undetectable because it is beamed away from the line of sight. However, NGC 1052 is one of the lowest luminosity galaxies in which a jet velocity has been measured to date. It is quite possible that low luminosity objects intrinsically have slower jets on average.
The combination of free-free absorption, from a geometrically thick, albeit patchy, ionised structure covering the inner parsec, and Hi atomic gas predominantly in an annulus 1–2 pc around the centre, is quite natural in principle. The innermost region and/or the surface of the accretion disk or torus receive the most intense radiation from the AGN, and thus have the largest degree of ionisation. Indeed, recent work by Weaver et al. (wea99 (1999)), Guainazzi & Antonelli (gua99 (1999)), Guainazzi et al. (gua00 (2000)), and Kadler et al. (2002a ) has shown the presence of large column depths (=1022–1024 cm-2) of soft X-ray absorbing gas along our line of sight to the nuclear continuum source. Furthermore, some models of the X-ray spectral details suggest that the distribution of the absorbing gas is patchy, or that two components with a substantially different density are involved, matching the evidence we see for patchiness also in the radio spectra and flux density evolution of different jet components at various distances from the core. The detection by Barth et al. (bar99 (1999)) of a broad H emission line, visible only in polarised (scattered) light, is also evidence for obscuration by a canonical equatorial torus or disk. But several inconsistent reports on the (non)detection of CO emission and absorption (Wiklind et al. wik95 (1995); Wiklind et al. wik95 (1995); Knapp & Rupen kna96 (1996)) have left the amount of molecular gas near the nucleus uncertain.
However, the nature of the high velocity Hi absorption system is not clear. The apparent 10 km s-1 pc-1 velocity gradient could correspond to a rotation component of the motion. Naively, for matter at a distance of 1 pc from the core, this rotation would imply a modest enclosed mass of about 107 M⊙, but we suspect that the actual geometry is rather more complex. In particular, this system is redshifted by 130–200 km s-1 compared to the stellar recession velocity of NGC 1052. Since the spatial distribution strongly suggests that the gas is quite local to the AGN environment, it is most likely fairly cohesively falling in to the nucleus. One might speculate that this is the result of recent accretion of gas due to (a series of) mergers. NGC 1052 has complex, probably triaxial kinematics on arcsecond scales, as revealed by optical spectroscopy (Plana & Boulesteix pla96 (1996)) and radio observations of Hi (vG86), and it is not obvious how these large-scale motions connect to those of parsec-scale features. Under an inflow scenario, we are puzzled by the absence of Hi absorption towards the innermost approaching jet, given that the three dimensional distance to the ionising central source may then not differ very much from that of gas seen 1–2 pc away from the nucleus in projection on either side. We point out, incidentally, that the radio jets do not appear to be “significantly” oriented with respect to the isophotal or rotation axes of either the stellar body or the neutral or ionised gas in NGC 1052, despite early suggestions to the contrary (Jones et al. jon84 (1984); Davies & Illingworth dav86 (1986); vG86). While the initial direction of ejection is most likely determined by the rotation of the black hole, it is unclear what determines the subsequent bending.
While the WSRT observations of the 18 cm OH lines in NGC 1052 do not resolve the arcsecond-scale source, we believe that it is likely that in the high velocity system the OH lines are due to molecules situated towards the eastern, approaching jet, at distances of 1–2 pc from the core, just like the Hi line. We know from our 1997 18 cm continuum VLBA data that the receding jet contained a flux density of only 20 mJy, so that the the local OH opacity in the 1667 MHz line would have to be as high as 25% if the absorption were to occur only on that side. Just as importantly, the high velocity part of the OH profile matches that of the integrated Hi absorption rather well (Fig. 14). The peak Hi absorption depth is 5% of the total flux density, as compared to 0.4% in OH. Remembering that this is based on values integrated over the source, and with a 3.5 year time difference, we find that the opacity ratio of 12:1, which converts to a column depth ratio of (naively taking K for Hi and K for OH), matches very well the models of Maloney et al. (mal96 (1996)) for conditions near an AGN.
While we cannot rule out that the “low velocity” Hi and OH absorption is the result of a long path length through the galaxy, the OH excitation points toward an association of this gas with the nuclear region. The sharper, localised Hi absorption lines also have no clear counterpart in OH, although the spectral resolution in OH was a factor 2–4 lower. Perhaps these are clouds with a different ionisation parameter and a lower fraction of molecular gas.
It is also possible that there are at least a few differently distributed molecular gas components present in the circumnuclear medium. Claussen et al. (cla98 (1998)) have found H2O maser emission, indicating the presence of molecular gas at 0.1–0.2 pc to the west of the core, along the receding jet (note that the zero point in the images of Claussen et al. (cla98 (1998)) is not on the core, since they did not have the benefit of multi-epoch and multi-frequency datasets). Possibly, these masers are excited by interaction with the jets. We have no explanation, however, for the fact that while the H2O masers have the same speeds as the “high velocity system”, they appear to have a different location than the majority of the Hi and OH line producing gas.
Remarkably, therefore, in the complex accretion region, which the inner parsec around the AGN surely is, it appears possible for some molecular and atomic clouds to preserve a relatively quiescent existence, with apparently highly ordered motions of the high velocity system, and kinematically fairly undisturbed separate sharp Hi absorbing clouds. There are other active galaxies in which somewhat similar obscuring regions have been found, but they each seem to have their own peculiarities. For example, Kaastra et al. (kas02 (2002)) find at least three components with different ionisation parameters in X-ray absorption towards NGC 5548, with variable broad lines showing a location between 1014 and 1016 cm. In NGC 1275 VLBI data show that the approaching jet is apparently not covered by free-free absorption, but the inner portion of the counter-jet is hidden behind a thick or warped disk (e.g. Walker et al. wal00 (2000); Levinson et al. lev95 (1995)). In NGC 4261 Jones et al. (jon01 (2001)) find evidence for a geometrically thin obscuring disk. There is also Hi absorption in NGC 4261, but in this case, van Langevelde et al. (van00 (2000)) have found that it occurs only towards the counter-jet, and that the column depth is only cm-2. As a final example, in NGC 5793, Pihlström et al. (pih00 (2000)) find that there are Hi absorption components at several velocities, which each cover a different VLBI continuum component, and they span a region of 30 pc, rather larger than in NGC 1052. It is also intriguing to extend the comparison with NGC 5793 to molecular gas. The 1667 and 1665 MHz OH main lines have been imaged in absorption by Hagiwara et al. (hag00 (2000)). Their extent is somewhat uncertain, but is at least 5 pc. Interestingly, there is a 9 km s-1 pc-1 velocity gradient across the source, but in this case it is centred on . There is also H2O maser emission in NGC 5793, but at another position and a blue-shifted velocity (Diamond et al. dia01 (2001)).
8 Summary
We have presented and discussed multiple VLBA continuum and spectral line imaging and WSRT spectroscopic observations of the compact variable nuclear radio source in the nearby active galaxy NGC 1052. Our main conclusions can be summarised as follows:
1. The radio source consists of slightly curved bi-symmetric jets with multiple sub-parsec scale features.
2. There are outward motions, reasonably linear on the sky and constant over time, of typically ( km s-1 Mpc-1) on each side.
3. Symmetry shows that the jets are oriented near the plane of the sky.
4. Spectral shapes of jet components ranging from steep, through convex, to highly inverted suggest that synchrotron self-absorption and free-free absorption are both at play along the inner parsecs of the jets.
6. Free-free absorption leads to an asymmetric central gap opening up towards lower frequencies. Thus, the western jet is receding, and is partially obscured along at least 1 pc.
7. The eastern jet is approaching, but is still partially covered along approximately 0.3 pc. This probably indicates a geometrically thick absorber, oriented roughly orthogonal to the jets.
8. Globally, the free-free opacity drops with increasing distance from the centre, but component variability suggests patchiness of the absorber. The highest turnover frequency of 43 GHz indicates a volume density of cm-3 if the free-free absorbing gas were distributed uniformly along a path-length of 0.5 pc.
9. Hi atomic gas absorption is distributed in front of the approaching as well as the receding jet and has sub-pc scale structure. We distinguish three absorption systems with different characteristics.
10. “High velocity” Hi gas, receding by 125–200 km s-1 with respect to the systemic velocity of NGC 1052 ( km s-1), shows the most prominent absorption.
11. The high velocity Hi absorber may have a continuous velocity gradient across the nucleus of some 10 km s-1 pc-1, to connect a 20–25% deep feature around 1620 km s-1 1.5 pc away from the core along the receding jet, with 5–10% deep features near 1640 and 1650 km s-1 located 1 and 1.5 pc away from the core along the approaching jet.
12. The innermost parsec (of the approaching jet) shows a deficit of this high-velocity component, which shows that it is local to the AGN. The atomic gas in the “central hole” may be largely ionised due to the proximity to the AGN; this is the location of the deepest free-free absorption.
13. A broad, shallow Hi absorption component, with a peak depth of about 2%, spans the “low velocity” range 1440–1570 km s-1, asymmetrically straddling the systemic velocity. It covers all jet components in which we have the sensitivity to detect it, and could arise either in gas local to the AGN or on galactic scales.
14. Sharper Hi features, having widths of 3–15 km s-1 and depths up to 5%, are superimposed in the range 1500–1570 km s-1. These features each extend over only a few tenths of a pc and can be detected at various places along the inner 2 pc of the approaching jet.
15. Since the absorbing neutral gas has structure on scales of 0.1–1 pc, back-lit by compact, near-relativistically moving features in the jets, it is logical that the overall Hi absorption line profile of our data differs significantly from that in VLA observations taken 15 years earlier.
16. The 1667 and 1665 MHz 18 cm OH main lines are clearly present in absorption along the full velocity span seen also in Hi, roughly 1440–1670 km s-1. The peak absorption depth in the 1667 MHz line is about 0.4% at 1640 km s-1, suggesting a column depth of order cm-2. The ratio between the OH 1667 and 1665 MHz lines ranges from near 1 at low velocities to approximately 2 in the high velocity system.
17. The 1612 and 1720 MHz 18 cm OH satellite lines have also been detected, in the high velocity system at 1630–1650 km s-1. The 1612 MHz line is in absorption, but the 1720 MHz line is in emission, both with a peak strength near 0.25%. Their conjugate profiles resemble the behaviour in Cen~A and NGC 253.
18. The OH main line and the total Hi profiles are remarkably similar in the high velocity system, and we suggest co-location of these high velocity atomic and molecular gas components. They probably do not coincide with the H2O masers at 0.1–0.2 pc along the receding jet, even though these are at the same velocity.
19. Other questions also remain regarding the nature of the high velocity system. Interpretation of the velocity gradient in Hi as evidence for a structure rotating around the nucleus is contradicted by the fact that the centroid is redshifted by 150 km s-1 or more from the systemic velocity. But if it is instead infalling gas, the nature of the central hole in Hi is unclear.
Acknowledgements.
We thank the staff of the VLBA and the WSRT for their extensive support. The VLBA is an instrument of the NRAO, a facility of the National Science Foundation of the USA, operated under cooperative agreement by Associated Universities, Inc. The WSRT is operated by ASTRON (The Netherlands Foundation for Research in Astronomy) with support from the Netherlands Foundation for Scientific Research (NWO). This work is also based on observations with the 100-m telescope of the MPIfR (Max-Planck-Institut für Radioastronomie) at Effelsberg. This work was initially supported in part by the US National Science Foundation under grant AST-9420018, and has made use of NASA’s Astrophysics Data System (ADS), and the NASA/IPAC Extragalactic Database (NED) which is operated by the Jet Propulsion Laboratory, California Institute of Technology, under contract with NASA. We are grateful to Frodo Wesseling for assistance with the data reduction, and to Dan Homan, Matthias Kadler and Matt Lister for helpful discussions and suggestions. We thank Gabriele Giovannini for prompt and helpful comments as referee.References
- (1) Antonucci, R. 1993, ARA&A, 31, 473
- (2) Barth, A. J., Filippenko, A. V. & Moran, E. C. 1999, ApJ, 515, L61
- (3) Becklin, E. E., Tokunaga, A. T., & Wynn-Williams, C. G. 1982, ApJ, 263, 624
- (4) Braatz, J. A., Wilson, A. S., & Henkel, C. 1994, ApJ, 437, L99
- (5) Carter, D., Jorden, P. R., Thorne, D. J., Wall, J. V., & Straede, J. C. 1983, MNRAS, 205, 377D
- (6) Claussen, M. J., Diamond, P. J., Braatz, J. A., Wilson, A. S., & Henkel, C. 1998, ApJ, 500, L129
- (7) Cohen, M. H., Cannon, W., Purcell, G. H., et al. 1971, ApJ, 170, 207
- (8) Davies, R. L., & Illingworth, G. D. 1986, ApJ, 302, 234
- (9) Diamond, P. J., Nakai, N., & Kawabe, R. 2001, ApJ, 560, 119
- (10) Frayer, D. T., Seaquist, E. R., & Frail, D. A. 1998, AJ, 115, 559
- (11) Gabel, J. R., Bruhweiler, D. M., Crenshaw, D. M., Kraemer, S. B., & Miskey, C. L. 2000, ApJ, 532, 883
- (12) Guainazzi, M., & Antonelli, L. A. 1999, MNRAS, 304 L15
- (13) Guainazzi, M., Oosterbroek, T., Antonelli, L. A., & Matt, G. 2000, A&A, 364, L80
- (14) Hagiwara, Y., Diamond, P. J., Nakai, N., & Kawabe, R. 2000, A&A, 360, 49
- (15) Heeschen, D. S. 1968, ApJ, 151, L135
- (16) Heeschen, D. S. 1970, ApL, 6, 523
- (17) Heeschen, D. S., & Puschell, J. J. 1983, ApJ, 267, L11
- (18) Jones, D. L., Wrobel, J. M. & Shaffer, D. B. 1984, ApJ, 276, 480
- (19) Jones, D. L., Wehrle, A. E., Piner, B. G., & Meier, D. L. 2001, ApJ, 553 968
- (20) Kaastra, J. S., Steenbrugge, K. C., Raassen, A. J. J., et al. 2002, A&A, 386, 427
- (21) Kadler, M., Ros, E., Kerp, J., et al. 2002a, Constraints on the circumnuclear absorber in NGC 1052 from Radio and X-ray observations, in Proceedings of the 6th European VLBI Network Symposium, ed. E. Ros, R. W. Porcas, A. P. Lobanov, J. A. Zensus (Max-Planck-Institut für Radioastronomie, Bonn, Germany), 167
- (22) Kadler, M., Ros, E., Zensus, J.A., Lobanov, A.P., & Falcke, H. 2002b, NGC1052 - a study of the pc-scale twin jet, in SRT: the impact of large antennas on Radio Astronomy and Space Science, SRT Conference Proceedings, (Stazione Astronomica di Cagliari: Cagliari, Italy) Vol. 1, in press
- (23) Kameno, S., Sawada-Satoh, S. Inoue, M., Shen, Z.-Q., & Wajima, K. 2001, PASJ, 53, 169 (Ka01)
- (24) Kellermann, K. I., Vermeulen, R. C., Zensus, J. A., & Cohen, M. H. 1998, ApJ, 115, 1295 (K98)
- (25) Kellermann, K. I., Vermeulen, R. C., Cohen, M. H., & Zensus, J. A. 1999, BAAS, 31, 856 (K99)
- (26) Knapp, G. R., & Rupen, M. P. 1996, ApJ, 460, 271
- (27) Levinson, A., Laor, A., & Vermeulen, R. C. 1995, ApJ, 448, 589
- (28) Maloney, P. R., Hollenbach, D. J., & Tielens A. G. G. M. 1996, ApJ, 466, 561
- (29) O’Dea, C. P. 1998, PASP, 110, 493
- (30) Omar, A., Anantharamiah, K. R., Rupen, M., & Rigby, J. 2002, A&A, 381, L29
- (31) Paragi, Z., Vermeulen, R. C., Fejes, I., et al. 1999, A&A, 348, 910
- (32) Plana, H., & Boulesteix, J. 1996, A&A, 307, 391
- (33) Pihlström, Y. M., Conway, J. E., Booth, R. S., Diamond, P. J., & Koribalski, B. S. 2000, A&A, 357, 7
- (34) Sargent, W. L. W., Schechter, P. L., Boksenberg, A., & Shortridge, K. 1977, ApJ, 212, 326
- (35) Shostak, G. S., Sanders, R. H., Goss, W. M., et al. 1983, A&A, 119, L3
- (36) Sil’chenko, O. K. 1995, Astro. Lett., 21, 283
- (37) van Gorkom, J. H., Knapp, G. R., Raimond, E., Faber, S. M. & Gallagher, J. S. 1986, AJ, 91, 791 (vG86)
- (38) van Langevelde, H. J., van Dishoeck E. F., Sevenster M., Israel F. P., 1995, ApJ, 448 L123
- (39) van Langevelde, H. J., Pihlström, Y. M., Conway, J. E., Jaffe, W., & Schilizzi, R. T. 2000, A&A, 354, L45
- (40) Vermeulen, R. C., Schilizzi, R. T., Spencer, R. E., Romney, J. D., & Fejes, I, 1993, A&A, 270, 177
- (41) Walker, R. C., Dhawan, V., Romney, J. D., Kellermann, K. I., & Vermeulen, R. C. 2000, ApJ, 530, 233
- (42) Wang, Z., Kenney, J. D. P., & Ishizuki, S. 1992, AJ, 104, 2097
- (43) Weaver, K. A., Wilson, A. S., Henkel, C., & Braatz, J. A. 1999, ApJ, 520, 130
- (44) Wiklind, T., Combes, F., & Henkel, C. 1995, A&A, 297, 643
- (45) Wrobel, J. 1984, ApJ, 284, 531
- (46) Zensus, J. A., Ros, E., Kellermann, K. I., et al. 2002, AJ, 124, 662