Imaging in Hard X-ray Astronomy
Abstract
The energy range of hard X-rays is a key waveband to the study of high energy processes in celestial objects, but still remains poorly explored. In contrast to direct imaging methods used in the low energy X-ray and high energy gamma-ray bands, currently imaging in the hard X-ray band is mainly achieved through various modulation techniques. A new inversion technique, the direct demodulation method, has been developed since early 90s. With this technique, wide field and high resolution images can be derived from scanning data of a simple collimated detector. The feasibility of this technique has been confirmed by experiment, balloon-borne observation and analyzing simulated and real astronomical data. Based the development of methodology and instrumentation, a high energy astrophysics mission – Hard X-ray Modulation Telescope (HXMT) has been proposed and selected in China for a four-year Phase-A study. The main scientific objectives are a full-sky hard X-ray (20-200 keV) imaging survey and high signal-to-noise ratio timing studies of high energy sources.
Physics Dept. and Center for Astrophys., Tsinghua University, Beijing
Institute of High Energy Physics, Chinese Academy of Sciences, Beijing
1. Introduction
The hard X-ray band with photon energies from keV to a few hundred keV is very important for the study of high energy processes near compact objects, super-massive black holes and in relativistic outflows. Astronomical imaging in hard X-rays is still an observational problem. This is because high energy photons in this range can neither be focused like lower energy photons, nor can their arrival direction be determined from Compton scattering or e± pair production as in the high energy -ray range. Due to the technological difficulties no detailed all-sky map of hard X-rays has been provided yet.
In contrast to direct imaging methods used in the optical and soft X-ray bands, currently imaging in the hard X-ray band is mainly achieved through various modulation techniques. M. Oda (1965) proposed that a collimator composed of two parallel grids of wires, scanning cross a X-ray source over a detector, could reveal the positional information of the source. After then the rotation modulation collimator (RMC) technique (Schnopper et al. 1968; Willmore 1970) and coded aperture mask (CAM) technique (Dick 1968; Ables 1968) were developed with good angular resolution and a wide field of view (FOV) for hard X-ray imaging. By rotating the modulation grids, a periodic modulation of the source flux is introduced which contains unique information on the position and intensity of the sources in the FOV. Images are obtained with the aid of Fourier analysis or cross-correlation analysis. Composite-aperture telescopes, e.g. multipitch telescopes, may be used in order to reduce the side lobes and perform imaging of diffuse sources. Currently, in hard X- ray imaging observations, the CAM is widely used. Modulated spatially by the coded aperture mask, the incident photons are recorded by a position sensitive detector. The true spatial intensity distribution is reconstructed from the observational data by using the cross-correlation analysis method or other mathematical decording techniques. The coded aperture mask technique is most widely used in hard X-ray imaging: modulated spatially by the coded aperture mask, the incident photons are recorded by a position sensitive detector. The true objective distribution is reconstructed from the observational data by using the cross-correlation (CC) technique or other inversion methods. Due to the position sensitive detector a hard X-ray coded aperture telescope is fairly complicated and expensive. The intrinsic angular resolution of a coded aperture mask instrument can be estimated by , where is the detector-mask pixel size and the distance between the mask and detector plane. With a limited position resolution of the detector, say 1 cm, the telescope can reach a length of m to get about angular resolution, which leads to large structure, heavy weight and difficulties in suppressing the local background. The effective area is reduced to half or more due to the occultation of the mask and a wide field of view will lead to a higher background through the aperture. Complicated image distortions (e.g. side lobes, pseudo images etc.) are usually appeared in images obtained by coded aperture telescopes, which strongly reduce the angular resolution and imaging capability for weak sources.
Since early 1990s a direct demodulation method has been developed. The direct demodulation technique can extract the information on the observed object from the observational data more sufficiently than conventional inversion techniques, with which one can perform wide field and high resolution imaging with a non-position-sensitive detector and relatively simple modulation methods.
2. Direct Demodulation Method
In observations with any kind of telescopes, the relation between the observational data and the intensity distribution of a sky region can be described by the following observation equation (modulation equation):
| (1) |
where , the modulation coefficients of the telescope, represent the instrument response character. The equation system (1) can be written in matrix form as
| (2) |
Since early 1990s the direct demodulation (DD) technique has been developed (Li & Wu 1992; 1993; 1994) for deriving high spatial resolution maps from incomplete and noisy data. The DD technique reconstructs the object from the observed data by directly solving the observation equations. In general the modulation matrix is not a square one and the observation equation system is unsolvable. We can first multiply two sides of Eg. (2) by the transpose, , of the modulation matrix to obtain a new equation system
| (3) |
where . The matrix of coefficients, , in the correlation equations (3) is then a positive definite symmetric matrix. The DD technique performs a deconvolution from by iteratively solving Eg. (3) under some proper physical constraints ( Li & Wu 1994). The formula of DD algorithm by using the Gauss-Seidel iterations is
| (4) |
with the constraint condition
| (5) |
where the lower intensity limit is the background intensity.
The iterative process described in equation (4) under the nonlinear constraint (5) is in fact a sort of artificial neural network computing (Li 1997). Let , the DD algorithm (4), (5) can be represented by the state transfer equation of a continual Hopfield network (Hopfield 1984)
| (6) |
where is the output of neuron , the threshold of neuron , the weight from the output of neuron to the input of neuron , and the transfer function is a nonlinear ramp function
| (7) |
Figure 1 shows a three-neuron network representing the DD algorithm. Cohen and Grossberg (1983) have shown that recurrent networks are stable if the weight matrix is symmetrical with zeros on its main diagonal and the inverse function of transfer function is continual and monotonously increasing. It is easy to see that the network defined by (6) and (7) satisfies the above mentioned conditions. Therefore the direct demodulation calculations always converge to a stable solution, a globally optimal one in the meaning of the Liapunov energy function being minimum.

An alternative algorithm of direct demodulation is to solve the observation equation system (1) by Richardson-Lucy iteration (Richardson 1972; Lucy 1974) under the background constraint:
| (8) |
The DD method is a general inversion method, which can be used to deal with observational data obtained by different kinds of instrument and has been used to analyze data from both simulations and real space experiments with various types of telescope. The results obtained show that the DD technique can improve the spatial resolution and sensitivity significantly. Mont Carlo simulations show that, comparing with the conventional cross-correlation deconvolution technique the DD technique can improve the image quality for rotation modulation telescope (Chen et al. 1998) and coded mask telescope (Li 1995). Figure 2 shows the simulation results of the DD image reconstruction for a rotating modulation telescope (Chen et al. 1998). The image reconstructed from a object shown in Fig. 2(a) with the cross-correlation and with the DD technique are shown in figures 2(b) and 2(c), respectively. From figure 2(c) one can see that with the DD technique much better reconstruction for point source, extended source and flat background can be obtained.

The DD technique has been successfully applied to improving the angular resolution of the Wolter I type telescope PSPC aboard ROSAT mission (Chen et al. 1998). A strong evidence for an X-ray jet associated with SNR G54.1+0.3 has been found with PSPC/ROSAT and DD technique (Lu et al. 2001).
To construct intensity map from the Compton telescope with unusual modulation function and 3-D data space is a difficult task in space high energy astronomy. The DD technique has also been successfully applied to high resolution imaging of the double Compton scattering telescope COMPTEL on board CGRO. By using this technique Zhang et al. (1998) re-analyzed the data from the COMPTEL observation of PKS0528+134 during the 1993 March flare in -rays; the result revealed new information about the flare activity of the Blazar. As an example of DD images from Compton telescope, figure 3 shows the first 10-30 MeV map of the Geminga pulsar in the phase region of peak 1 determined by the light curve of the Geminga pulsar from the EGRET data in the same observing period (Zhang et al. 1997).

The COMPTEL observation of the -ray burst GRB 910601 has been re-analyzed using the DD method (Zhang 1998). The location of GRB 910601 derived from the DD imaging is closer to the annulus obtained by the Ulysses-BATSE system than that from the maximum-likelihood method.
The all-sky monitor (ASM), aboard the Rossi X-ray Timing Explorer (RXTE), consists of one-dimensional position-sensitive counters mounted on a motorized rotation drive viewing the sky through slit masks. Intensities of sources listed in a master catalog of X-ray sources with known positions are obtained via least squares fits of shadow patterns to the data (Levine et al. 1996). Song et al. (1999) has successfully performed image reconstruction from ASM/RXTE data with the DD technique without using any a prior knowledge about the sources. Figure 4 shows a DD image with ASM/RXTE data and DD technique.

The DD technique has been applied to derive high resolution maps from scanning observations by non-position-sensitive detectors. The European X-ray satellite EXOSAT, in a survey mode, made scanning observation of the galactic plane with its medium energy (2-6 keV) collimated detector, ME, which had a spatial resolution of (FWHM). The data analysis technique used by the EXOSAT team at that time was unable to resolve some of the complex regions (Warwick et al. 1988). Lu F.J. et al. (1996) re-analyzed the EXOSAT-ME scan data using the DD technique and got new X-ray maps of the Galactic plane which are much better than those made by the traditional cross-correlation method. For example, the region around is a confused region in the previous analysis, but with the DD technique a well resolved X-ray map is derived successfully. Figure 5(b) is the X-ray map of this region derived with the DD technique, revealing quite a few point sources in an region. In comparison, figure 5(a) is the cross-correlation map. All point sources in Fig. 5 observed by the DD technique have been confirmed by X-ray imaging telescopes, including the weak source DD 1701-380 confirmed later by 2E 1701.1-3804 found in accumulative data of Einstein Observatory ( Thompson et al. 1998).

Another example is for the hard X-ray survey telescope HEAO1-A4, which consists of two similar detectors with 100 cm2 sensitive area, in the 13–180 keV energy range, and FOV of (FWHM) each (Matteson 1978). The two detectors rotate around the pointing axis clockwisely and counter-clockwisely by 30∘, respectively. The detectors scan the sky by the orbit precession of the satellite (Levine et al. 1984). No traditional technique can produce meaningful images from the HEAO1-A4 data. However, good quality images have been derived with the DD technique. Figure 6(b), as an example, is a direct reconstruction from the scanning observation data of HEAO1-A4 for the Galactic center region, where the crosses mark the positions of the known hard X-ray sources (Lu F.J. et al. 1995). Again, in comparison, figure 6(a) gives the cross-correlation map of the same data.

3. The Hard X-ray Modulation Telescope HXMT
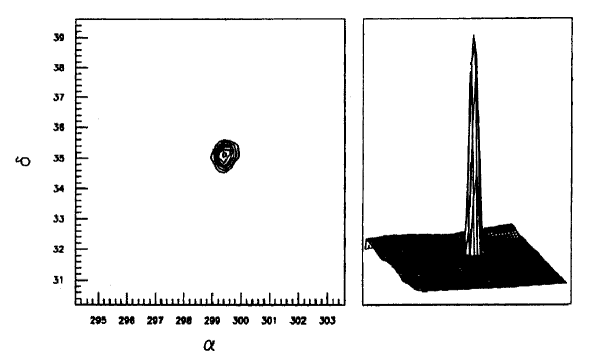
The possibility of a collimated telescope to perform high resolution imaging with scan observation and DD technique (Li et al. 1993; Li & Wu 1994) has been proved by the results of reanalyzing space data, shown in Figs. (5) and (6), and by raster scan imaging experiments in the laboratory and balloon flight with the hard X-ray telescope HAPI-4 (Lu Z.G. et al. 1995). The balloon-borne telescope HAPI-4 is a slat-collimated hard X-ray telescope of the Institute of High Energy Physics (IHEP),Beijing, in cooperation with the Moscow Engineering Physics Institute of Russia and Astronomisches Institut, Universitaet Tuebingen of Germany. The telescope consists of a collimated multiple wire proportional counter (MWPC) and NaI(Tl)/CsI(Na) phoswich detector. The effective area of both the MWPC and the phoswich detector is 1600 cm2 each and the energy range is 10-400 keV (10-100 keV when only the MWPC are used). The collimator is made of lead slats, which define a FOV of 3∘3∘ (FWHM). A raster scan modulation imaging experiment for radioactive sources in the laboratory with HAPI-4 has been done and the observed data were analyzed with the DD technique. The derived positions and flux of the radioactive sources are consistent with the true values. On September 25, 1993, at the altitude of about 35 km over Beijing at a northern latitude of 40∘ a raster scan observation of the Cygnus region was performed for about one hour by HAPI-4. The observed data were analyzed with DD technique (Lu Z.G. et al. 1995). The derived X-ray image of the Cygnus region is shown in figure 7.
Based the development of methodology and instrumentation, a Chinese high enerrgy astrophysics mossion – Hard X-ray Modulation Telescope (HXMT) has been proposed. In the energy range of 10 - 200 keV, HXMT can make full-sky hard X-ray survey with high spatial resolution, deep imaging observations of selected sky regions, and high sensitivity pointing observations of scientific hot spot sources for detailed temporal and spectral studies.
The detector of the HXMT consists of 18 same hexagonal prism NaI(Tl)/CsI(Na) phoswiches (Figure 8), the area of single module is 286 cm2, then the total detecting area is 5148 cm2. The primary detector of each module is a NaI(Tl) crystal with the thickness of 3 mm, and a 500 m thick Be slice is used as the incident window. A CsI(Na) crystal of 3 cm thick is placed at the back of the primary crystal to act as an anticoincidence shield: it stops the hard X-ray and -ray background of the lower 2 solid angle (assuming the telescope is pointing upwards) and reduces the effect of Compton scattering in the primary counter. The two kinds of crystals are optically coupled. Fluorescence photons are received by a photomultiplier (PMT) for each phoswich module. A pulse shape discrimination circuit (PSD) is used to distinguish the two kinds of pulses with different fluorescent decay times. In front of the primary detector a plastic scintillator with thickness 2 mm is used to distinguish charged particles.
In high sensitivity observation, the angular resolution is very important to avoid the confusion of point sources. The principal objective of the HXMT is to obtain the map of hard X-ray sky by the aid of the direct demodulation technique. The designed 10′ angular resolution and 1′ source location precision of the HXMT can help to accomplish the identification of sources in radio, optical and soft X-ray bands, on the other hand, images of the extended sources like the Galactic plane, the Galactic halo, clusters and SNRs can also be obtained. Imaging for a wide field and increasing exposure time during scanning observation require a wide field of view (FOV). However, a too wide FOV will damage the resolution of imaging, precision of source location and sensitivity of the instrument. After a comprehensive consideration of the requirement of imaging and flexibility of technology, the view field of the HXMT is chosen to be 5 (FWHM), which consists of 18 collimators with non-symmetric FOV of 5 (FWHM) placed with a cross angle of 10∘ one another.

The spatial resolution ability of the HXMT was studied with the high precision reconstruction for part celestial region within the FOV based on direct demodulation method. The data of deep scanning survey in a region which contains a strong source generated by computer simulation. The scan mode is: the angular differences between two sequential pointing directions is within a region near the source and 1∘ in other region. The total observation lasts 2 hours. The background intensity is assumed to be 0.02 cm-2s-1 and the source has an intensity of cm-2s-1. From the resultant image of the point source by direct demodulation process the angular resolution (FWHM) of the HXMT can be estimated as and the accuracy of source location is much better than .
The effect of the stability of satellite attitude on the HXMT spatial resolution was further studied. In a simulation the pointing axis moves along a random direction with a speed of /s for each pointing observation. The mean pointing direction of each crystal with respect to the mean pointing direction and the number of photons detected in each crystal during the observation are all calculated. The difference between the real direction of the source and its calculated value from the direct demodulation map is only about , and the angular resolution of the point source is about (FWHM).
The background was estimated with Monte-Carlo simulations and according to experiential results (Dean et al. 1989; 1990). The solid angle of collimator of HXMT is 7 times smaller that of IMAGER/INTEGRAL, which is much beneficial to reducing background of hard X-ray photons. The estimated total background rate in the energy range keV is 0.02 cm-2s-1. The following formulas are used to calculate the minimum detectable flux of a pointing observation:
for continuum spectrum and
for narrow lines. Where is the significance, (cm-2s-1keV-1) background level, (cm2) detector area, (s) observation duration, efficiency, (keV) widths of energy bands, the detection efficiency of full energy peak and (keV) the FWHM of the narrow line. It has been estimated that the expected sensitivity of HXMT at 100 keV is three times better than that of IMAGER/INTEGRAL.
HXMT can make observation in three different modes: full-sky survey, deep scanning observation of a selected region, and pointing observation. In the sky survey mode, the satellite attitude is three-axis stabilized with respect to the earth. The survey is carried through the motion of the satellite in its orbit and precession of the orbital plane. For a satellite with a low circular orbit at the altitude of 550 km and an inclination of 43∘, the scan survey is divided into three phases with roll angle being and , separately. The above scan observations will take six months to cover most of the sky. The three-phase scanning observation mode ensures that some regions can be observed up to six times. After the sky survey, HXMT will start to pointing observation of some objects and deep scanning observation of selected sky regions. In this phase the attitude of the satellite is controlled in the 3-axis stabilized mode with respect to stars in the sky. With the 3-axis stabilized mode guided by the star image, HXMT will perform scanning monitoring of the sources in the galactic plane several times for about every ten days. The time to finish a scan of the galactic plane is the orbital period of the satellite, in order not to be affected by the earth occultation.
The key performance parameters of HXMT mission are listed in Table 1.
Table 2: Key Performance Parameters of HXMT Mission
| Energy Range | 10–200 keV |
|---|---|
| Energy Resolution | @ 60 keV |
| Angular Resolution | |
| Source Location ( source) | |
| Sensitivity (, in s @ 100keV) | cm-2s-1keV-1 (continuum) |
| cm-2s-1 (narrow line) | |
| Orbit | Altitude: km circular |
| Inclination: | |
| Attitude | Three-axis stabilization |
| Control precision: | |
| Measurement accuracy: | |
| Data Rate | kbps |
| Mass | Science instrument: kg |
| Total payload: kg | |
| Nominal Mission Lifetime | 2 years |
The HXMT mission was proposed in 1994 and selected as one of the Major State Basic Research Projects in China in April, 2000 and funded by the Ministry of Science and Technology of China, Chinese Academy of Sciences and Tsinghua University. The implementation of the HXMT project is a collaboration between the Chinese Academy of Sciences (CAS) and the Tsinghua University. With the fund the detector system and the prototype of the payload are under construction. It has also been listed as a candidate of the state scientific satellites of China. International collaborations on this project are welcome. In 10 - 200 keV hard X-ray range, HXMT mission with its unprecedented sensitivity and imaging ability is expected to play an important role in space astronomy.
4. Discussion: Direct Approach to Inversion
Sufficiently using the information on the observed object is of great importance in dealing with the reconstruction problem. The observation equation system
or
contains all information about the object in the observed data obtained by the observation with an instrument . The maximum-entropy method (ME) is a widely used method of reconstructing object from observed data . ME is to choose a solution from all satisfying the statistical criterion
| (9) |
by the condition that the information entropy
| (10) |
Many informations on the object are lost when using the single equation (9) instead of the equation system (1) containing equations, that infinite intensity distribution can satisfy Eg. (9). The maximum-entropy condition (10) helps us to pick out a most smooth one from them, but not necessary the best one. Another widely used method is the cross-correlation technique, which takes the cross-correlation distribution of the data and the modulation pattern to estimate the object intensity
| (11) |
From the correlation equations
one can see , the cross-correlation is just an image of the object through a modulation (distortion) of a certain imaging instrument with a point spread function . The cross-correlation reconstruction completely ignores the information included in the correlation equations, still does not make full use of the information on the object obtained by the observation. In general the two kinds of inversion methods have no significant difference in their results, the resultant resolution are limited by the intrinsic resolution of the instrument
| (12) |
The direct decording approach, reconstructing objects by iteratively solving observational equations or correlation equations under nonlinear constraints, each iterative calculation is directly based on the modulation equation. Obviously the direct approach can use the information containing in the equations more sufficiently than any indirect one through a statistical criteria or cross-correlation transformation and then can obtain much better resolution .
With conventional techniques the resolution is limited by the intrinsic one, it does not matter how sensitive the observation is. For improving the precision and resolution of an experiment, people are usually devoted to improving the intrinsic resolution by constructing high-precision instrument, more and more complicated and high-priced. It is a most difficult task to conduct an experiment with both high resolution and high sensitivity. Under the direct inversion technique, the resultant resolution is not only dependent on the instrumental intrinsic resolution , but also dependent on the amount of observed signal, the ratio of signal to noise and modulation pattern
| (13) |
Applying the direct demodulation technique to space instrument design, we can realize high resolution imaging with a low resolution or even non-position-sensitive detector, and can conduct observations with both high resolution and high sensitivity by improving the resolution ability through increasing the detection sensitivity, as shown by the expected performance of HXMT mission.
The main difficult of the direct methods is the illness of solution causing by errors in data and other uncertainties in modulation equations. Introducing physical constraints to make nonlinear control in the iterative process of solving modulation equations is a key point to make the direct demodulation realizable, and, furthermore, stable, convergent and global optimal. Benefited from the physical constraints in iterates the effect of errors can be depressed effectively in the demodulation process. As a consequence, the direct demodulation can get images with much less false appearances and be capable of reconstructing not only discrete sources, but also extended features as well.
References
Ables J. G. 1968, Proc. Astron. Soc. Australia, 1, 172
Chen Y., Li T.P., & Wu M. 1997, in: Proc. ADASSVI, ASP conf. ser., 125, 178
Chen Y., Li T.P., & Wu M., 1998, A&AS, 128, 363
Chen Y., Song L.M., Li T.P., & Cui W. 2000, Acta Astron. Sinica, 41, 214
Cohen M. & Grossberg S. 1983, IEEE Trns. on Systems, Man and Cybernetics, 13, 815
Dean A.J. et al. 1989, A&A, 219, 358
Dean A.J. et al. 1990, Space Sci.Rev., 57, 109
Dick R. H. 1968, ApJ, 153, L101
Levine A.M. et al. 1984, ApJS, 54, 581
Levine A.M. et al. 1996, ApJ, 469, L33
Li T.P. 1995, Exper. Astron., 6, 63
Li T.P. 1997, Space observation of hard X-rays, in: Hu W.R. (ed.) Space Science in China, Gordon & Breach Science Publisher
Li T.P. & Wu M. 1992, in: Astronomical Data Analysis Software & Systems I (eds Worrall D.M., Biemesderfer C. & Barnes J.), BookCrafters, Inc., 229
Li T.P. & Wu M. 1993, Ap&SS, 206, 9
Li T.P. & Wu M. 1994, Ap&SS, 215, 213
Li T.P., Wu W., Lu Z.G., Wang J.Z. & Zhang C.S. 1993, Ap&SS, 205, 381
Lu F.J., Li T.P., Sun X.J., & Wu M. 1995, in Shellard & Nguyen (eds) Proceedings of CHEP’95, 848
Lu F.J., Li T.P., Sun X.J., Wu M., & Page C.G. 1996, A&AS, 115, 395
Lu F.J., Aschenbach B.,& Song L.M. 2001, å, 370, 570
Lu Z.G. et al. 1995, Nucl. Instr. and Meth. in Phys. Res. Sec. A, 362, 551
Lucy L.B. 1974, AJ, 79, 745
Matteson J.L. 1978, Proc. AIAA, No.78-35
Song L.M., Li T.P., Cui W., 1999, Acta Astrophys. Sinica, 19, No.1
Thompson R.J., Shelton R.G., & Arning C.A. 1998, AJ, 115, 2587
Oda M. 1965, Appl.Optics, 4, 143
Richardson B.M. 1972, J.Opt.Soc.Am., 62, 55
Schnopper H. W. et al. 1968, Space Sci. Res., 8, 534
Willmore A.P. 1970, MNRAS, 147, 387
Warwick R. S. et al. 1988, MNRAS, 232, 551
Zhang S. 1998, Acta Astrophysica Sinica, 18, 197
Zhang S., Li T.P., Wu M., & Yu W.F. 1997, in: AIP Conf. Proc., 410, 578
Zhang S., Li T.P., & Wu M. 1998, å, 340, 62