Chandra OBSERVATIONS OF TWO PULSARS PSR 0628-28 AND PSR 1813-36
Abstract
PSR 0628-28 is an X-ray emitting radio pulsar which was observed with Advanced CCD Imaging Spectrometer (ACIS) on board Chandra on 2001 November 04 and on 2002 March 25 for 2000 s and 17000 s, respectively. The source countrate was 0.01110.0013cps. Making PSR 0628-28 to be the longest period X-ray emitting pulsar. The spectral distribution of counts can be described by several model fits. A blackbody fit yields a temperature K together with cm-2 and a powerlaw fit yields a photon index of with a hydrogen column density of cm-2. Confirming the previous ROSAT pointed observation for PSR 1813-36, there was no positive detection from the 30ks Chandra ACIS observation on 2001 October 25. We obtained an upper limit for the countrate of cps.
1 INTRODUCTION
Radio channel is the best way to discover neutron stars, but their characteristics are best revealed via the X-ray observations i.e. whether it’s a cooling neutron star or not. With this in mind, we observed with Chandra two ROSAT All-Sky-Survey (RASS) pulsars, that were claimed to be detected, to confirm their detection and examine their X-ray pulses and spectra. During RASS PSR 1813-36 and PSR 0628-28 had detection likelihood just below the detection threshold, Becker et al. (1992). Therefore both pulsars had follow-up ROSAT pointed observations. PSR 1813-36 was not detected and we also report a non-detection of the source for the Chandra observation. However PSR 0628-28 was detected with 60 counts in the ROSAT pointed observation and here we report a positive detection of a point source around the pulsar’s radio position. Due to low countrate spectral analysis did not suffice to distinguish between various pulsar models such as, powerlaw spectrum or a blackbody spectrum. In this article we report on observations acquired for both pulsars, namely PSR 1813-36 and PSR 0628-28 .
2 OBSERVATIONS
2.1 PSR 0628-28
PSR 0628-28 was observed twice, one on 2001 November 04 and the other on 2002 March 25 for 2000 s and 17000 s, respectively. For both observations photons were collected using the Advanced CCD Imaging Spectrometer (ACIS; Burke et al. (1997)), which has resolution at 1 keV scaling as 1/ over its 0.2-10 keV range. The pulsar was positioned on the back-illuminated S3 chip of the ACIS-S array, offset by 0′.58 from the aim point, where the PSF is undersampled by the 0′′.49200′′.4920 CCD pixels. Data were collected in the nominal timing mode, with 1.141s exposures between CCD readouts, and in ”FAINT” spectral mode. Data reduction and analysis were performed by CIAO data analysis software package, version 2.2.1. We reprocessed the Level 1 event data to correct the detrimental effects of charge transfer efficiency. The imaging, timing and spectral analysis presented here were done only on the 17 ks observation, the 2.0 ks observation was disregarded due to an interruption by a large solar storm. The background countrate during this solar storm increased by a factor of 20. The net source countrate during the first observation period was where the error is in the 90% confidence range. Since by taking into account the 2.0 ks observation we gain only 27 counts which is not enough to improve our statistics significantly we prefered to disregard these counts, which potentially can be misleading.
The net countrate of the 17 ks observation is . We also analysed the ROSAT archival data and determined the ROSAT countrate of PSR 0628-28 which after normalizing to Chandra countrate is . The countrate of the portion of the observation that we used as can be seen is consistent within the errors with both 2.0 ks and ROSAT observations. The measured PSF of PSR 0628-28 is consistent with the ACIS point-source response, hence the ACIS image reveals a pointlike X-ray source at the pulsar position. The Chandra position of PSR 0628-28 is , (J2000.0), which considering 0.′′5 rms error and 0.′′6 absolute astrometric accuracy of Chandra , is in good agreement with the radio position of =06h30m49′′.531, (J2000.0), Taylor et al. (1993). We should also note that the Chandra position is also consistent with the ROSAT position of the PSR 0628-28 . We also took into account the proper motion of the pulsar. The Chandra position of the pulsar is 0.′′5 away from the expected position at the observation epoch which is extrapolated from the proper motion measurements taken from Taylor et al. (1993).
With this positional coincidence we can firmly say that PSR 0628-28 is one of the handful of X-ray emitting radio-pulsars.
2.2 PSR 1813-36
PSR 1813-36 was observed on 2001 October 25 for 30 ks with ACIS-S. Confirming the previous result for the ROSAT pointing observation no source was detected at the pulsar posistion of =18h17m05′′.76, =-36∘18′05′′.50 (J2000.0), Taylor et al. (1993). The observation yielded a background countrate per pixel square of 3.410-6 cps/pixel2, hence for a 50 pixel2 extraction region and a signal to noise ratio of 3 the source should have minimum countrate of 2.310-4 cps for detectability. Assuming a powerlaw like spectrum this countrate gives an upperlimit for the flux of 1.510-15 erg cm-2 s-1 , which is in the sensitivity range of ACIS-S (0.2-10 keV), for a detector ontime of 30 ks. In the same range the implied X-ray flux from spin-down energy is 2.110-15 erg s-1 , which corresponds to a luminosity of =3.71030 erg s-1 at an assumed distance of 3.8 kpc.
3 RESULTS FOR PSR 0628-28
3.1 Timing
To search for pulsations from PSR 0628-28 184 source counts were extracted from a 2′′ radius aperture around the Chandra position of the pulsar. The photon arrival times were barycenter corrected using CIAO axbary program. Then the statistic (Buccheri et al. (1983)) was calculated over a narrow range of frequencies at the expected radio frequency ( Hz, Taylor et al. (1993)) The resulting periodogram peaked at a value of at Hz referenced to the observation epoch MJD 52,358.9. Which is not consistent with the value obtained for the frequency from extrapolation of the radio ephemeris (,). A wider search including the ACIS sampling frequency of =0.8763934 Hz, showed a number of high peaks, indicating that these results are influenced by the beat frequencies between the pulsars rotation and the Chandra ACIS sampling. Continuing to investigate the folding results only around the expected pulsar frequency, we get =0.7 which is distrubuted like with 2 dof, hence the probability of getting this value or higher is 0.713 which is not too remarkable. Looking at the higher harmonics, =0.92 (the sum of 1st & 2nd harmonics), which has a random probability of 0.92 and =10.1 which has a random probability of 0.12. The conclusion which can be drawn from this is that the data was not sufficient to claim the existence of pulsed-emission.
3.2 Spectral
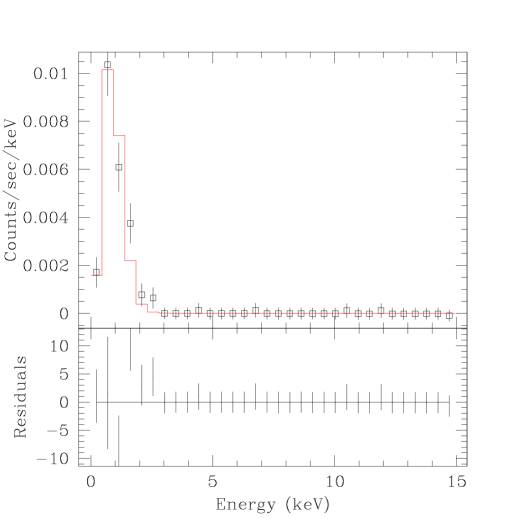
To fit a spectral model to the pulsar data we extracted the source counts from a circle of radius 2′′ and extracted the background photons from a box of dimensions 131′′135′′, which was taken considerably away from the pulsar where no other sources were present. The extraction radius of 2′′ contains 90% of the events below 2 keV. The countrates for the source and background were 0.0111 cps and 0.214 cps, respectively. The CIAO tool MKARF and MKRMF were used to build the corresponding point-source mirror response matrix. The extracted photons then were binned with 0.5 keV intervals. The resulting spectra were fitted using the generalized fitting engine of CIAO, Sherpa. Two different models were tried, a blackbody and a powerlaw model. For the blackbody fit the vs. error ellipses have been plotted in Figure 1.

The hydrogen column density that we obtained from the dispersion measure is cm-2, where we assumed a ratio of . The blackbody fit had a reduced of 0.29. The best fit parameter for this fit was keV for the surface temperature of the neutron star and cm-2 for the hydrogen column density (see Table 1). This model gives an absorbed flux of 2.0410-14 erg cm-2 s-1 in the 0.1-10 keV range, with a distance of 2.14 kpc this flux corresponds to a X-ray luminosity of =1.131031 erg s-1 , in the same range. The implied source radius is very small (0.17 km); possibly from polar caps.
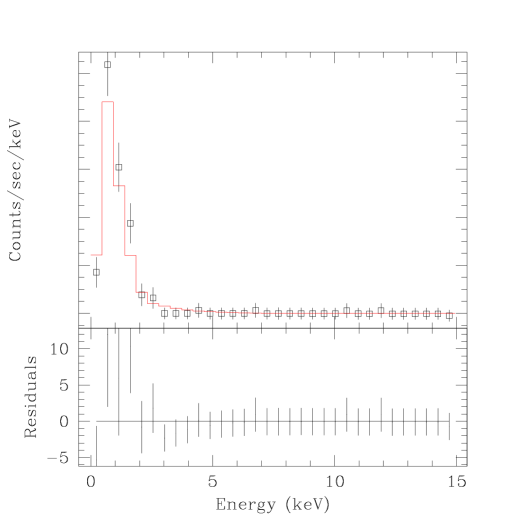
A powerlaw model also gave an acceptable fit. The reduced minimized at a value of 0.32 for the parameters and cm-2. This fit yielded a flux of 4.0610-14 erg cm-2 s-1 , which with a distance of 2.14 kpc corresponds to a X-ray luminosity of =2.251031 erg s-1 (see Figure 2).
| Model | Flux in erg cm-2 s-1 | in cm-2 | |
|---|---|---|---|
| Blackbody | keV | 10-14 | |
| Powerlaw | 10-14 |
4 SUMMARY & DISCUSSION
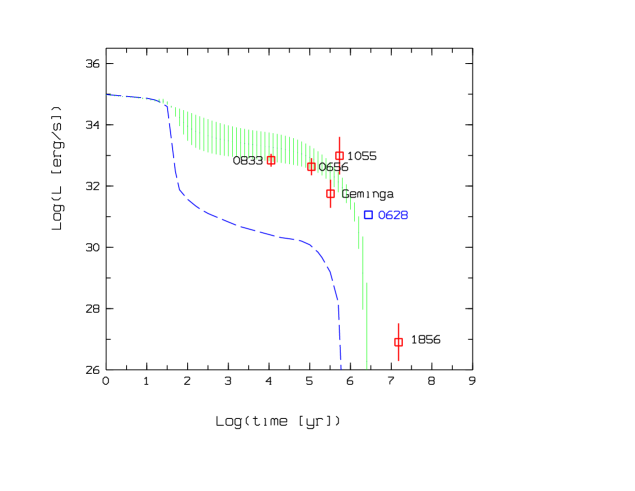
We report the discovery of X-ray emission from a long-period, (1.24s) radio-pulsar with a mild rotational energy loss-rate. Expressed in numbers, the measured power-law fit =2.251031 erg s-1 which should be compared to the 0.1% of , a robust formula which gives a good fit to the rotation-powered pulsars (Becker & Trümper (1997)). The 0.1% of is erg s-1 . Effectively the observed X-ray Luminosity is 100 times more than that predicted by the magnetospheric model. We should also note that the blackbody fit luminosity is about the same as the powerlaw luminosity. What is the source of this extra luminosity? PSR 0628-28 is an extreme pulsar long-period, small . The physical process producing the X-rays may include reheating due to vortex creep, accretion from a fall-back disc, magnetic decay like the AXPs or accretion from the ISM. Also the luminosity derived from the blackbody fit (=1.131031erg s-1 ) and the characteristic age (=2.8106 yr) of the pulsar puts it on the standard cooling curve, see Figure 3, although it is on the fast-falling, photon-cooling dominated part.
Deeper observations, to produce sufficient counts with better timing accuracy, are needed in order to resolve the issues stated above. Chandra observations have focused our attention on this extreme pulsar.
5 ACKNOWLEDGEMENTS
We thank Patrick O. Slane, Werner Becker, Roberto Mignani for useful discussions. This work has been supported by NASA Grant #02500773.
6 REFERENCES
Becker W., J. Trümper, The X-ray luminosity of rotation-powered neutron stars, Astronomy & Astrophysics 326, 682-691, 1997.
Becker W., J. Trümper, H. Ögelman, Search for cooling neutron stars in the ROSAT survey, in Isolated Pulsars, edited by Van Riper K. A., Epstein R. and Ho C., 104, Cambridge University Press, 1992.
Buccheri R., K. Bennett , G. F. Bignami et al., Search for pulsed -ray emission from the radio pulsars in the COS-B data, Astronomy & Astrophysics 128, 245-251, 1983.
Burke, B. E., J. Gregory, M. W. Bautz et al., IEEE Trans. Electron Devices, 44, 1633, 1997.
Taylor J. H., R. N. Manchester, A. G. Lyne, Catalog of 558 pulsars, Astrop. J. Suppl. Ser. 88, 529-568, 1993.