Internal Dust Correction Factors for Star Formation Rates Derived for Dusty H II Regions and Starburst Galaxies
Abstract
Star formation rates in galaxies are frequently estimated using the Balmer line fluxes of their H II regions. However, these can be systematically underestimated because dust competes for the absorption of Lyman continuum photons in the ionized gas. This factor cannot be neglected, and in this paper we present theoretical correction factors in a simple analytic form in order to allow observers to take this effect into account when estimating star formation rates from Balmer lines. These factors scale as the product of the ionization parameter, , and the nebular O/H abundance ratio, both of which can now be derived from the observation of bright nebular line ratios . The correction factors are only somewhat dependent upon the photoelectron production by grains, but are very sensitive to the presence of complex PAH-like carbonaceous molecules in the ionized gas, providing that these can survive in such an environment.
1 Introduction
A knowledge of the star formation rate (SFR) is fundamental to our understanding of the formation and evolution of galaxies. In a seminal paper Madau et al. (1996) connected the star formation in the distant universe with that estimated from low-redshift surveys, by plotting the estimated star formation rate per unit co-moving volume against redshift. A wide variety of techniques have contributed towards populating this diagram with observational points. Nonetheless, an unacceptable degree of uncertainty still attaches to our overall understanding of the evolution of star formation in the universe, and much of this uncertainty results from the effects of dust obscuration in and around the star-forming regions, particularly for those techniques which depend upon optical or UV data (see the review by Calzetti, 2001).
A fairly direct technique, which has enjoyed extensive use in the determination of star formation rates, is the measurement of hydrogen recombination line fluxes (Bell & Kennicutt, 2001; Gallego et al., 1995; Jones & Bland-Hawthorn, 2001; Moorwood et al., 2000; Tresse & Maddox, 1998; Pascual et al., 2001; Yan et al., 1999; Dopita et al., 2002b, to name but a few). Provided that the H II region can absorb all the EUV photons produced by the central star, this should be a reliable technique, since the flux in any hydrogen line is simply proportional to the number of photons produced by the hot stars, which is proportional to the birthrate of massive stars. This relationship has been well calibrated at solar metallicity for the H line (Dopita & Ryder, 1994; Kennicutt, 1998):
| (1) |
There exist a number of ways in which this relationship might break down. First, the H II region might be optically-thin to the EUV photons in some directions. In this case the recombination flux will provide an underestimate of the star formation rate, and the appropriate correction factor is difficult to estimate. Second, there may be dust in front of the H II region which both reddens and absorbs the recombination lines. In this case, the corrections for dust absorption can be made using a foreground screen approximation. This appears to work extraordinarily well in many galaxies (Bell & Kennicutt, 2001; Dopita et al., 2002b; Kewley & Dopita, 2002). Third, dust may be contained in dense, optically-thick, clouds within or surrounding the H II region. In this case the optical recombination lines are entirely absorbed in lines of sight passing through foreground clouds. However, the radio thermal continuum is transmitted by such clouds, so this factor can be estimated as a “grey” screen by comparison of the optical and the radio data. Such clouds will re-emit the incident radiation in the far-IR and this emission may also be used to estimate the stellar EUV flux.
A fourth possibility is that dust within the ionized gas itself competes with the gas to absorb the EUV photons from the central star(s). This possibility, first seriously quantified by Petrosian, Silk & Field (1972), has been discussed by a number of authors since (Panagia, 1974; Mezger, Smith, & Churchwell, 1974; Natta & Panagia, 1976; Sarazin, 1977; Smith, Biermann, & Mezger, 1978; Shields & Kennicutt, 1995; Bottorff et al., 1998). More recently its effect has investigated and quantified (as far as possible by direct observation) in a series of recent papers by Inoue and his collaborators (Inoue, Hirashita, & Kamaya, 2000; Inoue, Hirashita & Kamaya, 2001; Inoue, 2001). Here we attempt to calibrate these correction factors using theoretical models of dusty H II regions.
2 The Models
2.1 The Dust Model
The MacOS version of the MAPPINGS IIId code was used to generate spherical-shell dusty photoionized models appropriate to H II regions excited by clusters of OB stars. MAPPINGS IIId includes a number of advances in the treatment of dust physics and absorption. The dust model includes three types of grains, “astronomical” silicates and graphite or amorphous carbon grains having a Mathis, Rumpl & Nordsiek (1977) (MRN) distribution for grain sizes between 50Å and 2500Å. For these grains the extinction curve is based on the Laor & Draine (1993) data for silica and graphite. In addition, we have the option of including complex PAH-like organic molecules. For these, the photoionization cross-section per carbon atom follow the yield factors given by Vastraete et al. (1990) which are based on pyrene and coronene. These have been extrapolated (using the same slope as the Vestraete curve) to , which seems to be appropriate for interstellar PAHs (Allain, Leach & Sedlmayr, 1996a, b; Hollenbach & Tielens, 1999; Peeters et al, 2002). For PAH molecules of these dimensions, the ionization potential is about 6 eV. The PAH opacities are taken from the recent publication by Li & Draine (2002).
With our present state of knowledge on the physics of PAH molecules, it is not at all clear whether such molecules can survive for significant lengths of time in the hostile environment offered by the ionized zones of an H II region. Provided that the heating rate by the absorption of photons in the ISM can be at least matched by the infrared radiative rate, then the survival of polycyclic aromatic hydrocarbons, PAHs, is set by the competition between photodissociation (by the ejection of an acetyleneic group) and its repair through accretion of carbon atoms (Allain, Leach & Sedlmayr, 1996a, b). If is the radiative dissociation timescale, and is the C atom accretion timescale, then these are given by
| (2) |
and
| (3) |
where is the far-UV radiation field, is the photodissociation cross section per PAH molecule, is the number density of hydrogen atoms, is the abundance of C in the ISM, and is the reaction rate for sticking of a carbon atom onto such a molecule. For the far-UV radiation field, we take the total radiation field above the ionization potential adopted for these molecules ( eV). Putting together equations 1 and 2, we see that the PAHs will be destroyed when
or
| (4) |
We shall define as the Habing Photodissociation Parameter, by analogy with the dimensionless Ionization Parameter used in H II region theory. The advantage of the use of this parameter is that all photodissociation rates will scale in this way, and therefore the local value of this dimensionless parameter will also determine the local chemistry of photodissociation regions to first order. The actual shape of the photodissociating spectrum will determine the chemistry to second order.
Since we do not know the absolute value of above which PAHs are destroyed, we have to ask, what are the most extreme values of observed in regions which still contain PAHs. From Allain et al. (1996a), such extreme regions can be identified as in the diffuse ISM, high above the galactic plane where cm-3, photons cm-2 s-1 or in the planetary nebula NGC7027 where cm-3 and photons cm-2 s-1, corresponding to and respectively. We therefore adopt a threshold of for the destruction of PAHs. This threshold is not reached for any of the photoionization models presented here, so it is at least conceivable that charged PAH-like molecules may survive in the environment of an H II region.
2.2 The Photoionization Models
The photoionization modelling procedure adopted here closely follows that described in Dopita et al. (2000) and Kewley et al. (2001). For the central star cluster, we adopt a STARBURST99 (Leitherer et al., 1999) instantaneous-burst with a total luminosity of erg s-1 and having an Initial Mass Function (IMF) with a power-law slope of the Salpeter form (). The lower mass cutoff was set at 0.1 and the upper mass cutoff at 120 . For the purpose of the models presented here, the actual form of the assumed IMF is relatively unimportant in determining the final results, since the strength of the EUV field and the metallicity of the gas prove to be more important than the shape of the ionizing spectrum in determining the EUV absorption by dust. Table 1 gives the abundance set used in the models, and our assumed gas-phase depletion factors. These differ slightly from the Dopita & Kewley (2000) models because we have adopted the revised solar abundances for O, C, Si and Fe (Asplund, 2000; Asplund et al., 2000; Allende Prieto et al., 2001, 2002).
In order to investigate the effects of ionization parameter, , and the chemical abundances (which effectively determines the gas-to-dust ratio), we ran three sets of models for the abundances and , and covering a range of initial dimensionless ionization parameter from up to . This encompasses the full range that is normally encountered in range of ionization parameters encountered in bright H II regions (see Dopita & Kewley, 2000). Each model had the chemical abundances of the central cluster set the same as for the gas in the H II region. In spherical H II region models, the spherical divergence of the radiation field ensures that the mean ionization parameter is not well defined when the H II region becomes thick in comparison to its radius. We have therefore ensured that the models remain geometrically thin with a well-defined by raising the assumed hydrogen density from cm-3 up to cm-3 for the models with the highest ionization parameter.
The absorption of the PAH molecules is very important in determining the EUV extinction, since they have a very large absorption cross-section per carbon atom above 13.6 eV. Since we have no way of directly determining whether such molecules survive in the H II region itself, we have run two sets of models, one which did not include PAH-like molecules, and another in which we have set the abundance of PAH molecules equivalent to 20% of the total carbon atoms. This is probably an overestimate of their true abundance, since only a maximum of 40% of interstellar carbon is locked up in carbonaceous grains (Duley & Seahra, 1999), and studies of PAH emission suggests that perhaps only about 10% of the interstellar carbon is actually locked up in PAH-like molecules (Li & Draine, 2002).
For most models, we have also run a comparison dust-free H II region model with the same gas-phase abundances as in our dusty models in order both to check the absolute value of the dust-free H recombination line flux, and to ensure that this is independent of the ionization parameter for a given input spectrum, as required by theory. We find that, over the metallicity range covered by these models, the EUV blanketing of the central star cluster has very little effect on the number of Lyman continuum photons produced per unit of stellar luminosity (less than 0.02 dex).
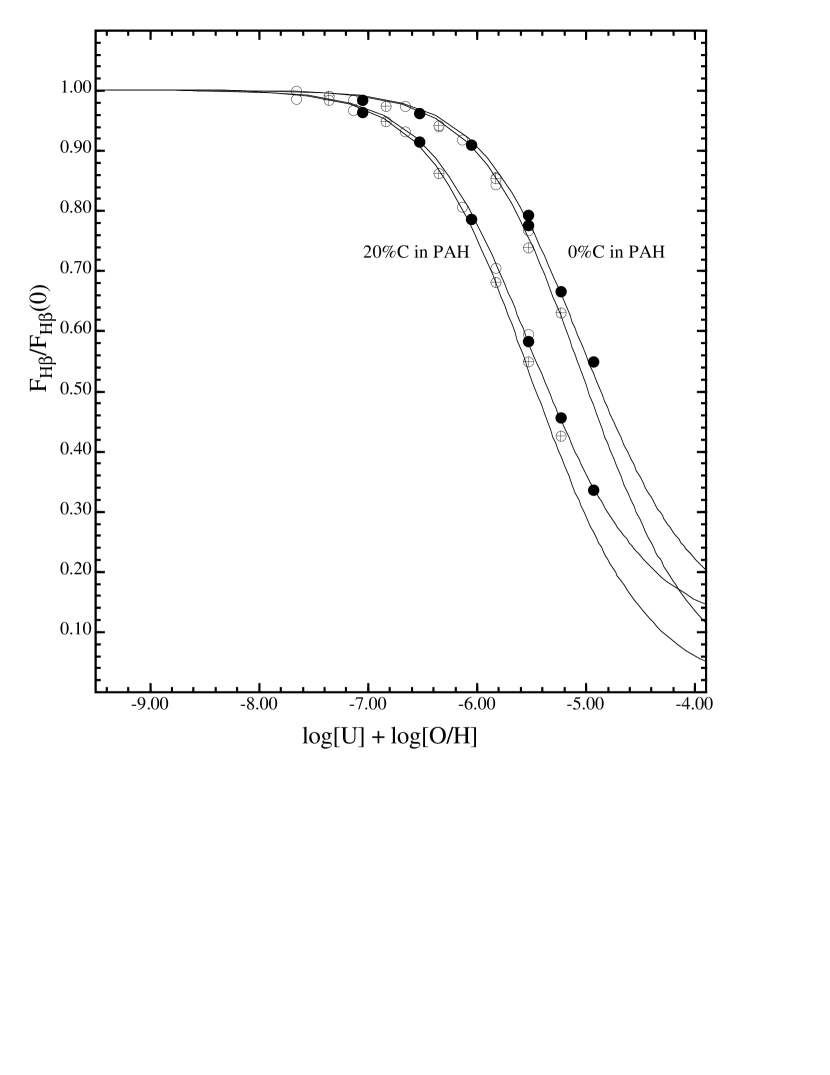
For reasons fully explained in the next section, we expect that the fraction of ionizing photons absorbed by the dust should scale as the product , for a given grain model. Therefore in Figure (1) we have plotted this quantity against the computed ratio of Balmer H fluxes, with and without the inclusion of dust. The two families of curves are shown, one with 10% of the C locked in PAH-like molecules, and the other with 20% of the C locked in such molecules. The families of models with at 0.4 times solar abundance (open circles), 1.0 times solar abundance (crossed circles) and 2 times solar abundance (filled circles) lie close to each other for each grain composition. This gives us confidence that the scaling factor is correct, to first order.
The largest dust absorption is found for the models with extreme metallicity and ionisation parameter ( and ). In practice H II regions are rarely encountered with such a high ionization parameter (Dopita et al., 2000; Kewley & Dopita, 2002). Therefore, we conclude on the basis of our models that accounting for the effect of dust absorption in determining star formation rates is both a significant and important correction, but that dust rarely dominates in the absorption of the EUV photons in normal H II regions.
2.3 An Simple Analytic Fit
It is self-evident that greater dust content will enable the dust to compete more efficiently with the gas for the EUV Lyman continuum photons. The dust content is determined by the balance of grain formation and grain destruction processes, but it should, to first order, scale as the metallicity, . We have taken this as an assumption of our models by using the same set of depletion factors in all models. However, it is not so immediately apparent that for high ionization parameter, the dust becomes again relatively more important in the competition for absorption of the ionizing photons. This result is readily established. After Dopita et al. (2002a), the local absorption of ionizing photons by the ionized plasma is simply equal to the local recombination rate:
| (5) |
where is the density in the ionized plasma, is the local photon density from the ionizing source (cm-2s-1), and is the recombination coefficient. Here, we have implicitly assumed that the nebula is fully ionized, and that . The absorption of photons by dust is given by
| (6) |
where is the effective dust opacity (per atom). It follows that dust absorption becomes relatively more important as the strength of the ionizing field increases and dominates the absorption of photons in the photoionized plasma when
| (7) |
Here is the dimensionless ionization parameter and is the speed of light. Substituting numerical values appropriate for solar abundance, we find that the critical ionization parameter above which dust dominates the absorption is 0.01. This is in good agreement with what is indicated by detailed modelling.
In fact, we can quite readily compute the fraction of ionizing photons absorbed by a dusty H II region model relative to a dust-free model. Dropping the explicit dependence of on , the radiative transfer equation for a plane-parallel (geometrically thin) nebula including both the gas (equation 5) and the dust (equation 6) terms is
| (8) |
Solving this in terms of the ionization parameter at the inner edge of the nebula ;
| (9) |
where is the thickness of the ionized layer (with dust), and is the optical depth in dust through the ionized layer. In the absence of dust, we can integrate equation 5 to solve for the thickness of the ionised layer; . Therefore, in a nebula of uniform density, the ratio of the recombination line flux with and without dust is simply . Thus it follows from equation 9 that
| (10) |
where . This fraction has the same meaning as the fraction defined by Inoue, Hirashita & Kamaya (2001) or Petrosian, Silk & Field (1972) for spherical filled H II regions.
Since the dust opacity, , scales as the metallicity (i.e. as the O/H abundance by number of atoms) it follows that that the fraction of EUV photons absorbed by the dust is a function only of the product of the metallicity, , or (equivalently) (O/H), and the initial ionization parameter, . This scaling is the physical reason why Inoue, Hirashita & Kamaya (2001) found an inverse correlation between not only and log(O/H), but also an inverse correlation between and the number of Lyman photons estimated from the central star(s). It is also significant that the H II regions having the most luminous clusters also tend to have low densities, consistent with them having high values of . These H II regions also tend to have the lowest inferred values of .
Equation 10 is strictly valid if the effect of absorption of EUV photons on dust is only to remove photons from the EUV field. However, grains can also produce photoelectrons, and some of these may recombine with a proton to produce a additional contribution to the Balmer emission. Provided that only a small percentage of dust absorptions produce a photoelectron, then to first order the corrected absorption fraction, is
| (11) |
where is the photoelectric yield, of order 0.1. The importance of photoelectric emission is suggested by the fact that, on figure 1, the models having twice solar abundance lie systematically higher than the models with lower abundance. This is the result of two effects. First, the higher dust to gas ratio ensures that there are more dust-produced photoelectrons per unit mass of gas. Second, at high heavy element abundance, the electron temperature of the H II region is much lower, and the recombination coefficient of hydrogen is therefore higher, ensuring a greater production of Balmer photons by recombining dust-produced photoelectrons.
The dust absorption curve without photoelectric emission (equation 10) and with photoelectric emission () (equation 11) were scaled to fit the two families of models (with 0% and 20% of C in PAHs, repectively). These two families of curves probably represent the extremes allowed by the theoretical models. For the 0% PAH models, corresponds to , while for the 20% of C in PAH models, is reached by . This emphasizes how efficient PAHs (if present) are in increasing the opacity of the H II region to dust. This is because PAHs offer an essentially a molecular opacity, with the carbon atoms arranged in flat sheets so that relatively few atoms can offer a large cross-section to the EUV radiation field.
The dust absorption in spherical models is more severe than for the thin-shell models presented here. Inoue, Hirashita & Kamaya (2001) and Petrosian, Silk & Field (1972) showed that, for such models, . If the initial slope of this function is fitted to our thin shell H II region models, it rapidly becomes too steep at larger , and approaches zero. The reason for this is that the inner regions of filled spherical H II regions are characterized by a very high local radiation field, so that dust may compete much more efficiently for EUV photons in this region. Thus, overall, the filled H II regions will provide an upper limit to the dust absorption fraction. However, since the geometry of most extragalactic H II regions is better fit with a central empty zone, such an empty zone is naturally produced by the strong stellar winds of the OB stars in H II regions, and since the strong-line diagnostics of extragalactic H II regions are also well fit by shell models (Dopita et al., 2000; Kewley & Dopita, 2002), we are of the opinion that spherical shell models should be more physically realistic than filled Strömgren spheres in most cases.
3 Conclusions
We have studied the theoretical effect of internal dust in absorbing the Lyman continuum photons, and so in reducing the Balmer line fluxes produced by H II regions. We agree with the conclusion of Inoue, Hirashita & Kamaya (2001) that “the effect of Lyman continuum extinction is not negligible relative to other uncertainties of estimating the star formation rates of galaxies”. However, the largest uncertaintly in correcting the estimated star formation rates for internal dust absorption is the presence or absence of PAH-like organic molecules in the ionized gas. Since this is so theoretically uncertain, we have run models either without these molecules, or else including these at the level of 20% of total carbon, which is probably a reasonable upper limit for their abundance.
We have also provided simple theoretical fits to the fraction of the EUV photons which are used by the ionized gas, . On the assumption that the dust to gas ratio scales as the metallicity of the gas, this fraction is shown to be only a function of the product of the initial ionization parameter, and the oxygen abundance (O/H). This is fortunate, because each of these can be estimated independently for a given H II region or starburst galaxy by measuring only the strong emission lines at optical wavelengths (ideally the [O II], H, [O III], H, [N II] and [S II] lines, although subsets of these may be used in certain circumstances (Kewley & Dopita, 2002)).
Once both and (O/H) have been determined, the factor can then be obtained by either reading directly from figure 1, or else by solving for using the analytic fits given by equations 10 and 11, with corresponding to . Within these theoretical uncertainties, the star formation can then be derived using the corrected Kennicutt (1998) expression; . We could also use an analagous expression involving any other member of the Balmer, Paschen or Brackett Series of hydrogen.
Acknowledgements
M. Dopita acknowledges the support of the Australian National University and the Australian Research Council through his ARC Australian Federation Fellowship, and under the ARC Discovery project DP0208445. M. Dopita would also like to thank United Airlines for the provision of airport lounges which gave him the opportunity to run most of the models described here on his laptop computer. L. Kewley is supported by a Harvard-Smithsonian CfA Fellowship.
References
- Aannestad (1989) Aannestad, P. A. 1989, ApJ, 338, 162.
- Allain, Leach & Sedlmayr (1996a) Allain, T., Leach, S. & Sedlmayr, E. 1996a, A&A 305, 602.
- Allain, Leach & Sedlmayr (1996b) Allain, T., Leach, S. & Sedlmayr, E. 1996b, A&A 305, 616.
- Allende Prieto et al. (2001) Allende Prieto, C., Lambert, D. L. & Asplund, M. 2001, ApJ, 556, L63.
- Allende Prieto et al. (2002) Allende Prieto, C., Lambert, D. L. & Asplund, M. 2001, ApJ, (in press).
- Asplund (2000) Asplund, M., Nordlund, A., Trampedach, R. & Stein, R. F. 2000, A&A, 359, 743.
- Asplund et al. (2000) Asplund, M. 2001, A&A, 359, 755.
- Bell & Kennicutt (2001) Bell, E. F,. & Kennicutt, R. C. Jr. 2001, ApJ, 548, 681.
- Bottorff et al. (1998) Bottorff, M., LaMothe, J., Momjian, E., Verner, E., Vinkovi c, D., & Ferland, G. 1998, PASP, 110, 1040.
- Calzetti (2001) Calzetti, D. 2001, PASP, 113, 1449.
- Dopita et al. (2002) Dopita, M. A., Groves, B.A., Sutherland, R.S. Binette, L. & Cecil, G. 2002a, ApJ, 572, 753.
- Dopita et al. (2000) Dopita, M. A., Kewley, L.J., Heisler, C.A. & Sutherland, R.S. 2000, ApJ, 542, 224.
- Dopita et al. (2002b) Dopita, M. A., Pereira, M., Kewley, L. J., & Capaccioli, M. 2002b, ApJS, (in press, November).
- Dopita & Ryder (1994) Dopita, M. A. & Ryder, S. D. 1994, ApJ, 430, 163.
- Duley & Seahra (1999) Duley, W. W., & Seahra, S. S. 1999, ApJ, 522, L129.
- Gallego et al. (1995) Gallego, J., Zamorano, J., Aragón-Salamanca, A., & Rego, M. 1995, ApJ, 455, L1.
- Hollenbach & Tielens (1999) Hollembach, D. J., & Tielens, A. G. G. M. 1999, Rev. Mod. Phys., 71, 173.
- Inoue, Hirashita, & Kamaya (2000) Inoue, A. K., Hirashita, H., & Kamaya, H. 2000, PASJ, 52, 539.
- Inoue, Hirashita & Kamaya (2001) Inoue, A. K., Hirashita, H., & Kamaya, H. 2001, ApJ, 555, 613.
- Inoue (2001) Inoue, A. K., AJ, 122, 1788.
- Inoue (2002) Inoue, A. K. 2002, ApJ, 570, L97
- Jones & Bland-Hawthorn (2001) Jones, D. H. & Bland-Hawthorn, J. 2001, ApJ, 550, 593.
- Kennicutt (1998) Kennicutt, R. C. Jr. 1998, Ann.Rev.A&A, 36, 189.
- Kewley et al. (2001) Kewley, L. J., Heisler, C. A., Dopita, M. A. & Lumsden, S. 2001, ApJS, 132, 37.
- Kewley & Dopita (2002) Kewley, L. J., & Dopita, M.A. 2002, ApJS (in press, October).
- Leitherer et al. (1999) Leitherer, C., Schaerer, D., Goldader, J. D., Delgado, R. M. González, R. C., Kune, D. F., de Mello, Duília F., Devost, D., & Heckman, T. M. 1999, ApJS, 123, 3
- Li & Draine (2002) Li, A. & Draine, B. T. 2002,
- Laor & Draine (1993) Laor & Draine, B.T. 1993, ApJ, 402, 441.
- Madau et al. (1996) Madau, P. , Ferguson, H. V. C., Dickinson, M. E., Giavalisco, M., Steidel, C. C., & Fruchter, A. 1996, MNRAS, 283, 1388.
- Mathis, Rumpl & Nordsiek (1977) Mathis, J.S. Rumpl, W. & Nordsiek, K. H. 1977, ApJ, 217, 425.
- Mezger, Smith, & Churchwell (1974) Mezger, P.G., Smith, L.F., & Churchwell, E. 1974, A&A, 32, 269.
- Moorwood et al. (2000) Moorwood, A. F. M, van der Werf, P. P., Cuby, J. G., & Oliva, E. 2000, A&A, 362, 9.
- Natta & Panagia (1976) Natta, A. & Panagia, N. 1976, A&A, 50, 191.
- Panagia (1974) Panagia, N. 1974, ApJ, 192, 221.
- Pascual et al. (2001) Pascual, S., Gallego, J., Aragón-Salamanca, A., & Zamorano, J. 2001, A&A, 379, 798.
- Peeters et al (2002) Peeters, E., Hony, S., Van Kerckhoven, C., Tielens, A. G. G. M., Allamandola, L J., Hudgins, D. M., & Bauschlicher, C. W. 2002, å, 390, 1089.
- Petrosian, Silk & Field (1972) Petrosian, V., Silk, J., & Field, G. B. 1972, ApJ, 177, L69.
- Sarazin (1977) Sarazin, C. L., 1977, ApJ, 211, 722.
- Shields & Kennicutt (1995) Shields, J. C. & Kennicutt, R. C. 1995, ApJ, 454, 807.
- Smith, Biermann, & Mezger (1978) Smith, L. F., Biermann, P. & Mezger, P. G. 1978, A&A, 66, 65.
- Tresse & Maddox (1998) Tresse, L., & Maddox, S. J. 1998, ApJ, 495, 691.
- Vastraete et al. (1990) Vestraete, L., Leger, A., D’Hendecourt, L., Defourneau, D. & Dutuit, O. 1990, å, 237, 436.
- Yan et al. (1999) Yan, L., McCarthy, P. J., Freudling, W., Teplitz, H. J., Malumuth, E. M., Weymann, R. J., & Malkan, M. A. 1999, ApJ, 519, L47.
| Element | ||
|---|---|---|
| H | 0 | 0.00 |
| He | -1.01 | 0.00 |
| C | -3.44 | -0.30 |
| N | -3.95 | -0.22 |
| O | -3.35 | -0.07 |
| Ne | -3.91 | 0.00 |
| Cl | -5.75 | 0.00 |
| Mg | -4.42 | -0.70 |
| Si | -4.45 | -1.00 |
| S | -4.79 | 0.00 |
| Ar | -5.44 | 0.00 |
| Ca | -5.64 | -2.52 |
| Fe | -4.36 | -2.00 |
| Ni | -5.68 | -2.00 |