Dissecting the Homunculus Nebula Around Eta Carinae With Spatially Resolved Near-Infrared Spectroscopy
Abstract
Near-infrared emission lines provide unique diagnostics of the geometry, structure, kinematics, and excitation of Carinae’s circumstellar ejecta, and give clues to the nature of its wind. The infrared spectrum is a strong function of position in Car’s nebula, with a mix of intrinsic and reflected emission. Molecular hydrogen traces cool gas and dust in the polar lobes, while [Fe ii] blankets their inner surfaces. These lines reveal the back wall of the SE polar lobe for the first time, and give the clearest picture yet of the 3-D geometry. Additionally, collisionally-excited [Fe ii] reveals the kinematic structure of a recently discovered ‘Little Homunculus’ expanding inside the larger one. Equatorial gas in the ‘Fan’, on the other hand, shows a spectrum indicating recombination and fluorescent Ly pumping. Some equatorial ejecta glow in the He i 10830 line, showing evidence for material ejected in the 1890 outburst of Car. Closer to the star, the compact ‘Weigelt blobs’ are marginally resolved, allowing their infrared spectrum to be separated from the star for the first time. In general, infrared spectra reveal a coherent, directional dependence of excitation in the Homunculus: polar ejecta are collisionally excited, whereas equatorial ejecta are dominated by fluorescence and normal photoexcitation. These are important clues to the geometry of the central star’s UV radiation field. Reflected near-infrared emission lines also reveal interesting latitudinal dependence in the stellar wind.
keywords:
circumstellar matter — reflection nebulae — stars: individual ( Carinae) — stars: mass loss — stars: winds, outflows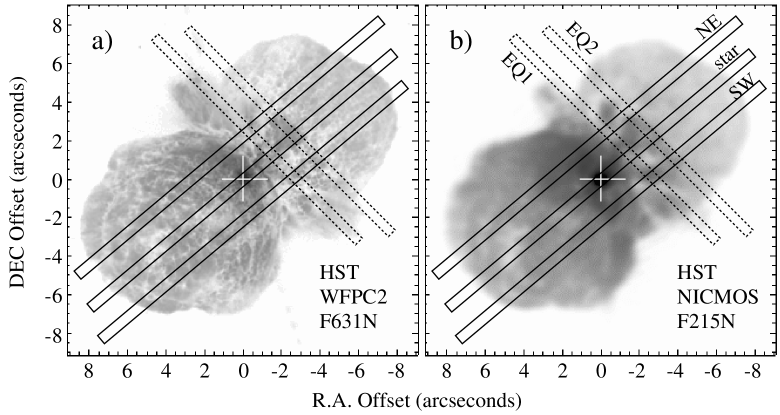
1 INTRODUCTION
The idiosyncratic massive star Carinae and its bipolar Homunculus Nebula provide spectacular examples of a dense stellar wind and processed ejecta atop the HR Diagram. Its proximity and brightness allow detailed multiwavelength study, offering insight to the limits nature imposes on the stability of stars. Car exhibits extreme spatial, temporal, and spectral complexity throughout the electromagnetic spectrum; infrared (IR) wavelengths afford us no exception, but they provide unique diagnostics of the wind and ejecta.
The shape, orientation, kinematics, and excitation of the Homunculus offer the best ways to investigate ejection physics of the Great Eruption, since most material was ejected in the 1840’s (Morse et al. 2001; Smith & Gehrz 1998; Currie et al. 1996). The Homunculus is a dusty nebula dominated by reflected starlight at optical wavelengths. This makes it problematic to study the kinematics and excitation of the Homunculus itself, because narrow emission lines originating in the polar lobes overlap with reflected emission (e.g., Hillier & Allen 1992; Davidson et al. 2001). IR wavelengths offer a way to mitigate this, with strong emission from the polar lobes in a few transitions of H2 and [Fe ii] (Smith & Davidson 2001). Furthermore, lower extinction in the IR allows us to peer inside the Homunculus to study embedded emission structures.
Spatially resolved long-slit spectroscopy allows us to view the reflected stellar spectrum from multiple directions. Most previous investigations of Car’s IR spectrum have integrated light from the entire Homunculus (Whitelock et al. 1983; Allen, Jones, & Hyland 1985; McGregor, Hyland, & Hillier 1988) or the bright unresolved core (Hamann et al. 1994). Hamann et al. presented the optical to far-red spectrum observed in the SE lobe, revealing a reflected broad-line spectrum of the central star. Long-slit spectra presented here provide multiple viewing angles to Car for the first time at wavelengths longer than 1 . Car was observed in March 2001, during its high-excitation state between “spectroscopic events” that repeat every 5.5 years (Damineli 1996). Latitudinal structure of the wind changes dramatically during this cycle (Smith et al. 2003), so these IR spectra also provide a benchmark for future spectroscopy.
New observations obtained at CTIO are presented in §2. Intrinsic IR emission lines are used to derive the structure of the Homunculus in §3, and in §4 and §5 other novel aspects of the IR spectra are presented. Finally, the central star, nearby ejecta, and reflected spectra are discussed in §6.
2 OBSERVATIONS
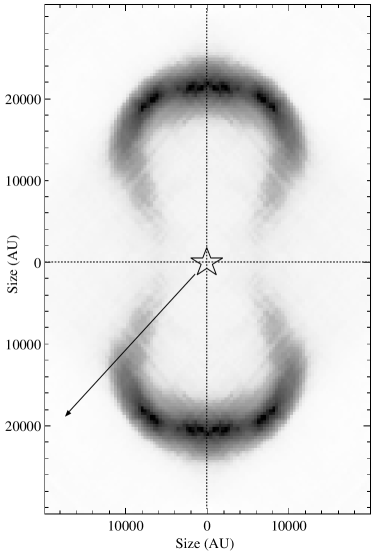
Long-slit spectra of Carinae from 1 to 2.3 were obtained on 2001 March 13 and 14 using OSIRIS111See http://www.ctio.noao.edu/instruments/ir_instruments /osiris/index.html mounted on the CTIO 4m telescope. Data were obtained in high-resolution mode, with an effective 2-pixel spectral resolution of about 100 km s-1 (). These spectra are similar to observations obtained a year earlier in March 2000, for which preliminary results have already been presented (Smith 2001; Smith & Davidson 2001). However, the new data obtained in March 2001 are superior for several reasons, including better seeing (04), and the alignment of the long slit aperture with the polar axis of the Homunculus at P.A.=50 (see Figure 1). Spectra were obtained with the 05-wide slit aperture centered on the central star, as well as two positions offset 1 to the NE and SW. A few spectra were also obtained with the slit oriented perpendicular to the polar axis of the Homunculus (labeled as ‘EQ1’ and ‘EQ2’ in Figure 1). Sky-subtraction was performed by chopping along the slit with offsets greater than the size of the Homunculus. Wavelengths were calibrated using observations of an internal emission lamp. Flux calibration and telluric absorption correction were accomplished with reference to spectroscopic standard stars.
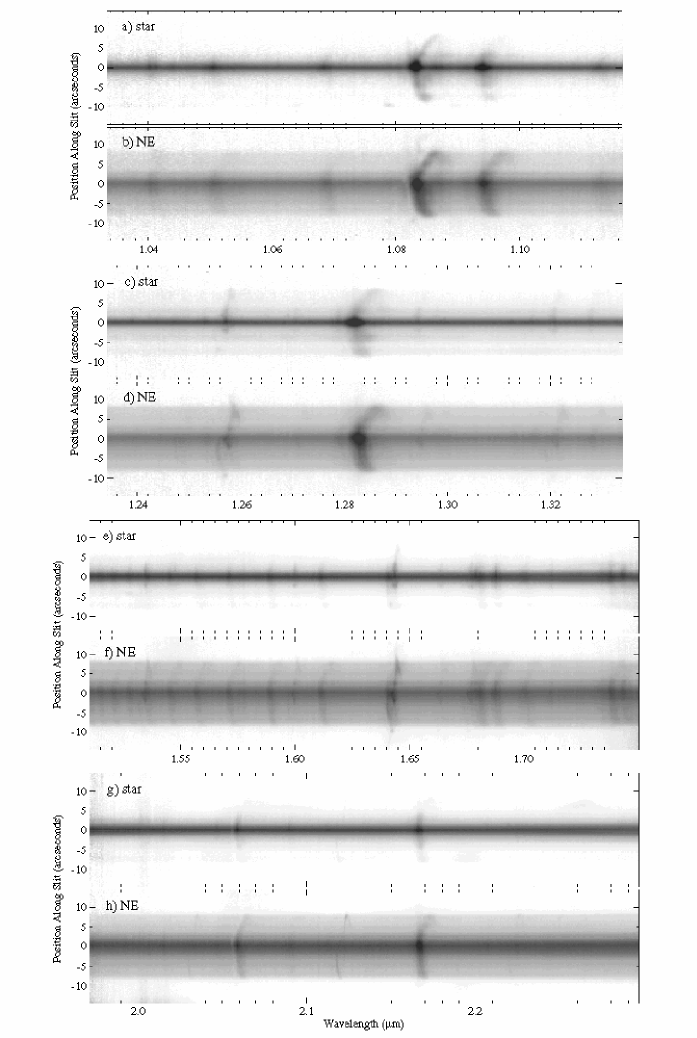
Figure 2 shows long-slit spectra of the Homunculus in the I, J, H, and K bandpasses observable from the ground, with long-slit spectra centered on the star and 1 NE (long-slit spectra for positions 1 SW are similar). NE positions show fainter emission features. It is clear from Figure 2 that the observed spectrum varies with position along the slit. There are essentially two different types of emission features present: 1) narrow emission lines emitted by gas in the Homunculus, and 2) broad emission lines in the wind of the central star reflected toward us by dust. The 04 seeing for these observations reveals complex spatial structure along the slit length, useful for future comparison with HST/STIS data. Various details concerning the spatial variation of these two types of features are discussed below.

3 SHAPE AND STRUCTURE OF EMISSION FROM THE POLAR LOBES
Proper motions for expanding debris in the Homunculus have been measured by several authors (Gaviola 1950; Ringuelet 1958; Gehrz & Ney 1972; Currie et al. 1996; Smith & Gehrz 1998; Morse et al. 2001). The age of Car’s equatorial skirt is controversial, and there is reason to suspect a mixture of material from multiple events (Smith & Gehrz 1998; Zethson et al. 1999; Morse et al. 2001; Davidson et al. 2001). The origin of the polar lobes is less ambiguous — various studies infer ejection within a few years of the Great Eruption (1843). Since the polar lobes appear to be the product of a single ejection event, apparent Doppler velocities can be used to deduce their 3-D geometry. Detailed results of previous studies that used Doppler velocities of optical lines or polarization measurements have shown some disagreement (Thackeray 1951, 1956, 1956; 1961; Meaburn et al. 1987, 1993; Hillier & Allen 1992; Allen & Hillier 1993; Hillier 1997; Currie & Dowling 1999; Schulte-Ladbeck et al. 1999). A recent study using HST/STIS spectroscopy has improved the situation somewhat (Davidson et al. 2001). No attempt has yet been made to investigate this using IR emission lines, where extinction is less problematic. Recently, Smith & Davidson (2001) discovered bright, IR lines from H2 and [Fe ii] emitted by gas in the polar lobes. These lines are obvious in the spectrum near the edge of the NW lobe shown in Figure 3. Molecular hydrogen lines in particular are ideal for investigating the geometry, since they are only emitted by gas in the lobes and therefore do not suffer from confusing velocity components reflected by dust in the Homunculus, and because extinction at 2 is low. [Fe ii] lines also provide essential information.
3.1 Emission Structure
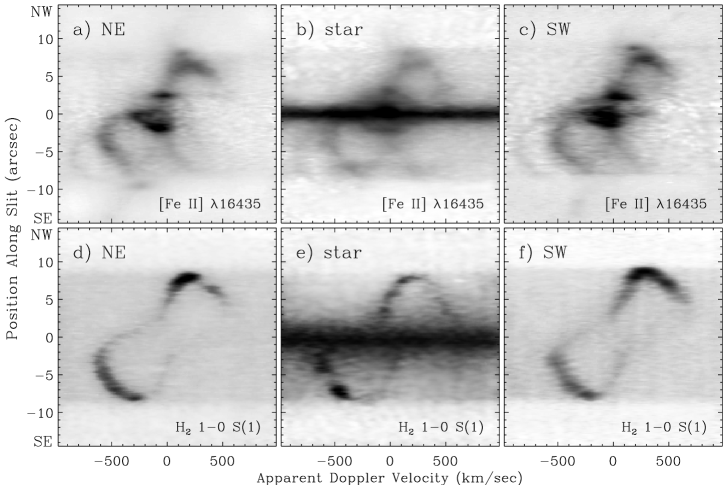
Figure 4 shows velocity structure222Continuum emission has been suppressed in Figure 4. A smooth continuum model was used for H2, and a segment of the H-band spectrum around Br13 was used for [Fe ii] 16435. as a function of position along the slit for [Fe ii] 16435 and H2 =1-0 S(1) 21218. Related lines, such as [Fe ii] 12567 and H2 =1-0 S(2) 20338 (see Figures 2 and 3), show similar structure but are fainter. Three slit positions are shown, with the slit crossing through the star and offset positions NE and SW. Short exposure times had to be used with the slit centered on the star, so the signal-to-noise there is worse, but extended velocity structure can still be distinguished.
[Fe ii] emission components in Figure 4 are complex and trace several different features in the Homunculus, but can be understood in the context of previous work (see Allen & Hillier 1993; Davidson et al. 2001; Ishibashi et al. 2003). By comparison, H2 emission structure is surprisingly elegant, and seems to trace only material in the polar lobes. Lower extinction at IR wavelengths has allowed us to see the back wall of the SE lobe unambiguously for the first time in both H2 and [Fe ii]. Also, subtle differences in shape can be seen from one position to the next, especially in H2, and there is a conspicuous gap in the emission structure at 6 SE for the slit position passing through the star (Figures 4 and ). This slit also traverses an infamous “hole” in the SE lobe seen in images of the Homunculus (see Figure 1), the nature of which has been controversial (Smith et al. 1998; Morse et al. 1998; Schulte-Ladbeck et al. 1999). The fact that both [Fe ii] and H2 emission show a pronounced gap in the emission structure, combined with the fact that we apparently see the back wall of the Homunculus at the same position, has interesting implications.
The images in Figure 4 are stretched horizontally from their original pixel sampling to reflect the actual shape of the polar lobes, but the magnification factor is not arbitrary; it depends on assumed values for the heliocentric distance and ejecta age. Defining as the position along the line-of-sight in arcseconds, apparent Doppler velocities in km s-1 yield values for if the age of the ejecta and heliocentric distance are known using the relation
| (1) |
Figures 5 and show how emission structure varies with and position along the slit for a heliocentric distance of 2250 pc and an age of 158 years (ejection date of 1843), using the same length scale for both the vertical and horizontal axes (the same proportions were used in Figure 4 as well, although Doppler velocities were shown there). A distance of 2250 pc yielded the most symmetric appearance for the polar lobe structure in the H2 line; assumed values of 2200 and 2300 pc were noticably distorted. Davidson et al. (2001) found the same result for optical emission lines in HST/STIS data, and their quoted uncertainy of 50 pc is applicable here as well. Figures 5 and show a cross section of the Homunculus in [Fe ii] 16435 and H2 21218 emission for an average of the NE and SW slit positions.
Figures 5 and compare the relative distribution of [Fe ii] and H2 by superimposing isophotal contours of one line’s velocity structure over grayscale images of the other. It is clear from these figures that [Fe ii] emission associated with the polar lobes resides mostly interior to the H2. Figure 6 conveys the same conclusion with tracings of the velocity profile for each line at a few representative positions. The particular spatial distribution of these two lines, combined with the fact that neither emission line appears to exceed the confines of the polar lobes, supports an earlier contention (Smith & Davidson 2001) that this emission may arise from a shock caused by a fast stellar wind impacting the inside surfaces of the polar lobes.333[Fe ii] emission gives evidence for a shock at the outside surface of the polar lobe as well; there is a small emission blob at the edge of the NW lobe, seen most clearly in Figure 5. This blob is clearly separated from [Fe ii] inside the NW lobe, and the gap between them corresponds precisely to the location of the H2 emission (Figure 5). The spectrum of this outer shock and its interesting implications will be discussed in a later publication.
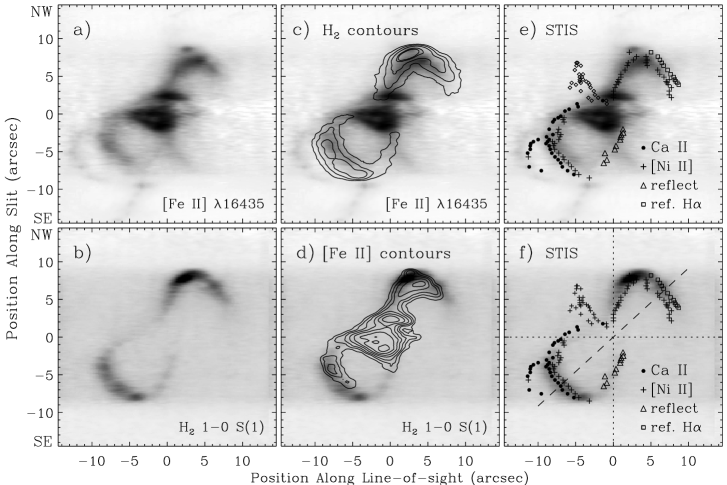

Doppler velocities for optical lines in HST/STIS data (measured independently by the author, but see Davidson et al. 2001) have been converted to the same coordinates along the line-of-sight and plotted over the IR emission structure in Figure 5 and . Ca ii absorption in STIS data appears to overlap with infrared H2 emission in the SE lobe in Figure 5 (some Ca ii absorption also arises at high velocities in front of the SE lobe, associated with the [Fe ii] emission features in ejecta outside the Homunculus). [Ni ii] 7379 emission overlaps with [Fe ii] 16435 instead, and resides interior to both H2 emission and Ca ii absorption. Reflected emission lines from the back walls of the polar lobes trace dust, which seems to reside in the exterior parts of the lobes coincident with H2. Therefore, H2 emission appears to be the best unambiguous tracer of the shape and orientation of the dense neutral gas and dust, while atomic emission lines arise from material inside the lobes. This is why Davidson et al.’s “model 1” derived from [Ni ii] 7379 produced a shape that was too small compared to continuum images.
| Latitude | Radius | Velocity |
|---|---|---|
| (deg) | (AU) | (km s-1) |
| 5 | 4890 | 148 |
| 10 | 5220 | 158 |
| 15 | 5540 | 168 |
| 20 | 5980 | 181 |
| 25 | 6520 | 197 |
| 30 | 7120 | 215 |
| 35 | 8150 | 246 |
| 40 | 9670 | 292 |
| 45 | 11950 | 361 |
| 50 | 16030 | 485 |
| 55 | 17930 | 542 |
| 60 | 18800 | 568 |
| 65 | 19670 | 595 |
| 70 | 20650 | 625 |
| 75 | 21350 | 646 |
| 80 | 21140 | 639 |
| 85 | 21030 | 636 |
| 90 | 21080 | 637 |
3.2 Geometry of the Homunculus
Various models for the exact 3-D geometry of the Homunculus have been controversial, since the detailed shape of the polar lobes may hold important clues to ejection physics during the Great Eruption. The shape of the lobes depends on the tilt angle of the polar axis with respect to our line-of-sight; to avoid confusion, the inclination angle is used as defined for binary systems, where a view from the equator is =90. The inclination was measured by rotating Figure 5 so that the polar axis was nearly vertical, and then flipping the image about the horizontal and vertical axes and examing the lobe thickness when the images were added. The smallest dispersion (i.e. the most symmetric shape) was found for =4252. This value is only slightly larger than 41 found by Davidson et al. (2001), mainly because of differences in the shape of H2 emission compared with optical lines. Smith et al. (1999) also derived 40 from equatorial features seen in IR images. Figure 7 shows the end result of rotating Figure 5 by 90, reflecting it across the various symmetry axes, and averaging. This gives an artificially symmetric picture of the polar lobes, but it is a good approximation for discussion here. The size of the nebula is derived assuming a distance of 2250 pc and an age of 158 years. Table 1 lists representative values for the radius and expansion velocity at each latitude (=90 at the pole).
The Homunculus shape is often discussed in the context of three geometric models, which approximate the lobes as a pair of flasks, bubbles (spheres), or bipolar caps (see Hillier 1997). None of these three models adequately describes the geometry in Figure 7, but one can see how each has a kernal of truth. One important way that Figure 7 differs from all these models is that near the equator, the walls of the polar lobes clearly do not converge on the central star. Instead, the two lobes appear meet a few thousand AU from the star. One might expect an equatorial torus to reside at the intersection of these lobes, and in fact, a structure resembling a disrupted torus is seen there in thermal-IR images (Smith et al. 2002).
Figure 7 seems generally consistent with hydrodynamic simulations of bipolar nebula formation applied to Car (e.g. Frank et al. 1995, 1998; Dwarkadas & Balick 1998), and some details are as well. For instance, the scenario discussed by Frank et al. (1995) predicts two shocks – one at the inside of the polar lobes as the post-eruption wind collides with ejecta, and one on the outside as ejecta sweep up the ambient medium. [Fe ii] 16435 shows emission from both inner and outer shocks in Figure 5, as mentioned earlier.

The observed structure does not necessarily rule out other ideas for the formation of the Homunculus. After examining the geometry of the present-day aspherical stellar wind, Smith et al. (2003) suggest that the shape of the Homunculus might have arisen from intrinsically asymmetric ejection during the Great Eruption, and may have been shaped somewhat by an asymmetric post-eruption wind. In that case, we might expect the latitudinal dependence of ejection velocity during the eruption to be related to the star’s rotation. For instance, ejection speed at various latitudes may vary with escape speed on a rotating star as
| (2) |
where at the equator. Expansion speeds at each latitude in Table 1 are plotted in Figure 8, with curves of equation (2) for values of near critical rotation. Equation (2) provides an adequate description of the shape of the polar lobes at latitudes above =50, where most of the mass was presumably ejected in thick polar caps (e.g., Hillier & Allen 1992). The walls of the polar lobes at are optically thinner and presumably less massive; they may have been decelerated as they plowed through the ambient medium, or during a hypothetical collision with a pre-existing torus (e.g., Dwarkadas & Balick 1998).
Figures 4 and 5 also show narrow [Fe ii] emission from a fast outer bubble projected in front of the SE polar lobe. This outer bubble is seen at 500 to 900 km s-1 in [Fe ii], and appears at slightly lower velocities in Ca ii absorption in STIS spectra (Figures 5 and ). Apparently, it also causes absorption in the He i 10830 line (see §6.3 and Figure 20 below). This outer feature corresponds to velocity component number 6 in tracings of [Fe ii] in Figure 6. Its actual 3-D structure is uncertain because its age is not known.
| Wavelength | I.D.b | NW Lobe Flux | LH Flux | Fan Flux |
|---|---|---|---|---|
| (Å) | (erg s-1 cm-2) | (erg s-1 cm-2) | (erg s-1 cm-2) | |
| 12567 | [Fe ii] | 7.2210-13 | 5.8010-12 | 1.9410-11 |
| 12788 | [Fe ii] | 4.8310-14 | 7.9210-13 | 3.2810-12 |
| 12818 | H i Pa | (410-15) | (210-14) | 2.6910-11 |
| 12943 | [Fe ii] | 8.8410-14 | 9.6510-13 | 3.0610-12 |
| 13205 | [Fe ii] | 2.2310-13 | 1.1310-12 | 3.9110-12 |
| 15335 | [Fe ii] | 1.5710-13 | 1.2710-12 | 6.9610-12 |
| 15995 | [Fe ii] | 9.9210-14 | 1.3310-12 | 5.7110-12 |
| 16435 | [Fe ii] | 1.0510-12 | 7.9210-12 | 1.8910-11 |
| 16637 | [Fe ii] | 7.4410-14 | 5.4310-13 | 2.6410-12 |
| 16769 | [Fe ii] | 1.3910-13 | 1.1810-12 | 7.8310-12 |
| 16787 | Fe ii | … | 1.2510-13 | 6.9210-12 |
| 16873 | Fe ii | … | 2.6810-13 | 9.2510-12 |
| 17111 | [Fe ii] | … | 7.9210-13 | 1.2610-12 |
| 17414 | Fe ii | … | 4.5610-13 | 7.6710-12 |
| 19572 | Fe ii | … | … | 6.6110-12 |
| 19746 | Fe ii | … | 2.9010-13 | 2.3110-12 |
| 20151 | [Fe ii] | … | 5.3310-13 | 1.9410-12 |
| 20338 | H2 1-0 S(2) | 1.3610-13 | … | … |
| 20460 | [Fe ii] | … | 6.0810-13 | 1.5010-12 |
| 20581,600 | He i, Fe ii | … | 3.7410-13 | 3.6110-12 |
| 20888 | Fe ii | 2.2010-14 | 3.4910-13 | 2.9610-12 |
| 21218 | H2 1-0 S(1) | 4.1710-13 | … | … |
| 21655 | H i Br | (410-15) | (310-14) | 5.4910-12 |
| 22233 | H2 1-0 S(0) | 1.5110-13 | … | … |
| 22477 | H2 2-1 S(1) | 1.7710-14 | … | … |
aSee Figures 3, 10, and 11. If more than one wavelength is given, the line is blended, and both lines are expected to contribute significantly.
bJ subscripts for Fe+ lines have been omitted.
3.3 Excitation of the Polar Lobes
Observed fluxes from Figure 3 for several intrinsic emission lines in the NW polar lobe are listed in Table 2.444Since the spectrum of the NW polar lobe is a complex mix of intrinsic emission and reflected emission lines from the stellar wind and Weigelt blobs (redshifted by almost 1000 km s-1), some lines in the spectrum are excluded and corrections were applied after considering kinematic information. For instance, [Fe ii] 16435 is blended with Br12, and the flux for this line was adjusted accordingly in Table 2. Also, Br has an intrinsic narrow component in addition to the strong reflected line from the stellar wind, but this narrow component is blueshifted and appears to be emitted by slow-moving equatorial gas (see §5). Therefore, Table 2 lists a likely upper limit to the Br flux in the polar lobe. H2 =2-1 and Q-branch transitions are absent or very weak in Figure 3; these are typically weak in molecular gas excited by shocks (e.g., Shull & Hollenbach 1978), and relatively strong H2 1-0 S(1) emission (low excitation temperature) is conventionally taken to indicate shock excitation. Here, the H2 1-0 S(1) / H2 2-1 S(1) ratio of 12 implies a characteristic excitation temperature of 2000 K. This rules out radiative fluorescence (i.e. direct excitation through absorption in the Lyman and Werner bands in the UV) as the excitation mechanism for the H2, since that mechanism results in a H2 1-0 S(1) / H2 2-1 S(1) ratio of 2 (Sternberg & Dalgarno 1989). However, Sternberg & Dalgarno (1989) point out that collisional fluorescent emission can also result in low excitation temperatures (103 K) in dense molecular gas irradiated by a strong UV flux. Sternberg & Dalgarno stress that collisional excitation of dense gas resulting from radiative heating can mimic line ratios in shocks.
A similar conundrum may exist for the excitation mechanism of [Fe ii] lines at 12567 and 16435 Å. Models for IR emission from dense interstellar shocks (e.g., McKee, Chernoff, & Hollenbach 1984) predict enhanced [Fe ii] compared to H. Observationally, shock-excited gas such as that in supernova remnants shows high ratios of [Fe ii] 16435/Br 30 (Graham et al. 1987; Oliva et al. 1990; Seward et al. 1983), whereas H ii regions have [Fe ii] 16435/Br 1 (Moorwood & Oliva 1988; Mouri et al. 1990). The observed [Fe ii] 16435/Br ratio in the NW polar lobe is 26 (Table 3), which would conventionally be interpreted as a shock. However, radiation may be able to heat the gas to a few 103 K as well, allowing collisionally-excited [Fe ii] lines and still suppressing the H recombination lines. For instance, the Crab Nebula has a high [Fe ii] 16435/Br ratio ranging from 10 to 50 (Graham et al.1990), and it is photoexcited by a power-law synchrotron spectrum. The excitation of this warm gas in the polar lobes of Car will be investigated quantitatively by Ferland, Davidson, & Smith (2002).
In any case, it seems clear from Figure 5 that [Fe ii] emission arises at the inside surface of the hollow polar lobes; peaks in H2 and [Fe ii] are separated by 1000 AU. The separation of H2 and [Fe ii] emission may have implications for grain destruction and the gas-phase iron abundance in this photodissociation region.
[Fe ii] 12567 and 16435 share the same upper level, and atomic physics predicts an intrinsic flux ratio of 12567/16435 1.36 (Nussbaumer & Storey 1988). The observed flux ratio less than 1 in Table 3 therefore indicates considerable reddening from circumstellar dust in the walls of the polar lobes; however, the reddening law for dust in the Homunculus is anomolous and poorly constrained, so it is not possible to extrapolate this ratio to .
If Car lost 2 during the Great Eruption (Smith et al. 1998), then the particle density in the polar lobes today should be on the order of 104.5 to 105 cm-3, given the apparent thickness and radii of the lobes in IR images (Smith et al. 1998; 2002). Therefore, the density is within the regime for collisional fluorescence of H2 discussed by Sternberg & Dalgarno (1989). The [Fe ii]-emitting region seems to be spatially segregated from H2, and the electron density there can be estimated from ratios of some infrared [Fe ii] lines with weak temperature dependence that are all collisionally excited transitions with closely spaced energy levels near the ground state. Following Nussbaumer & Storey (1980; 1988), Table 3 lists values for derived from the diagnostic line ratios [Fe ii] 15335/16435, 15995/16435, and 16637/16435. The average of these is 104.1 cm-3 in the polar lobes, close to the expected value mentioned above. This implies that [Fe ii] in the lobes arises in ejecta from the Great Eruption, rather than post-eruption wind.
| Diagnostic | NW Lobe | LH | Fan | Weigelt blobs |
|---|---|---|---|---|
| log ()a | 4.0 | 4.0 | 5.3 | 5.8 |
| log ()a | 3.9 | 4.4 | 5.4 | 5.6 |
| log ()a | 4.2 | 4.2 | 5.0 | 5.8 |
| log (average) | 4.1 | 4.2 | 5.3 | 5.6 |
| 16435/Br | 26 | 26 | 3.4 | 0.74 |
| 12567/16435 | 0.7 | 0.7 | 1.0 | 0.99 |
aSee Nussbaumer & Storey (1980, 1988).
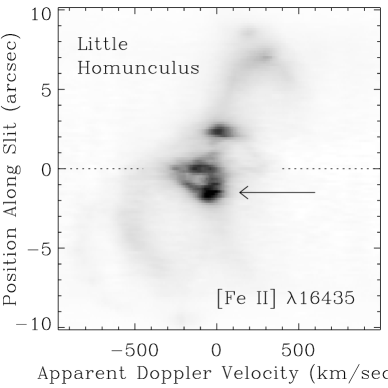
4 THE LITTLE HOMUNCULUS
Ishibashi et al. (2003) discovered a bipolar nebula expanding inside the Homunculus, based on spatially-resolved HST/STIS spectroscopy. Proper motions of structures in those data indicate that this ‘Little Homunculus’ seems to have an age of 100 years, perhaps ejected during the minor eruption of Carinae in 1890. The Little Homunculus (LH) can also be seen in some IR emission lines like [Fe ii] 12567 and 16435 (Figure 9). The bipolar shape of the LH in [Fe ii] 16435 is more prominent than in optical spectra because collisionally-excited IR lines like [Fe ii] 16435 are so bright, and because extinction from the SE lobe is less severe in the IR. The hollow structure of the LH’s blueshifted SE lobe is clear, but the NW polar lobe of the LH is fainter. Equatorial dust seen in thermal-IR images (Smith et al. 2002) may block light from the far side of the LH. Polar ejecta in the LH expand at speeds around 200 km s-1 in Figure 9. Walborn & Liller (1977) pointed out that during the 1890 eruption, absorption features were seen at 200 km s-1 in Car’s spectrum (Whitney 1952). This supports Ishibashi et al.’s claim that the LH may have originated in that event.
Figure 10 shows the IR spectrum at the brightest position in the LH, indicated by the arrow in Figure 9. [Fe ii] lines are enhanced, and most show a blueshifted component at about 500 km s-1 from the SE lobe of the Homunculus. H lines in Figure 10 are reflected from the wind and Weigelt blobs, and are not relevant to the LH itself. Table 2 lists intensities for emission arising in the LH; emission components from the Homunculus (including H2) and reflected wind lines are excluded.

The LH spectrum is qualitatively similar to the spectrum of the NW polar lobe, except that H2 emission is absent here. Most infrared [Fe ii] lines in the LH spectrum arise from one of two multiplets ( or ), which are collisionally-excited transitions with an upper level 1 eV from the ground state. The [Fe ii] 16435/Br ratio is quite high, like that seen in the NW polar lobe (see Table 3), and comments about the excitation mechanism described there may apply. However, an important difference is that the LH seems to lack bright thermal-IR emission from dust (Smith et al. 2002), as well as H2. A contribution from photoexcitation in the LH cannot be ruled out, but the spectrum of the LH definitely lacks strong intrinsic IR emission arising from Fe ii transitions pumped by UV fluorescence (see §5.1), which are prominent in some other ejecta near Car.
The [Fe ii] 12567/16435 ratio in the LH is nearly the same as for the NW lobe (Table 3), and so both suffer similar reddening from dust in the lobes. As with the polar lobe spectrum, ratios of certain [Fe ii] lines from the multiplet are useful for estimating the electron density in the LH, which appears to be 104.2 cm-3 (Table 3).
5 PECULIAR EQUATORIAL EMISSION
It is interesting that both the LH and the polar lobes of the larger Homunculus show strong intrinsic emission in collisionally-excited lines. These same tracers of collisional excitation are not seen in emission from equatorial gas, which would be projected in front of the NW lobe in Figures 4, 5, and 9. However, some lines do show interesting evidence for blueshifted equatorial emission, providing insight to the nature of Car’s equatorial ejecta.


5.1 IR Spectrum of the Fan
Optical continuum images (Morse et al. 1998) show a prominent feature extending a few arcseconds NW of the star, called the ‘Fan’, and it looks as if it is part of an equatorial spray. However, thermal-IR images reveal that the Fan is actually the dust column-density minimum in the equatorial ejecta and it appears to be a hole where we see through to the NW lobe (Smith et al. 1999, 2002). This hole may also allow UV photons to escape to larger radii and excite equatorial gas. Part of the Fan shows blueshifted emission with unusual excitation and strange kinematics (e.g., Zethson et al. 1999; Johansson et al. 2000), as well as some emission lines like [Sr ii] that are not seen anywhere else in the Homunculus (Hartman et al. 2001; Zethson et al. 2001).
Figure 11 shows the near-IR spectrum at one position in the Fan located 2 NW of the central star. At this position the ‘star’ and ‘EQ1’ slits intersect (see Figure 1), and the spectrum in Figure 11 was extracted from a 1 segment of the EQ1 slit. Like other positions in the Homunculus, strong [Fe ii] lines are seen in the Fan. [Fe ii] 16435 is still one of the strongest lines in the spectrum (perhaps due in part to contamination from the LH), but the 16435/Br ratio here (3) is lower than in the polar lobes or LH. The Br flux in Table 2 corresponds to the narrow intrinsic emission in excess of the reflected wind line; it is admittedly uncertain, but it seems difficult to avoid the conclusion that direct radiative excitation plays a more dominant role in the Fan than at other positions discussed so far. Other lines indicative of photoexcitation are also enhanced in the Fan’s spectrum, compared to the polar lobes or LH.
The [Fe ii] 12567/16435 ratio is 1 in the Fan. This is higher than in the polar lobes or LH, and lower reddening is consistent with the Fan’s equatorial geometry in front of the NW polar lobe. The electron density derived from [Fe ii] line ratios is 105.3 cm-3 (see Table 3), higher than in the LH or polar lobes, and near the critical density.
However, the unique characteristic of the Fan, as compared to the LH or polar lobes, is strong narrow emission from semi-forbidden Fe ii lines in Figure 11. Fe ii 16787, 16783, 17414, 19746, 20600 (blended with He i), and 20888 are all much stronger than in the polar lobes or LH. All these lines (see Table 2) are from the same multiplet , at higher energy than IR forbidden lines. Interestingly, the upper term is also the lower term of the anomolous UV lines near 2507 Å, which may be excited by a fluorescent Ly pumping mechanism (Johansson & Letokhov 2001). These infrared Fe ii lines seen in the Fan are cascades from those anomolously strong high-excitation fluorescent lines in the UV, and may be variable as well. The same IR lines are seen in the Weigelt blobs (see below), but not in any polar ejecta. The Fan also glows in He i 10830, while the LH and polar lobes do not. This seems to confirm the conjecture from the 16435/Br ratio that photoexcitation dominates the Fan’s spectrum, rather than collisions. More importantly, it appears that the peculiar fluorescent Fe ii lines are bright in equatorial gas, but are absent or weak in polar ejecta.
5.2 An Extended Equatorial Disk?
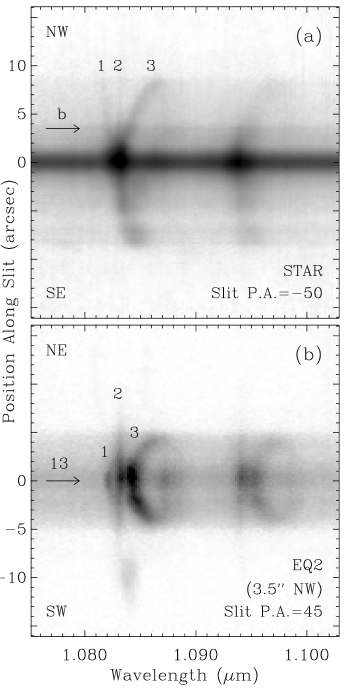
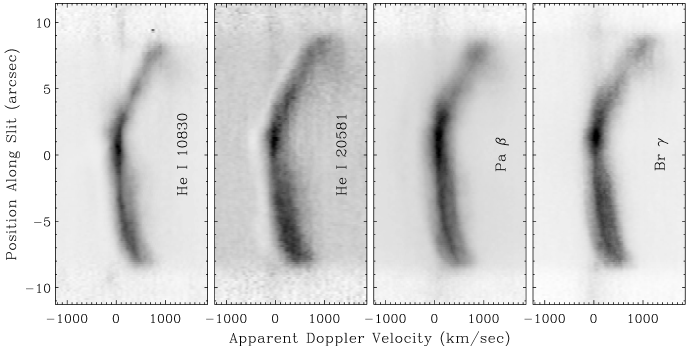
Near-IR spectra reveal some important clues about the kinematics of Car’s equatorial ejecta seen projected in front of the NW polar lobe with blueshifted velocities. The bright H2 and [Fe ii] emission lines discussed earlier did not show equatorial emission, but Figure 12 shows equatorial gas in other lines, such as He i 10830. Figure 12 shows the kinematic structure of He i 10830 and Pa along the slit oriented parallel to the major axis of the Homunculus at P.A.=50 (see Figure 1). Toward the NW of the star, the He i line clearly branches into three separate components, labeled 1, 2, and 3 in Figure 12. These components are also clearly seen and labeled in Figure 12, which shows a long-slit spectrum with the slit orthogonal to the polar axis (slit position ‘EQ2’ in Figure 1). From Figures 12 and , it is clear that component 3 corresponds to light from the star reflected by expanding dust in the polar lobes, and will not be discussed further.555However, note that reflected He i 10830 emission from the far wall of the NW polar lobe affects Fe ii 10863, 10872. Component 2 extends across and beyond the edges of the Homunculus in Figures 12 and at an almost constant low velocity. It is not seen toward the SE of the star; presumably component 2 resides near the equator, and the far side is blocked by dust in the SE polar lobe.
Component 1 is only seen in He i 10830. It is narrow, blueshifted, and has linearly increasing speed with distance (a Hubble flow). It most likely resides in the equatorial plane. Component 1 extends to (and probably beyond) the edge of the NW polar lobe in Figure 12, but Figure 12 reveals that it is confined to a narrow range of azimuthal angles associated with the Fan. Component 1 coincides spatially with the ‘purple haze’ seen in HST/WFPC2 images (Morse et al. 1998). Since the Fan is probably caused by a hole in the equatorial ejecta (Smith et al. 1999; 2002), it might allow a beam of UV starlight to escape to large radii in a disk and thereby excite the He i line. Note that component 2 shows H recombination emission, but component 1 does not. Thus, components 1 and 2 might occupy separate regions of space along different lines-of-sight to the central star.

Figure 13 shows a tracing of the He i 10830 line at 35 NW of the star in the Fan. Three velocity components are quite distinct at this location, with velocities of 325, 35, and 290 km s-1 for components 1, 2, and 3, respectively. Uncertainty in wavelength calibration is 20 km s-1, but relative velocities are reliable to within 5 km s-1.
With a known inclination =425 derived in §3, the age in years for equatorial gas with a given Doppler velocity (km s-1) can be inferred as a function of projected separation from the star in arcsec (with linear motion) using
| (3) |
where is the heliocentric distance in pc. Thus, at 35 NW of the star, component 1 at 325 km s-1 has a probable age of only 105 7 years — perhaps ejected during the minor eruption of Car in 1890. If component 2 traces slow gas near the equator, it may indicate older material with an age around 1000 years. Component 3 is not directly emitted by equatorial gas, as noted above, so equation (3) is inapplicable. Figure 13 shows that component 1 is not seen in hydrogen lines, but Pa from component 2 agrees quite well with He i emission. Interestingly, neither He i 10830 nor Paschen lines show evidence for an equatorial component originating in the Great Eruption.
These results might seem at odds with the conclusions of Zethson et al. (1999), but the new inclination angle =42.5 derived in §3 affects the strange radial velocities observed by those authors. At a particular position in the Fan at 13 NE of the star (their ‘Dsk 1’), Zethson et al. measured three velocity components at 136, 81, and 42 km s-1. An incorrect value of 35 assumed at that time led them to infer ages of 160, 280, and 620 years, respectively. However, with =425, Zethson et al.’s velocity components at 136 and 81 km s-1 would imply ejection during the 1890 outburst and the Great Eruption of Car, respectively (see their Table 6). Having derived a similar inclination angle of =41, Davidson et al. (2001) found two velocity components in the Fan consistent with ejection during the 1890 outburst and Great Eruption as well. Thus, the new inclination and structure of the Homunculus seem to partly resolve some problematic kinematics of the equatorial ejecta, and also support the presence of material younger than the Great Eruption. So far, this younger equatorial material from the 1890 outburst seems to be seen only in emission lines, while proper motions with HST images that trace primarily scattered continuum light do not detect it (Morse et al. 2001).

| Wavelength | I.D.b | Flux |
| (Å) | (erg s-1 cm-2) | |
| 9997 | Fe ii | 2.8410-11 |
| 10049 | H i Pa | 3.5510-11 |
| 10398 | [N i] | 3.3710-11 |
| 10407 | [N i] | 2.6210-11 |
| 10501 | Fe ii | 3.0610-11 |
| 10608 | [Fe iii] | 5.5910-12 |
| 10686 | Fe ii | 2.0810-11 |
| 10830 | He i | 1.2110-9 |
| 10863,72 | Fe ii | 3.4210-11 |
| 10912 | He i | 1.0110-11 |
| 10938 | H i Pa | 1.4210-10 |
| 11126 | Fe ii | 1.2710-11 |
| 11287 | O i | 1.8210-11 |
| 12384 | [Fe ii] | 1.9410-11 |
| 12528 | He i | 1.7710-11 |
| 12567 | [Fe ii] | 1.0510-10 |
| 12703 | [Fe ii] | 2.5710-11 |
| 12788 | [Fe ii] | 5.7310-11 |
| 12818 | H i Pa | 3.4510-10 |
| 12943 | [Fe ii] | 2.6910-11 |
| 12978 | [Fe ii] | 2.3710-11 |
| 13205 | [Fe ii] | 5.0510-11 |
| 13278 | [Fe ii] | 3.0710-11 |
| 15335 | [Fe ii] | 4.3910-11 |
| 15995 | [Fe ii] | 3.3910-11 |
| 16435 | [Fe ii] | 1.0610-10 |
| 16637 | [Fe ii] | 1.9110-11 |
| 16787 | Fe ii | 4.2910-11 |
| 16873 | Fe ii | 5.7410-11 |
| 17002 | He i | 2.0410-11 |
| 17111 | [Fe ii] | 1.5510-11 |
| 17338 | Fe ii ? | 1.3110-11 |
| 17414 | Fe ii | 1.1110-10 |
| 17449 | [Fe ii] | 8.2910-12 |
| 19746 | Fe ii | 3.9510-11 |
| 20151 | [Fe ii] | 2.1410-11 |
| 20460 | [Fe ii] | 4.1610-11 |
| 20581,600 | He i, Fe ii | 1.0810-10 |
| 20888 | Fe ii | 3.3210-11 |
| 21655 | H i Br | 1.4310-10 |
aSee Figure 17. If more than one wavelength is given,
the line is
blended, and both lines are expected to contribute
significantly.
bJ subscripts for Fe+ lines have been omitted.
6 THE STAR’S SPECTRUM: DIRECT AND SCATTERED LIGHT
6.1 The Central Core
Figure 14 shows the flux-calibrated spectrum of the bright central core of the Homunculus taken through a 0505 aperture in March 2001 during Car’s high-excitation state. It is essentially the combined spectrum of direct stellar light and the nearby Weigelt blobs included in the aperture. Figure 14 resembles the IR spectrum with the same spectral resolution presented by Hamann et al. (1994), who used a larger 4848 aperture. Detailed differences exist between Hamann et al.’s spectrum and Figure 14, but it is uncertain if they are due to temporal variability or aperture-size effects. Important changes have occurred since 1990 when Hamann et al. obtained their spectrum, and a 5 aperture certainly includes extended emission. The contribution of compact ejecta and reflected light are examined below.
One detail worth mentioning here (with some bearing on Car’s variability) concerns how the strength of He i 10830 varies with position or aperture size. Measured in a small 05 aperture, the bright central core region has a He i 10830 equivalent with of 205 Å in Figure 14. Farther out in the polar lobes, the He i 10830 equivalent width is significantly less; 125 Å in the NW lobe and 135 Å in the SE lobe. Independently, A. Damineli has been monitoring Car’s He i 10830 line over the past several years as seen in ground-based spectra with a larger aperture (a few arcsec). His measurements666http://www.igusp.usp.br/~damineli/etacar/index.html give an equivalent width roughly 15-20% less than in Figure 14 at nearly the same time. Thus, the strength of this line is somewhat diluted in a large aperture that includes more extended emission.
6.2 Resolving the Spectrum of the Weigelt Blobs
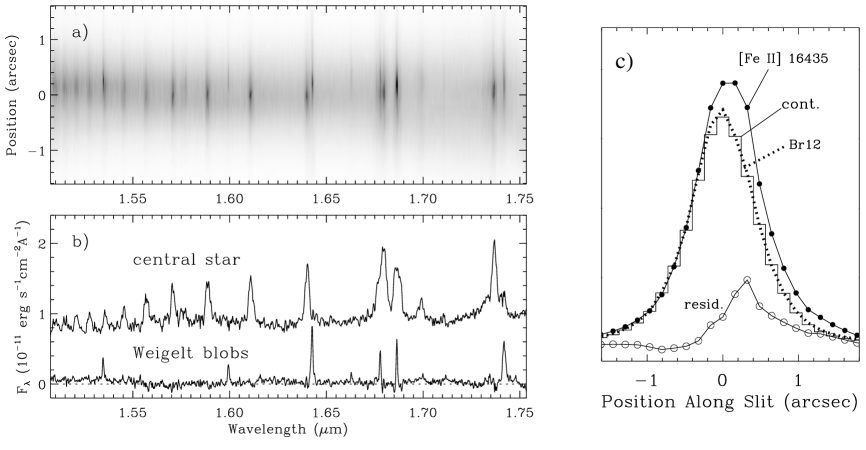
High-resolution imaging has resolved the bright core of the Homunculus into a star plus three bright ejecta blobs within 03 (Weigelt & Ebersberger 1986; Hofmann & Weigelt 1888; Weigelt et al. 1995; Morse et al. 1998). These ‘Weigelt blobs’ have a narrow emission-line spectrum different from the central star, and probably reside near the equator (Davidson et al. 1995; 1997). Emission from the Weigelt blobs is marginally resolved in the near-IR spectra presented here, allowing their combined spectrum to be separated from the central star for the first time at IR wavelengths. Figure 15 shows a long-slit spectrum in the H-band, concentrating on the inner few arceconds near the star. A few narrow emission lines seem to be offset from the star’s position. Figure 15 confirms this suspicion and proves that [Fe ii] emission from the Weigelt blobs is marginally resolved. Residual emission after subtracting the continuum emission from [Fe ii] has a centroid offset 02 to 04 from the star, as expected.
Thus, it is possible to separate these blobs from the star by extracting segments along the slit on either side of the star’s position. To the NW the emission is dominated by the blobs, and to the SE the star dominates. Figure 15 shows spectra of the Weigelt blobs and star, after subtracting the adjacent component.777The true spectrum of the Weigelt blobs will include starlight scattered by dust in the blobs themselves, but that has been subtracted here in addition to instrumental scattering. The uncontaminated spectrum of the central star in Figure 15 shows only broad permitted lines from the stellar wind, as expected following previous results with HST (Davidson et al. 1995, 1997). In general, Figure 15 separates broad wind lines from narrow nebular lines. In some cases this applies to two components of the same emission line; Fe ii 16873 is a salient example.
Figure 16 shows the full near-IR spectrum of the Weigelt blobs, produced the same way as Figure 15. It differs from previously published IR spectra of Car (Hamann et al. 1994), with only narrow emission lines. Table 4 lists fluxes that are not corrected for extinction or reddening. Infrared [Fe ii] line ratios indicate an electron density in the Fe+ zone above 105.6 cm-3 (see Table 3). This agrees with high densities inferred from optical spectra (Hamann et al. 1999).
The [Fe ii] 16435/Br ratio is 1 for the Weigelt blobs (Table 3). These compact ejecta near the star are almost certainly dominated by radiative excitation, so this reaffirms comments made earlier that the Fan is also dominated by photoexcitation. Like the Fan, and unlike the polar lobes and LH, the Weigelt blobs show bright Fe ii transitions that are cascades from levels populated by Ly fluorescence, directly following the bright lines near 2507 Å (Johansson & Letokhov 2001). As noted earlier, it appears that these fluorescence lines (at least in the IR) are only enhanced in equatorial ejecta. More generally, IR spectra of the Weigelt blobs, Fan, LH, and the polar lobes of the Homunculus all suggest that gas near the equator is radiatively excited, while polar directions are dominated by collisional excitation. Shock excitation in polar ejecta is understandable if the central star has a slow equatorial wind, and a fast polar wind (Smith et al. 2003) that is catching-up with previously ejected material. Excitation by radiative heating may also be possible in the polar lobes (Ferland et al. 2002). Strong photoexcitation and peculiar Ly fluorescence mechanisms localized in the equator seem harder to understand, but qualitatively they suggest that Lyman continuum radiation escapes preferentially at low latitudes in Car’s otherwise dense wind. This is broadly consistent with ideas about density structure in the wind expressed by Smith et al. (2003). This directional dependence of excitation in the Homunculus places interesting constraints on the geometry of the UV radiation field from the central star, expected to vary during Car’s spectroscopic cycle.

6.3 Reflected Spectra in the Polar Lobes
and the Stellar Wind Geometry
Despite the prominent H2 and [Fe ii] emission described above, the Homunculus is primarily a dusty reflection nebula. Thus, it provides the rare opportunity to observe the scattered spectrum of a star from multiple directions. Hillier & Allen (1992), Hamann et al. (1994), and others have shown that the spectrum observed in the middle of the SE lobe is essentially a reflected spectrum of the central star, with less contamination from narrow emission lines arising in circumstellar gas. However, so far reflected spectra have only been published for wavelengths below 1 .
Figure 17 shows details of the velocity structure at the NE slit position for four reflected stellar-wind emission lines: He i 10830, He i 20581, Pa, and Br, and Figure 18 shows tracings of the velocity profiles for these lines at several different offset positions listed in Table 5. Representative latitudes for these reflected spectra are also listed in Table 5, derived from the structure of the polar lobes in §3. Figure 19 shows line profiles for the central star and reflected light at a few representative positions in the Homunculus, but normalized to the same continuum level and superimposed on one another. The position 1 NE of the star is chosen to show reflected light from the star at nearly the same latitude as our direct line-of-sight, and the positions in the SE and NW polar lobes are chosen to represent reflected light as seen from high and low latitudes in the stellar wind, respectively.
Hydrogen lines (Pa and Br). Near-IR hydrogen lines show nearly symmetric, pure emission profiles at all latitdues, with minor variations in line shapes. Balmer lines, on the other hand, exhibit strong latitudinal dependence of P Cygni absorption (Smith et al. 2003). With the spectral resolution used here, near-IR hydrogen lines cannot offer definite constraints on the wind geometry, but they support the hypothesis that asymmetry seen in Balmer absorption (formed farther out in the wind) is due to an ionization/recombination imbalance caused by a density enhancement in the polar wind (see Smith et al. 2003).
| Position | Position | V | Latitudeb |
|---|---|---|---|
| (arcsec) | (km s-1) | (deg) | |
| 1 | NW 7.5 | 830 | 58 |
| 2 | NW 5.5 | 480 | 47 |
| 3 | NW 2.6 | 165 | 26 |
| STAR | 0 | 0 | 48 |
| 4 | NE 1.0 | 75 | 45 |
| 5 | SE 2.4 | 120 | 63 |
| 6 | SE 4.0 | 190 | 72 |
| 7 | SE 5.7 | 240 | 83 |
| 8 | SE 8.0 | 430 | 71 |
aSee Figure 18.
bUncertainty in latitude is at least 5.
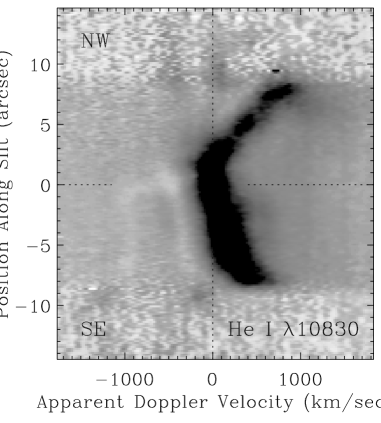
Helium lines. Unlike He i recombination lines at optical wavelengths, He i lines at 10830 and 20581 Å show P Cygni absorption at all viewing angles except some positions in the NW lobe contaminated by equatorial emission (see §5.2). Tracings of 20581 in Figures 18 and 19 show that the star has much deeper absorption than any reflected positions, even positions at roughly the same latitude; perhaps this is a radiative transfer effect similar to the excess emission seen in direct light from the central star at both optical and IR wavelengths (see Smith et al. 2003 and below). Tracings of reflected He i 20581 show weak latitudinal dependence in P Cyg absorption at about 550 km s-1, but the He i 10830 absorption structure seen in the long-slit spectrum in Figure 20 is quite remarkable. The complex blueshifted He i 10830 absorption in Figure 20 may be a combination of P Cygni absorption in the stellar wind at velocities of roughly 550 km s-1, plus nebular absorption from a shell outside the Homunculus, analogous to the Ca ii absorption mentioned earlier. The fast blueshifted absorption has a kinematic structure and radial velocity similar to the outer bubble seen in [Fe ii] 16435 in Figures 4 and 5. Thus, this outer nebular material may be responsible for the high-speed blueshifted absorption in the 10830 line seen by Damineli et al. (1998), rather than a fast component of the stellar wind. It may also causes the fast blueshifted absorption component seen in some UV resonance lines by Viotti et al. (1989). There is fast (1000 km s-1) material in Car’s wind, but so far it has only been detected in reflected Balmer lines (Smith et al. 2003).

Reflected emission peaks for both H and He i lines have comparable strengths at various latitudes, and all are weaker than the peak emission for lines seen in direct light from the central star. This effect is significant – line profiles in Figure 19 are plotted with a logarithmic vertical axis. The same effect has been noted for optical lines in Car, and does not yet have a suitable explanation (Smith et al. 2003).
Another trait shown by both He i and H line profiles in Figure 19 is that reflected lines seen in the SE polar lobe (crosses) are always broader and extend farther toward the red than reflected lines seen in the NW polar lobe (histogram). This is also apparent in Figures 17 and 20, and is consistent with the behavior of optical He i lines and the geometry they imply (Smith et al. 2003); Balmer emission lines do not show this trend. Thus, infrared He i and H lines may trace a deep and important region of the wind (perhaps 10 to 100 stellar radii; see Hillier et al. 2001) where asymmetries arise. Spatial variation in these line profiles are worth a more detailed look with higher spectral resolution.
7 SUMMARY
Spatially-resolved IR data reveal numerous details of the apparent spectrum as a function of position in the Homunculus, described above. General results are summarized here:
1. Kinematic structure of [Fe ii] and H2 lines in the Homunculus give the clearest picture yet of the geometry of the polar lobes, with 425. The far side of the SE lobe is seen clearly for the first time in these emission lines.
2. These near-IR spectra reveal bright [Fe ii] emission from a ‘Little Homunculus’ that was discovered previously at optical wavelengths (Ishibashi et al. 2003), and offer some constraints on the physical conditions in that relatively small bipolar nebula. The Little Homunculus has no H2 emission.
3. [Fe ii] emission and He i 10830 absorption reveal the existence of fast moving material outside the Homunculus that is projected along the line-of-sight to the SE polar lobe.
4. The Fan and other equatorial ejecta have different spectral characteristics than the polar lobes, including blueshifted He i 10830 emission that apparently comes from material ejected after the Great Eruption.
5. The Weigelt blobs appear to be marginally resolved in these long-slit near-IR spectra. Subtracting the star’s spectrum allows the IR spectrum of the Weigelt blobs to be isolated for the first time.
6. There is a strong directional dependence of excitation in Car’s circumstellar ejecta. IR spectra of equatorial gas are characteristic of radiative excitation and Ly fluorescence, whereas polar ejecta are collisionally excited (either due to shocks or indirect radiative heating). In other words, ejecta near the equator “see” strong emission in the Lyman continuum, and polar ejecta do not. This has important implications for the geometry of Car’s UV radiation field, and that geometry seems qualitatively consistent with the stellar wind structure during Car’s normal high-excitation state proposed by Smith et al. (2003).
7. Reflected emission in the Homunculus provides multiple viewing angles to the star, and IR wind lines show some interesting variation (although not as dramatic as Balmer absorption). Both He i 10830 and 20581 show P Cygni absorption at nearly all latitudes at roughly 550 km s-1, whereas IR hydrogen lines show pure emission profiles. Other details are discussed as well. For instance, high speed He i 10830 absorption arises in an outer nebula, rather than in a fast component of the stellar wind.
As implied frequently in this paper, these results can be improved
upon with higher spectral and spatial resolution that will soon become
available. In particular, such data can give us the first look at the
detailed clumpy structure of H2 in the polar lobes and its relation
to ionized gas, they can give us the best kinematic map of the Little
Homunculus, and adaptive optics will hopefully allow the IR spectrum
of the Weigelt blobs to be spatially-resolved without uncertainties
associated with the method used in this paper. Improved spectral
resolution combined with long-slit spectroscopy will also help us
understand latitudinal variations in He i 10830 and
other reflected lines. Finally, we must not forget that Car is
a notorious variable star. The directional dependence of excitation
indicated by IR emission lines may respond to changes in the
latitudinal density structure of Car’s wind during its 5.5 year
spectroscopic cycle (Smith et al. 2003), so emission from
circumstellar gas should also be monitored with long-slit IR
spectroscopy.
ACKNOWLEDGMENTS
I am grateful to Bob Blum and Patrice Bouchet for their help during the OSIRIS observing run, and to an anonymous referee for useful comments on the manuscript. Examining data obtained with HST/STIS has colored my interpretation of the IR spectra, and STIS measurements included in Figure 5 resulted from extant work done in collaboration with K. Davidson, T.R. Gull, K. Ishibashi, and J. Hillier. Conversations with K. Ishibashi were helpful in regard to the Little Homunculus discussed in §4, and I benefitted from discussions with G. Ferland about excitation in the Homunculus. NOAO payed for my travel to Chile and accomodations while at CTIO. I am also grateful for the support of a NASA GSRP fellowship from Goddard Space Flight Center.
References
- [] Allen D.A., Jones T.J., & Hyland A.R. 1985, ApJ, 291, 280
- [] Allen D.A., & Hillier D.J. 1993, Proc. astron. Soc. Australia, 10, 338
- [] Currie D.G. et al. 1996, AJ, 112, 1115
- [] Currie D.G., & Dowling D.M. 1999, in ASP Conf. Ser. 179, Eta Carinae at the Millenium, ed. J.A. Morse, R.M. Humphreys, & A. Damineli (San Francisco: ASP), 72
- [] Damineli A. 1996, ApJ, 460, L49
- [] Damineli A., Stahl O., Kaufer A., Wolf B., Quast G., & Lopes D.F. 1998, A&A SS, 133, 299
- [] Davidson K., Ebbets D., Weigelt G., Humphreys R.M., Hajian A.R., Walborn N.R., & Rosa M. 1995, AJ, 109, 1784
- [] Davidson K., Ebbets D., Johansson S., Morse J.A., Hamann F.W., Balick B., Humphreys R.M., Weigelt G., & Frank A. 1997, AJ, 113, 335
- [] Davidson K., Smith N., Gull T.R., Ishibashi K., & Hillier D.J. 2001, AJ, 121, 1569
- [] Dwarkadas V.V., & Balick B. 1998, AJ, 116, 829
- [] Ferland G., Davidson K., & Smith N. 2002, in preparation
- [] Frank A., Balick B., & Davidson K. 1995, ApJ, 455, 160
- [] Frank A., Ryu D., & Davidson K. 1998, ApJ, 500, 291
- [] Gaviola E. 1950, ApJ, 11, 408
- [] Gehrz R.D., & Ney E.P. 1972, S&T, 44, 4
- [] Graham J.R., Wright G.S., & Longmore A.J. 1987, ApJ, 313, 852
- [] Graham J.R., Wright G.S., & Longmore A.J. 1990, ApJ, 352, 172
- [] Hamann F., Davidson K., Ishibashi K., & Gull T.R. 1999, in ASP Conf. Ser. 179, Eta Carinae at the Millenium, ed. J.A. Morse, R.M. Humphreys, & A. Damineli (San Francisco: ASP), 116
- [] Hamann F., DePoy D.L., Johansson S., & Elias J. 1994, ApJ, 422, 626
- [] Hartman H., Zethson T., Johansson S., Gull T., Ishibashi K., Davidson K., & Smith N. 2001, in ASP Conf. Ser. 242, Eta Carinae and Other Mysterious Stars: The Hidden Opportunities of Emission Line Spectroscopy, ed. T.R. Gull, S. Johansson, & K. Davidson (San Francisco: ASP), 107
- [] Hillier D.J. 1997, in ASP Conf. Ser. 120, Luminous Blue Variables: Massive Stars in Transition, ed. A. Nota & H.J.G.L.M. Lamers (San Francisco: ASP), 287
- [] Hillier D.J., & Allen D.A., 1992, A&A, 262, 153
- [] Hillier D.J., Davidson, K., Ishibashi, K., & Gull, T.R. 2001, ApJ, 553, 837
- [] Hofmann K.H., & Weigelt G. 1988, A&A, 203, L21
- [] Ishibashi K., et al. 2003, AJ, submitted
- [] Johansson S., & Letokhov V.S. 2001, A&A, 378, 266
- [] Johansson S., Zethson T., Hartman H., Ekberg J.O., Ishibashi K., Davidson K., & Gull T.R. 2000, A&A, 361, 977
- [] McGregor P.J., Hyland A.R., & Hillier D.J. 1988, ApJ, 324, 1071
- [] McKee C.F., Chernoff D.F., & Hollenbach D.J. 1984, in Galactic and Extragalactic Infrared Spectroscopy, ed. M.F. Kessler & J.P. Phillips (Dordrecht: Reidel), 103
- [] Meaburn J., Wolstencroft R.D., & Walsh J.R. 1987, A&A, 181, 333
- [] Meaburn J., Walsh J.R., & Wolstencroft R.D. 1993, A&A, 268, 283
- [] Moorwood A.F.M., & Oliva E. 1988, A&A, 203, 278
- [] Morse J.A., Davidson K., Bally J., Ebbets D., Balick B., & Frank A. 1998, AJ, 116, 2443
- [] Morse J.A., Kellogg J.R., Bally J., Davidson K., Balick B., & Ebbets D. 2001, ApJ, 548, L207
- [] Mouri H., Nishida M., Taniguchi Y., & Kawara K. 1990, ApJ, 360, 55
- [] Nussbaumer H., & Storey P.J. 1980, A&A, 89, 308
- [] Nussbaumer H., & Storey P.J. 1988, A&A, 193, 327
- [] Oliva E., Moorwood A.F.M., & Danziger I.J. 1990, A&A, 240, 453
- [] Ringuelet A.E. 1958, Z. Astrophys., 46, 276
- [] Schulte-Ladbeck R.E., Pasquali A., Clampin M., Nota A., Hillier D.J., & Lupie, O.L. 1999, AJ, 118, 1320
- [] Seward F.D., Harnden F.R., Murdin P., & Clark D.H. 1983, ApJ, 267, 698
- [] Shull J.M., & Hollenbach D.H. 1978, ApJ, 220, 525
- [] Smith N. 2001, in ASP Conf. Ser. 242, Eta Carinae and Other Mysterious Stars: The Hidden Opportunities of Emission Line Spectroscopy, ed. T.R. Gull, S. Johansson, & K. Davidson (San Francisco: ASP), 81
- [] Smith N., & Davidson K. 2001, ApJ, 551, L101
- [] Smith N., Davidson K., Gull T.R., Ishibashi K., & Hillier D.J. 2003, ApJ, in press
- [] Smith N., & Gehrz R.D. 1998, AJ, 116, 823
- [] Smith N., & Gehrz R.D. 2000, ApJ, 529, L99
- [] Smith N., Gehrz R.D., Hinz P.M., Hoffmann W.F., Mamajek E.E., Meyer M.R., & Hora J.L. 2002, ApJ, 567, L77
- [] Smith N., Gehrz R.D., & Krautter J. 1998, AJ, 116, 1332
- [] Smith N., Gehrz R.D., & Krautter J. 1999, in ASP Conf. Ser. 179, Eta Carinae at the Millenium, ed. J.A. Morse, R.M. Humphreys, & A. Damineli (San Francisco: ASP), 31
- [] Sternberg A., & Dalgarno A. 1989, ApJ, 338, 197
- [] Thackeray A.D. 1951, Observatory, 71, 167
- [] Thackeray A.D. 1956a, Observatory, 76, 103
- [] Thackeray A.D. 1956b, Observatory, 76, 154
- [] Thackeray A.D. 1961, Observatory, 81, 99
- [] Viotti, R., Rossi, L., Cassatella, A., Altamore, A., & Baratta, G.B. 1989, ApJS, 71, 983
- [] Walborn N.R., & Liller M.H. 1977, ApJ, 211, 181
- [] Weigelt G., & Ebersberger J. 1986, A&A, 163, L5
- [] Weigelt G., et al. 1995, RevMexAA Ser. Conf., 2, 11
- [] Whitelock P.A., Feast M.W., Carter B.S., Roberts G., & Glass I.S. 1983, MNRAS, 203, 385
- [] Whitney C.A. 1952, Harvard Bull., No. 921, 8
- [] Zethson T., Johansson S., Davidson K., Humphreys R.M., Ishibashi K., & Ebbets D. 1999, A&A, 344, 211
- [] Zethson T., Gull T.R., Hartman H., Johansson S., Davidson K., & Ishibashi K. 2001, AJ, 122, 322