The Tully–Fisher relation of cluster spirals at = 0.83††thanks: Based on observations collected at the European Southern Observatory, Chile (66.A–0376).††thanks: Based on observations with the NASA/ESA Hubble Space Telescope, obtained at the Space Telescope Science Institute, which is operated by AURA, Inc., under NASA contract NAS5-26555.
Abstract
We present the rest-frame –band Tully–Fisher relation for a sample of 8 cluster spiral galaxies at and 19 field spirals at = 0.15–0.90 based on VLT spectroscopy and HST photometry. No strong difference is detected between the cluster and the field galaxies, but we find some evidence that the cluster spirals are –mag brighter than the field ones at a fixed rotation velocity. Although only a – result, if confirmed with larger samples this effect could be due to the cluster spirals experiencing a period of enhanced star formation while falling into the cluster.
keywords:
galaxies: spiral – galaxies: evolution – galaxies: clusters: individual: MS1054.403211 Introduction
Ground-based and HST observations indicate that the disk galaxy population in rich galaxy clusters has experienced remarkable evolution since . It has been argued that the increase with time of the S0 fraction and the simultaneous decrease in the spiral fraction suggest that star-forming spirals fall into distant clusters at a much higher rate than in the local Universe, and that these spirals ultimately become S0s when star formation is extinguished by the cluster environment (e.g. Dressler et al. 1997; Poggianti et al. 1999; but see also Andreon 1998). Recent hydro-dynamical simulations of the interaction of the gaseous components of disk galaxies with the intracluster medium support these ideas (Quilis, Moore & Bower, 2000). They also indicate that while the gas is being removed from the disk a brief period of enhanced star formation could be expected. The strong evolution of the cluster spiral population contrasts with the mild evolution observed in the field spirals to (Vogt, 1999, 2001, and references therein). To quantify the evolution of the cluster spirals, we are conducting a programme measuring the stellar and dynamical masses and ratios for a sizeable sample of morphologically-classified disk galaxies in rich galaxy clusters at . We here present the first results on the Tully–Fisher relation (Tully & Fisher, 1977) of cluster galaxies at .
We assume km sMpc-1 and in order to easily compare with Vogt and collaborators.
2 The data
2.1 Sample selection
We targeted the galaxy cluster MS105403 at since it is a rich X-ray selected cluster at high redshift and has extensive HST imaging and 8-m spectroscopy available. We based our galaxy selection on the spectroscopic and photometric catalogues of known cluster members of van Dokkum (1999) (see also van Dokkum et al., 2000). The spectroscopic catalogue was based on an –band selected sample with (corresponding to at this redshift). The catalogue gives Keck-based H and [OII] equivalent widths (EWs) and spectral types (Emission, Absorption or E+A). The photometric catalogue gives HST based magnitudes, colours and morphologies. The combined catalogue contains 87 galaxies, for which 74 have both photometric and spectroscopic information. From this sample, we selected spiral galaxies as follows:
-
1.
Galaxies having spiral morphology and Emission spectral type (EW([OII]) Å). We included galaxy 2011, which has spiral morphology, although it was originally classified as merger/peculiar (M/P). Two galaxies were removed due to geometric constraints (1733 and 1888X). This gave 6 galaxies, of which 5 yielded rotation velocities.
-
2.
Galaxies having spiral morphology and a less secure Emission spectral type (EW([OII]) Å, but with larger errors). This gave 4 galaxies, but only 2 rotation velocities.
-
3.
Galaxies having spiral morphology and no listed spectral type. After removing one galaxy (1354) due to geometry, this gave 2 Sa galaxies. However, we were unable to measure rotation velocities for them.
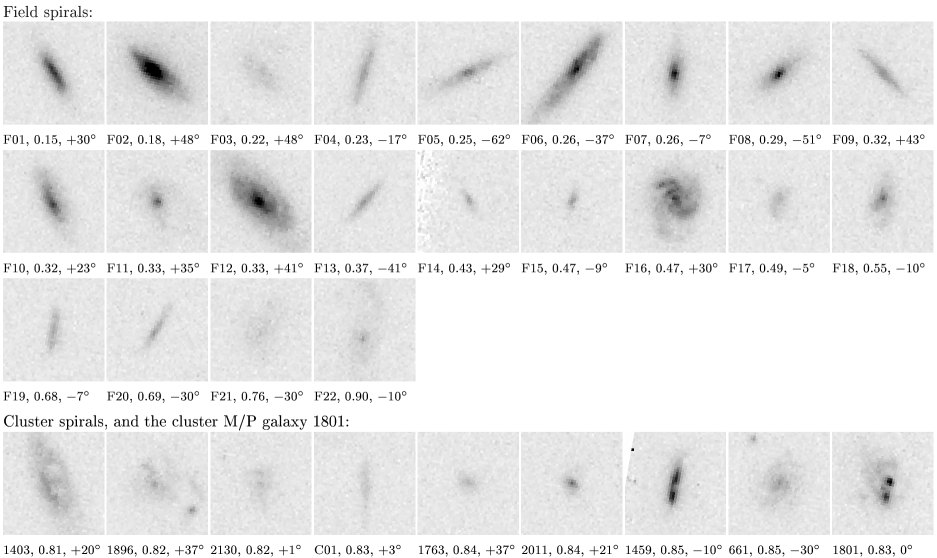
Twelve spiral galaxies in the catalogue (50%) did not have Emission spectral type, and these were not selected. All galaxies were required to have an inclination of (with being face-on). Finally, we included an M/P cluster galaxy with strong [OII] emission (1801) out of curiosity, since it did not conflict with any of the high priority targets. Thus, we started with a sample of 13 known cluster galaxies. To fill the remaining space in our two spectroscopic masks, additional galaxies were selected. We morphologically classified the galaxies in the WFPC2 mosaic which were not in the cluster catalogue of van Dokkum (1999) and then selected galaxies with spiral/disk morphology and . We imposed magnitude and colour limits corresponding to those spanned by the selected cluster galaxies, i.e., F814W = 20.1–22.7 and (F606WF814W) = 0.8–2.2. When there was a geometrical conflict, the brightest galaxy was chosen. In order to fill all gaps in the mask we sometimes relaxed the magnitude and colour limits. There were relatively few galaxies in the red end of our search window. This supplementary sample of 34 spirals yielded one additional cluster galaxy (C01, F814W = 22.25) for which the rotation velocity was measured, and 19 = 0.15–0.90 field galaxies with rotation velocities. The magnitude range for these was F814W = 19.1–23.2. The field galaxies observed provided an ideal comparison sample since it was observed under the same conditions as our cluster sample. A montage of WFPC2 images of the galaxies with detected emission is shown in Fig. 1.
2.2 Spectroscopy
Observations were carried out with the FORS2 instrument at the VLT (UT2) on 2001 Feb 23. Two spectroscopic masks were designed with position angles (PAs) at right angles to each other, in order to be able to cover all galaxy PAs. The slits were aligned with the major axes of the galaxies, tilting the slits with respect to the PA of the mask by an angle (cf. Fig. 1). The slits were 1′′ wide in the dispersion direction. Typical slit lengths were 11′′. The spectral resolution was FWHM = 4.2 Å, and the pixel size 1.075 Å 0.201′′. The median wavelength range was 5400–7600 Å. Each mask was observed for min. The seeing in the combined frames was 1.04′′ for mask 1, and 0.94′′ for mask 2.
Details of the spectroscopic data reduction will be given in Milvang-Jensen (2002, PhD Thesis, in prep.). Briefly, after bias subtraction, cosmic rays were removed using the 7 frames taken for each mask. The geometric distortion was mapped and removed using the edges of the spectra in the ‘dome’ flats. Dome and sky flats were used to correct for pixel-to-pixel variations and slit profiles respectively. The science frames were then cut up into individual slit spectra, wavelength calibrated, and sky subtracted.
Depending on redshift, different emission lines were visually identified in the 2D spectra ([OII]3726.1,3728.8, H, H, [OIII]4959, [OIII]5007 and H).
2.3 Rotation velocities
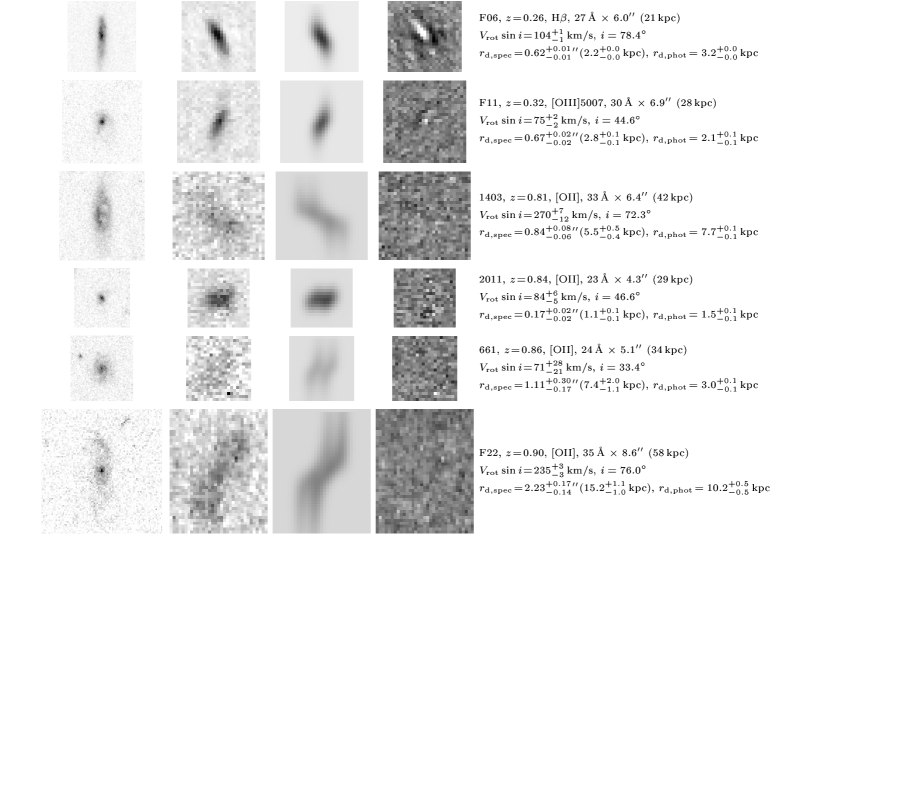
Projected rotation velocities were determined from the 2D emission line spectra using the synthetic rotation curve method of Simard & Pritchet (1998, 1999). A simple parametrized intrinsic rotation curve and an exponential emission intensity profile are assumed. Synthetic 2D emission line spectra are then produced taking into account known observational parameters such as seeing, spectral resolution and slit-width. The model parameters are: projected rotation velocity ; exponential scale length ; total line intensity ; residual background level ; and [OII] doublet intensity ratio . The main inputs are a continuum-subtracted postage stamp spectral image of the emission line, an estimate of the background noise, and the inclination (cf. Sect. 2.4). The Metropolis algorithm (Metropolis et al., 1953) is used to search the parameter space to get ‘best fit’ values and 68% confidence intervals.

The fitting was done for all well-detected emission lines. Examples of emission lines, model spectra and residual images are shown in Fig. 2. Out of the 31 galaxies with well-detected emission lines, 3 field galaxies did not yield acceptable fits. One (F04) had a strange line morphology: the line showed a tilt only on one side of the nucleus, whereas on the other the line was flat. Two (F02 and F06) had an intensity profile that looked more extended than exponential. F06 is shown in Fig. 2. The galaxies with rejected fits have been excluded from our analysis. The M/P cluster galaxy (1801) was surprisingly well matched to the model. However, the emission was asymmetric, being strongest in the two bright knots (cf. Fig. 1). We show this galaxy in Fig. 3, but we do not include it in the analysis.
Two different intrinsic rotation curves were tried: a step-wise flat rotation curve and the ‘Universal’ rotation curve of Persic & Salucci (1991). The latter is a function of the luminosity of the galaxy. The differences in the model images are small due to the effect of the seeing and the relatively coarse sampling. For the low luminosity galaxies the Universal rotation curve gives marginally higher rotation velocities that the flat one. For the high luminosity galaxies (i.e. the cluster galaxies and some of the field galaxies) there is little difference between the results from two rotation curves. In the analysis we will use the results from the Universal rotation curve, since this rotation curve has some physical motivation. For galaxies with more than one emission line in the observed wavelength range, the rotation velocities derived from the different lines agreed within the errors, and weighted averages were used in the analysis.
The ratio had a median value of 1.1 and a typical range of 0.7–1.7, in broad agreement with what is found locally (Ryder & Dopita, 1994). This indicates that the fitting procedure is producing sensible results. The fitted was typically in the range 0.2–1.2′′, and almost always greater than zero at the 3 level. Spectral signal is detectable and thus contributes to the fit up to typically 2 scale lengths.
2.4 Photometry
Photometry was carried out on the F814W and F606W HST+WFPC2 images (van Dokkum et al., 1999). The typical exposure time for the combined HST images was 3.3 ksec. Photometric zero points were taken from the May 1997 WFPC2 SYNPHOT update. The SExtractor programme (Bertin & Arnouts, 1996) was used to measure total magnitudes. Rest-frame magnitudes were derived from the observed F814W and F606W photometry. F814W matches almost exactly the rest-frame –band at , and thus the magnitudes can be derived very accurately for galaxies close to this . F606W matches the -band at . Thus, magnitudes for all the galaxies in our sample can be interpolated with reasonably small uncertainties. The interpolation (and in a few cases, small extrapolation) was carried out using spectral energy distributions (SEDs) of local galaxies with different spectral/morphological types (Coleman, Wu & Weedman, 1980). For each galaxy, the SED (or linear combination of SEDs) that yielded the observed (F606WF814W) colours at the galaxy’s redshift was chosen for the interpolation. The formal uncertainty in this transformation is very small (mag), but that assumes perfect knowledge of the filter response in each band. Tests with different filters indicate that systematic uncertainties of mag could be present, but these are negligible in our analysis. Absolute magnitudes corrected for internal extinction, , were calculated following Tully & Fouqué (1985). The correction, which is a function of , was in the range 0.32–0.96 mag, with a median value of 0.61 mag.
The disk inclinations () were determined on the F814W images using the GIM2D programme (Simard et al., 2002). The uncertainties on were included in the uncertainties on . The inclinations were in the range 33–82∘ (90∘ being edge-on), with a median value of 68∘.
3 Discussion of the Tully–Fisher relation
The Tully–Fisher plot is shown in Fig. 3(a). Galaxies 1459 and F03 deviate strongly from the rest. Galaxy 1459 may be two galaxies or a chain galaxy (cf. Fig. 1). Galaxy F03 has a very low surface brightness (the lowest in the sample). These two galaxies will be excluded from the analysis. In Fig. 3(a) we plot the local Tully–Fisher relation (TFR) from Pierce & Tully (1992), as adapted by Vogt (1999). Most of our field galaxies and all our cluster galaxies fall on the high luminosity/low velocity side of this relation. The absolute magnitude residuals at fixed rotation velocity () are plotted against redshift in Fig. 3(b). For the field galaxies, becomes more negative with (94% significance from a Kendall’s tau test). Assuming that the errors in are the individual measurement errors plus 0.6 mag added in quadrature (a guessed intrinsic scatter in the –band TFR for this redshift range), a chi-square fit for the field galaxies gives with . If taken at face value and interpreted as luminosity evolution, the effect is mag at , much larger than the mag Vogt (1999) found at similar redshifts. This interpretation assumes a non-evolving TFR slope, which is important since our field sample has a built-in positive correlation between luminosity and redshift. Our sample does not allow us to constrain the TFR slope, but Ziegler et al. (2002) found some evidence for a slope change at for a sample of 60 field spirals. Thus, the derived luminosity evolution of the field spirals must be regarded with extreme caution. One might worry that the low values instead reflected underestimated rotation velocities due to not detecting the emission at sufficiently large galactocentric distances. In that case low values should be accompanied by low values, and Kendall’s tau tests for the cluster and the field galaxies show this not to be the case.
In order to compare the cluster and field spirals, we will use a constant TFR slope equal to the local value. We will make this comparison under two alternative (and extreme) hypotheses. First, we will assume that the zero point of the field TFR does not evolve with and compare the residuals from the local TFR () for the field and cluster spirals. Second, we will assume that the zero point of the field TFR evolves with as shown by the dotted line in Fig. 3(b), and compare the residuals from the local TFR corrected for this evolution, . In both cases we compare the cluster sample () with the full field sample () and a field subsample spanning the luminosity range of the cluster galaxies (; ). Two statistical tests are carried out, a simple difference of the mean values (assuming rms uncertainties) and a Kolmogorov–Smirnov (K–S) test. For comparison purposes, the K–S probability that the field and cluster samples are drawn from two different populations has been translated into a number of sigmas for a normal distribution. The results of these comparisons are given in Table 1. The difference between cluster and field samples are larger and more significant using the first set of assumptions, but it is clear that the data suggest the cluster spirals are –mag brighter than the field ones at a fixed rotation velocity. The only other published cluster TF study at intermediate is that of Metevier, Koo & Simard (2002), who found a larger TFR scatter for their 7 cluster spirals at , but no evidence for a zero point or slope change. The larger look-back-time of our study could explain the fact that we do find some luminosity evolution.
The increment in luminosity that we have found could be the result of enhanced star formation in spiral galaxies falling onto the cluster. However, these suggestive results are far from conclusive since we have studied one single cluster and our current sample is small. It is clear that a similar study of a reasonable cluster sample, spanning a broad redshift baseline, can provide strong empirical results on the evolution of the cluster spiral population.
| Variable | Sample | [mag] | |
|---|---|---|---|
| All | () | 96% () | |
| High | () | 87% () | |
| All | () | 83% () | |
| High | () | 87% () |
Acknowledgements
We wish to thank Luc Simard for providing the ELFIT2D and GIM2D software, and for helpful discussions. We are grateful to Pieter van Dokkum and Marijn Franx for making their reduced WFPC2 images of MS105403 available. Douglas Clowe is thanked for letting us use a deep Keck image of MS105403. Gianni Busarello is thanked for suggesting the method used to remove the geometrical distortions from the spectra. We thank the referee Nicole Vogt for constructive comments that helped improve the presentation. This work was supported in part by the Gemini Observatory, which is operated by the AURA on behalf of the international Gemini partnership of Argentina, Australia, Brazil, Canada, Chile, the UK, and USA. Generous financial support from the Danish Research Training Council (BM-J) and the Royal Society (AA-S) is acknowledged.
References
- Andreon (1998) Andreon S., 1998, ApJ, 501, 533
- Bertin & Arnouts (1996) Bertin E., Arnouts S., 1996, A&AS, 117, 393
- Coleman et al. (1980) Coleman G. D., Wu C.-C., Weedman D. W., 1980, ApJS, 43, 393
- Dressler et al. (1997) Dressler A., Oemler A. J., Couch W. J., Smail I., Ellis R. S., Barger A., Butcher H., Poggianti B. M., Sharples R. M., 1997, ApJ, 490, 577
- Metevier et al. (2002) Metevier A. J., Koo D. C., Simard L., 2002, in ASP Conf. Ser.: Tracing Cosmic Evolution with Galaxy Clusters pp in press (astro–ph/0110194)
- Metropolis et al. (1953) Metropolis N., Rosenbluth A., Rosenbluth M., Teller A., Teller E., 1953, J. Chem. Phys., 21, 1087
- Persic & Salucci (1991) Persic M., Salucci P., 1991, ApJ, 368, 60
- Pierce & Tully (1992) Pierce M. J., Tully R. B., 1992, ApJ, 387, 47
- Poggianti et al. (1999) Poggianti B. M., Smail I., Dressler A., Couch W. J., Barger A. J., Butcher H., Ellis R. S., Oemler A. J., 1999, ApJ, 518, 576
- Quilis et al. (2000) Quilis V., Moore B., Bower R., 2000, Science, 288, 1617
- Ryder & Dopita (1994) Ryder S. D., Dopita M. A., 1994, ApJ, 430, 142
- Simard & Pritchet (1998) Simard L., Pritchet C. J., 1998, ApJ, 505, 96
- Simard & Pritchet (1999) Simard L., Pritchet C. J., 1999, PASP, 111, 453
- Simard et al. (2002) Simard L., Willmer C. N. A., Vogt N. P., Sarajedini V. L., Phillips A. C., Weiner B. J., Koo D. C., Im M., Illingworth G. D., Faber S. M., 2002, ApJS, 142, 1
- Tully & Fisher (1977) Tully R. B., Fisher J. R., 1977, A&A, 54, 661
- Tully & Fouqué (1985) Tully R. B., Fouqué P., 1985, ApJS, 58, 67
- van Dokkum (1999) van Dokkum P. G., 1999, Ph.D. Thesis, Univ. of Groningen
- van Dokkum et al. (2000) van Dokkum P. G., Franx M., Fabricant D., Illingworth G. D., Kelson D. D., 2000, ApJ, 541, 95
- van Dokkum et al. (1999) van Dokkum P. G., Franx M., Fabricant D., Kelson D. D., Illingworth G. D., 1999, ApJ, 520, L95
- Vogt (1999) Vogt N. P., 1999, in ASP Conf. Ser. 193: The Hy-Redshift Universe: Galaxy Formation and Evolution at High Redshift, p. 145
- Vogt (2001) Vogt N. P., 2001, in ASP Conf. Ser. 240: Gas and Galaxy Evolution, p. 89
- Ziegler et al. (2002) Ziegler B. L. et al., 2002, ApJ, 564, L69