Simultaneous Modelling of the Stellar Halo and Globular Cluster System of NGC 5128
Abstract
An important test for models of galaxy formation lies in the metallicity distribution functions (MDFs) of spheroid stars and their globular clusters (GCs). We have compared the MDFs obtained from spectroscopy of the GCs and the star-by-star photometry of the old halo red giants in the nearby elliptical galaxy NGC 5128, with the predictions of a CDM semi-analytic galaxy formation model. We have selected model ellipticals comparable in luminosity and environment to NGC 5128, and reconstructed their MDFs by summing the total star formation occurring over all their progenitors. A direct comparison between models and data shows that the MDFs are qualitatively similar, both have stellar components which are predominantly metal-rich (0.8), with a small fraction of metal-poor stars extending down to 0.002. The model MDFs show only small variations between systems, whether they constitute brightest cluster galaxies or low luminosity group ellipticals. Our comparison also reveals that these model MDFs harbour a greater fraction of stars at than the observations, producing generally more metal-rich (by 0.1 dex) MDFs. One possibility is that the outer-bulge observations are missing some of the highest-metallicity stars in this galaxy. We find good agreement between the model and observed GC MDFs, provided that the metal-poor GC formation is halted early (5) in the model. Under this proviso, both the models and data are bimodal with peaks at 0.1 and , and cover similar metallicity ranges. This broad agreement for the stars and GCs suggests that the bulk of the stellar population in NGC 5128 may have been built up in a hierarchical fashion, involving both quiescent and merger-induced star formation. The predicted existence of age structure amongst the metal-rich GCs needs to be tested against high-quality data for this galaxy.
keywords:
galaxies: interactions – galaxies: elliptical – galaxies: evolution – galaxies: individual: NGC 5128 – galaxies: star clusters1 Introduction
The task of understanding the star formation histories of elliptical galaxies is one of the most challenging areas of galaxy formation, and has generated a wide and steadily growing literature. For giant elliptical (gE) galaxies, the formation history may be particularly complex because these systems are likely to involve some (if not all) of the major formation processes that are currently debated, including singular or multi-phase collapse (e.g. [Silk (1977)] 1977; [Arimoto & Yoshii (1987)] 1987; [Forbes et al. (1997)] 1997), the hierarchical merging of gaseous fragments in the early universe (e.g. [Kauffmann et al. (1993)] 1993; [Dubinski (1998)] 1998; [Pearce et al. (1999)] 1999; [Cole et al. (2000)] 2000; [Somerville et al. (2001)] 2001), the major merging disc galaxies (e.g. [Schweizer (1987)] 1987; [Ashman & Zepf (1992)] 1992; [Barnes & Hernquist (1992)] 1992; [Shioya & Bekki (1998)] 1998; [Hibbard & Yun (1999)] 1999; [Naab & Burkert (2001)] 2001; [Bekki et al. (2002)] 2002) and ongoing dissipationless accretion of satellites (e.g. [Côté et al. (1998)] 1998; [Côté et al. (2002)] 2002).
Theoretical analyses employing sophisticated N-body simulations which include chemical evolution (e.g. [Shioya & Bekki (1998)] 1998; [Steinmetz & Navarro (1999)] 1999; [Koda et al. (2000)] 2000; [Kawata (2001)] 2001; [Lia et al. (2002)] 2002) and semi-analytic treatments (e.g. [Cole et al. (1994)] 1994, 2000; [Kauffmann (1996)] 1996; [Somerville & Primack (1999)] 1999; [Thomas (1999)] 1999) are rapidly adding to our ability to understand this early sequence of events.
However, observational constraints are badly needed to sort out the relative importance of these possibilities. In this paper, we explore the ability of one hierarchical merging code to reproduce the metallicity distributions of the recently obtained star-by-star halo photometry and GC system of the nearby elliptical galaxy NGC 5128.
At high-redshifts, there is some observational evidence that the bulk of the stars in at least a subset of galaxies may be in place as early as (e.g. [Dunlop et al. (1996)] 1996; [Franx et al. (1997)] 1997; [Dey et al. (1998)] 1998; [Nolan et al. (2001)] 2001; [Waddington et al. (2002)] 2002). These studies have been generally used to argue for single-collapse, high-redshift models of gE galaxy formation. Other discussions suggest a somewhat longer timescale and later epochs for much of the star formation (e.g. [Zepf (1997)] 1997; [Kauffmann & Charlot (1998)] 1998; [Barger et al. (1999)] 1999; [Menanteau et al. (2001)] 2001 – but also see e.g. [Jimenez et al. (1999)] 1999 for an different interpretation of the [Zepf (1997)] 1997 results).
On the observational side, an opportunity to test these models is through the metallicity distribution function (MDF) of the oldest stars in ellipticals. Indirect estimates of the MDF can be made through measures of the spectral features of their integrated bulge light (e.g. [González (1993)] 1993; [Davies et al. (1993)] 1993; [Kuntschner & Davies (1998)] 1999; [Trager et al. (1998)] 1998; [Terlevich & Forbes (2002)] 2002). However, two considerably more direct ways to study the MDF are now emerging as useful tools in the low redshift regime: star-by-star photometry of the old-halo red giant stars; and metallicity measurements of the old-halo globular clusters (GCs) within the galaxies. Despite observational biases and shortcomings (see below), these kinds of direct object-by-object construction of the MDF provide a level of new information that cannot be obtained in any other way.
Neither of these latter approaches is immune from the interpretive difficulties associated with all such studies: for example, metallicity measurements of either the old red-giant stars or GCs are uncertain to the degree that we know the particular mixture of ages present in the system, or even whether a well defined age-metallicity relation (AMR) exists. And for the GCs, other issues arise such as the efficiency of cluster formation, which might in principle vary with metallicity or even the epoch of formation.
Recently, [Beasley et al. (2002)] (2002) have applied a semi-analytic galaxy formation code [Cole et al. (2000)] to synthesise model MDFs for globular cluster systems (GCSs), and have compared these with real GCSs in early-type galaxies. Detailed discussion of the elements of the model can be found in these two papers. In the model, a large galaxy is progressively assembled from a population of highly gaseous proto-galactic fragments (in the Cole et al. model, these are modelled as rotationally supported discs, and in this study we use the terminology of proto-galactic discs (PGDs) used by [Beasley et al. (2002)] 2002). The most important feature for our purposes is that the formation process, during which time star formation goes on simultaneously with the hierarchical merging of these PGDs, gives rise to two main subpopulations of objects:
(i) a population of stars and metal-poor GCs that are built within the PGDs before they merge into the body of the larger central galaxy (termed the “quiescent mode” of star formation); and
(ii) a predominantly metal-rich population built in successive star-bursts generated during major mergers (“burst mode”). This burst mode can happen any time that a PGD (in the fiducial model defined as a minimum of 30% of the central galaxy mass) merges with the central galaxy, and so can continue until quite late epochs.
The quiescent mode of star formation generates a distribution over age and metallicity that is fairly smooth and continuous (star formation in this mode begins at 12 in the fiducial model, and continues at low levels until late epochs). The burst mode also produces stars over a significant fraction of a Hubble time, although the onset of merging begins after the first PGDs have formed from cooling gas. In this mode, the stellar populations formed are more metal-rich due to their formation from enriched gas, and are in the mean younger. Because these mergers are stochastically driven, the age and metallicity distributions formed in bursts can differ widely from one galaxy to another.
It is natural to associate the bimodal form of the GC MDF seen frequently for gE galaxies with the two subpopulations described above (e.g. [Zepf & Ashman (1993)] 1993; [Forbes et al. (1997)] 1997; [Larsen et al. (2001)] 2001). Typically, more or less equal numbers of GCs fall within each mode, and the two modes have metallicity peaks consistently near [Fe/H] and roughly independent of galaxy luminosity. In this interpretation, the “blue” GCs are seen as belonging to the earlier, quiescent mode while the “red”, more metal-rich ones arise from the burst mode.

However, [Beasley et al. (2002)] (2002) find that to predict the right numbers and metallicities of the GCs in each mode, it is necessary to impose two extra numerical factors: first, the formation times of the blue GCs formed in the quiescent mode must be truncated at an early epoch (otherwise they would continue forming to later and later times at higher and higher metallicities, and their MDF would then end up overlapping substantially with the red GCs). Second, the relative formation efficiency, defined as the mass ratio of GCs to all stars, , needs to be different for the two modes (otherwise the total numbers of GCs in each mode would be widely different). For the well studied prototype case of NGC 4472, [Beasley et al. (2002)] (2002) find best-fitting values , , and . As we show later (Section 6) the numerical value of is sensitive to a least one parameter in the semi-analytic model, and should not be taken as an ’absolute value’. The underlying physical reasons for enforcing the truncation at is not yet understood, but within the parameters of the semi-analytic model, it is necessary to impose this condition to maintain the observed numbers of GCs and the form of the MDF.
| Quantity | NGC 5128 | Galaxy #1 | #2 | #3 | #4 | #5 | #6 | #7 | #8 |
|---|---|---|---|---|---|---|---|---|---|
| MB | –21.0a | –22.63 | –21.49 | –21.28 | –21.13 | –21.06 | –20.97 | –20.61 | –20.32 |
| 114b | 1460 | 368 | 286 | 330 | 244 | 288 | 247 | 228 | |
| 3.9c | 3.0 | 3.2 | 4.3 | 5.5 | 3.2 | 6.6 | 5.1 | 4.0 | |
| 0.88a | 0.89 | 0.92 | 0.89 | 0.91 | 0.91 | 0.91 | 0.89 | 0.89 | |
| 2.79 | 2.93 | 3.02 | 2.91 | 2.97 | 2.97 | 3.00 | 2.94 | 2.93 | |
| MHI() | 0.830.25 e | 3.1 | 2.1 | 1.0 | 1.3 | 0.49 | 1.5 | 0.065 | 1.3 |
| 2.60.6f | 5.8 | 4.1 | 3.8 | 2.8 | 3.7 | 2.5 | 2.0 | 2.7 | |
| (KS)g | 1.0 | 0.35 | 0.63 | 0.66 | 0.80 | 0.78 | 0.63 | 0.78 | 0.35 |
a B-band absolute magnitude, integrated colour ([de Vaucouleurs et al. (1991)] 1991), b Cen A group velocity dispersion ([van den Bergh (2000)] 2000), c B-band mass-to-light ratio ([Hui et al. (1995)] 1995), integrated colour ([Pahre (1999)] 1999), calculated with unmatched apertures. e Neutral gas mass ([Richter et al. (1994)] 1994). f GC Specific frequency ([Harris (1991)] 1991). g Kolmogorov-Smirnov probability.
An obvious way to develop these tests further is to compare the predictions of the semi-analytic model with the MDFs for both the GCs and field-halo stars simultaneously in the same galaxy. A new opportunity to do this has arisen with NGC 5128, the giant galaxy at the centre of the Centaurus group at Mpc [Harris et al. (1999)]. Through several recent HST-based studies, its halo red-giant stars have been resolved and used to construct well defined MDFs ([Soria et al. (1996)] 1996; [Harris et al. (1999)] 1999; [Marleau et al. (2000)] 2000; [Harris & Harris (2000)] 2000, 2002). In addition, metallicity measurements based on spectroscopic indices are now available for 40 of its halo GCs ([Held et al. (2002)] 2002). The time is thus ripe to combine this observational material to test the validity of these models, and see if a consistent formation history of this galaxy can be constructed.
The paper is organised in the following way: In Section 2, we summarise the observational data used in this study. In Section 3, we briefly discuss the aspect of the semi-analytic model most relevant to this study, namely the star formation recipe employed. Next, in Section 4, we show example outputs of the MDFs and star formation histories of eight model elliptical galaxies and their associated GC systems. In Section 5, we pursue a specific comparison between one arbitrarily selected galaxy and the observational material. In Section 6 we vary the parameter which controls the threshold for star-bursts in the model to test the robustness of the results from the fiducial semi-analytic model. In Section 7, we propose a possible age-metallicity relation for the NGC 5128 GCs to be tested against future data and finally in Section 8 we summarise our conclusions.
2 Summary of the Observational Data
For the stellar halo of NGC 5128, MDFs based on large samples of stars have been obtained through HST/WFPC2 photometry. A finely spaced grid of red-giant evolutionary tracks, calibrated against Milky Way GCs, is then superimposed on the colour-magnitude diagram for the NGC 5128 stars and used to define the stellar metallicity distribution ([Harris et al. (1999)] 1999; [Harris & Harris (2000)] 2000, 2002). To date, MDFs are available for three different locations in the NGC 5128 halo. The first two are located at projected galactocentric distances of 21 and 31 kpc ([Harris et al. (1999)] 1999, [Harris & Harris (2000)] 2000) and so are likely to be representative of only the outer halo. The third of these is a field located at 8 kpc which therefore samples a combination of the halo and bulge (see the discussion of [Harris & Harris (2002)] 2002). For our present purposes, we will use this inner (halo plus bulge) sample to define a broadly based MDF representing a plausible average over the galaxy as a whole.
In this paper we compare our model results for GCs with the spectroscopically derived metallicities of [Held et al. (2002)] (2002). These indices are transformed into [m/H] log ) as described in [Harris & Harris (2002)] (2002), yielding 40 GCs drawn widely from all over the NGC 5128 halo. We note that the GC photometric metallicities from the indices of [Harris et al. (1992)] (1992) and the indices of [Rejkuba (2001)] (2001) are consistent with the [Held et al. (2002)] (2002) GC metallicity distribution. All three of the above GC studies probe regions well beyond the central dust lane (which contains a small number of 1 Gyr old GC candidates associated with a recent merger event, e.g. see [Holland et al. (1999)] 1999). The [m/H] histograms for both the field-star and spectroscopic GC sample are shown in Figure 2.
Although small-number statistics may still be affecting our estimates of the true proportions of metal-poor and metal-rich GCs (lower panel of Fig 2), the GC and field-star MDFs are clearly quite different. Roughly half the GCs are more metal-poor than [m/H]= –1, whereas remarkably small numbers of field stars populate this low-metallicity range. Another way to quantify this is to say that the specific frequency of GCs to field stars is a function of metallicity ([Harris & Harris (2002)] 2002). The stellar-halo MDF (upper panel of Fig. 2) has a single major peak at [m/H] –0.4, though it is clearly not symmetric, having a long and thinly populated low-metallicity tail. These two very different MDFs – stellar and GC system – must be matched by the semi-analytic model simultaneously.
3 Star Formation in the Model
The semi-analytic model we test in this study is the fiducial version of galform, as described in detail by [Cole et al. (2000)] (2000)(where =0.7, with , =0.3, =0.7, =0.7). Its application to the modelling of the GC systems of elliptical galaxies is presented in [Beasley et al. (2002)] (2002).
This fiducial version of the [Cole et al. (2000)] model was developed to best match local galaxy properties, in particular the local B-band luminosity function. As such, the model should possess genuinely predictive powers. Therefore, for the majority of this study, we retain the identical parameter values given in [Cole et al. (2000)] (2000). However, in Section 6 we vary the parameter which controls the burst threshold to test the robustness of the form of the MDF in the model.
Since we are examining the stellar metallicity distributions of the model ellipticals here, it is the details of the model star formation that we are primarily interested in here. We briefly discuss the salient points, although for a full description see [Cole et al. (2000)] (2000). In the model, the PGDs are modelled as rotationally supported, exponential gas discs. This is for convenience only, whereas in reality they may be expected to form a continuum of objects from flattened discs, to more clumpy systems dominated by random motions. To avoid possible confusion with spiral discs, we continue to refer to these objects as “PGDs”.
Star formation in the model proceeds in two modes, quiescently in PGDs and during the merging of these PGDs. The instantaneous star formation rate () occurring in these PGDs (the quiescent mode) is proportional to the mass of cold gas available (Mcold)
| (1) |
where is the star formation timescale, which is defined as
| (2) |
here, , where and are the circular velocity and half-mass radius of the PGDs respectively, whilst and are dimensionless parameters in the model.
Star formation also occurs during major mergers, controlled by the parameter , which is the mass ratio of the merger progenitors. In the fiducial model of [Cole et al. (2000)] (2000), , corresponding to a minimum mass fraction of 30% required to induce a major merger. During these major mergers, star formation proceeds similarly to that occurring quiescently in the PGDs, but is based upon the properties of the central spheroid (i.e. its dynamical time) rather than the properties of the merging PGDs. In the fiducial model used here 0, which as discussed in [Cole et al. (2000)] (2000), yields a scaling in equation 2, as suggested by results such as those of [Kennicutt (1998)] (1998).
In lockstep with this star formation, stellar winds and SNe are assumed to ‘feedback’ energy and mass into the IGM, re-heating cooled gas and depositing metals into the hot gas reservoir of the halo. The level of mass deposition from these PGDs is governed by the star formation rate and the feedback efficiency ()
| (3) |
with this feedback efficiency defined in terms of the PGD circular velocity
| (4) |
where is a dimensionless parameter, and is a parameter with units of .

In the above recipe, up to 30% of the total stellar mass of the model galaxies is composed of burst-formed stars, the rest originate from the quiescent mode. This, however, is not the only star formation prescription used in semi-analytic modelling. [Somerville & Primack (1999)] (1999) present a discussion of the principal star formation recipes used in contemporary semi-analytic models, and we refer the reader to this paper for a comparison of the different techniques.
4 Sample Model Galaxies
For this study, we initially make use of the 450 realisations of model elliptical galaxies (bulge-to-total 0.6) described in [Beasley et al. (2002)] (2002). These model galaxies span a B-band magnitude range of –22.7 MB - 5 log –19.5, and cover a range of environments (halo circular velocity) and masses. For direct comparison with the NGC 5128 MDF, we have selected eight model galaxies with luminosities that bracket the NGC 5128 luminosity of –21.0, and look for galaxies residing in groups rather than clusters. Beyond these luminosity and environmental constraints, the galaxies were chosen arbitrarily.
We list some of the relevant characteristics of NGC 5128 and the eight selected models in Table 2. The integrated colours of the model ellipticals are very similar to that of NGC 5128∗*∗* It should be noted that due to the large spatial extent of NGC 5128 on the sky, and the presence of dust in the disc of this galaxy, the reddening correction is somewhat uncertain [Israel (1998)]. (= 0.88; [de Vaucouleurs et al. (1991)] 1991). The model colours are somewhat redder than those given in [Pahre (1999)] (1999), although these were determined with unmatched apertures. This is agreement in the colours is significant, since the fiducial [Cole et al. (2000)] (2000) model has difficulty in reproducing the red colours of luminous spheroids ([Cole et al. (2000)] 2000; [Benson et al. (2002)] 2002).

The output metallicity histograms for the total stellar populations in eight model galaxies are shown in Figure 4. In each case, the distributions reflect the relative number of stars formed per metallicity bin, for our adopted yield, feedback efficiency and IMF (in this case Salpeter, see [Cole et al. (2000)] 2000 for a full list of fiducial model parameters).
The most luminous model galaxy (#1) is a central supergiant in a rich cluster, while the two faintest (#7 and #8) are galaxies smaller than NGC 5128. These are shown deliberately to help display the range of model outcomes that are possible. The other five are model galaxies that are roughly similar in size to NGC 5128 and drawn from roughly Centaurus-like group environments.
The different contributions of the quiescent and burst modes of star formation are plainly seen in these histograms: the ongoing quiescent mode, which takes place within the PGDs before they merge into the larger proto-galaxy, generate all the metal-poor stars in the distribution. It is broad and nearly featureless, and its range and maxima are very similar from one galaxy to the next in our luminosity range. By contrast, the burst portion which is predominantly metal-rich can differ widely between galaxies: each merger produces a -function of stars at the metallicity of the colliding gas, with amplitude in proportion to the amount of incoming gas available.
In Figure 6, we show the age distributions (look-back times) for the same eight sample models. Here, it is obvious that both star formation modes may continue to surprisingly late epochs (though not necessarily so; some of the galaxies end up their formation quite early, particularly in the dense environments that give rise to rich galaxy clusters). Later infall of gas (and subsequent bursts) is more prevalent in lower-density environments.
The galaxy-to-galaxy differences in the burst mode become particularly obvious for smaller elliptical galaxies. A smaller one which happened to be built by just one or two moderately large mergers will end up with a relatively narrow metal-rich stellar component, whilst a galaxy that was built by a longer sequence of many smaller bursts will have a much broader final MDF but will often have a rather similar mean stellar metallicity. On the other hand, the biggest ellipticals are almost always the end result of a large number of individual bursts, and so the metal-rich portion of the MDF for the biggest ellipticals is usually broad and moderately smooth once all these bursts are added together.
Since the quiescently-formed stellar component is fairly similar amongst all the ellipticals in the semi-analytic model, it is the merger-formed metal-rich end which displays most variation from one galaxy to another. In essence, the metal-rich end of the stellar MDF should become less broad, more fragmented and with larger galaxy-to-galaxy dispersion as we go to lower-luminosity galaxies.
In Figures 8 and 10 we show the MDFs and age distributions for the GCs in these same sample models. In all cases, we have adopted the parameters , , and as described previously. Thus for the blue GCs in each system, the age distribution is very sharply peaked, happening entirely between 13 Gyr and 12 Gyr look-back time. It is only for the red GCs that late formation times occur. The MDFs are generally bimodal in form, although the metal-rich portions have more complex substructure.


5 Confronting Theory with Observation
To pursue a direct comparison between the models and the NGC 5128 data, we superimpose the predicted MDFs of the eight model galaxies on these NGC 5128 data.
First, however, we need to account for the fact that the full information present in the model MDF will in observational terms be partly lost by the smearing effect of measurement uncertainty in [m/H]. The effect is to significantly smooth out the bursty, metal-rich end of the MDF while doing little to change the broad and already-smooth metal-poor end. For the NGC 5128 data from [Harris & Harris (2002)] (2002), the mean uncertainty is dex.††††††The measurement uncertainty in heavy-element abundance , as discussed by Harris & Harris (2002), is equivalent to 0.06 dex scatter in [m/H] for the upper giant branch stars used in their study. Since the grid of giant-branch models has a track spacing of dex, this uncertainty corresponds to about half a grid step.

We show the comparisons between the eight models the and NGC 5128 data in Figure 12. It is apparent that in their general characteristics, the agreement between the MDFs of the models and data is reasonably close. The shape and extent of the low-metallicity tails are generally similar, with small fractions of stars extending down to [m/H] –2.6.
There is no indication of an over-production of metal-poor stars ([m/H] –0.7) in the model – ’the G-dwarf problem’ – which is evident when a closed-box model is fit to these data (e.g. [Harris & Harris (2002)] 2002). In contrast to the closed-box ‘simple model’, where all heavy elements remain within the galaxy, the yield, , in the semi-analytic model is a function of the level of metal ejection into the hot gas phase () and the feedback efficiency, and becomes an effective yield, :
| (5) |
where is the fraction of mass recycled by stars. In this way, material processed by stars is mixed into the halo gas reservoir out to large radii. Therefore, large quantities of metal-poor stars are not produced in the semi-analytic model because there is continuous infall of gas onto the star forming PGDs from this cooling reservoir ([Kauffmann (1996)] 1996).
The metal-rich ends of the model MDFs in Figure 12 also show strong similarities to the NGC 5128 MDF. Both exhibit significant increases of stars towards high metallicity, peaking at or near solar abundances. However, it is at this metal-rich end that the differences are also most apparent. The model MDFs often extend to higher metallicities than is the case for the observed MDF. This yields mean metallicities between 0.1–0.2 dex more metal-rich than these data, depending upon the model galaxy selected. In some cases, this excess is manifest as an excess of stars at , although for models #1, #5 and #8 in particular it also appears that the effective yield is possibly too high, since they over-predict the number of stars at 0.1. Further inspection also reveals that the excess of stars at the metal-rich ends of the models result in MDFs which are 0.1 dex broader than these data. This is most evident for galaxy #1, the luminous gE galaxy in the centre of a rich cluster.
In assessing these comparisons, it must be born in mind that the observed MDF almost certainly underestimates the numbers of high-metallicity stars within NGC 5128 in total for two reasons: (a) as is discussed in Harris & Harris (2002), the number of red giant stars with found in the 8 kpc field is probably underestimated because of photometric incompleteness for these extremely red stars; and (b) the data samples only one location projected on the outer bulge.
Real elliptical galaxies have radial abundance gradients (e.g. [Davies et al. (1993)] 1993; [Gorgas et al. (1997)] 1997), and so the inner bulge of NGC 5128 may contain more metal-rich stars. Both of these effects would raise the upper envelope of the observed MDF and increase the metallicity at the MDF peak. By contrast, the model galaxies represent a globally averaged population because they contain no spatial information. The average abundance gradient of giant ellipticals is –0.2 0.1 dex (e.g. [Davies et al. (1993)] 1993). This corresponds to a reduction of 40% over a factor of 10 in radius, or a change in metallicity of 0.1 – 0.3 dex in going from 3 to 30 kpc. However, it remains to be seen whether this gradient will be manifest in a global metallicity shift in the observed distribution, or result in a change in the overall shape of the MDF.
Bearing in mind the dearth of observed stars at , we perform Kolmogorov-Smirnov tests on the eight model galaxies to quantify their goodness-of-fit with these data. The resulting probabilities that the models and data are drawn from the same distribution, (KS), are listed in Table 2. In terms of the model, as shown in Figure 4 the burst-formed stellar component displays a wide range of morphologies, with some model realisations providing better fits than others. The best fit is achieved for galaxy #4, the elliptical with - 5 log =–21.13, since the metal-rich end of this particular model is fairly narrow compared to other model galaxies in the sample.

We compare a selected model galaxy (in this case #2) and its GC system with the NGC 5128 data in Figure 14. This galaxy has been chosen somewhat arbitrarily, although its luminosity and environment is not too dissimilar to that of NGC 5128. The excess of metal-rich stars is particularly evident in this figure. For the GC comparison, we have shifted the Held et al. (2002) data by + 0.3 dex in order to approximate a conversion between [Fe/H] and [m/H]. Both the model and data are clearly bimodal; the model peaks at [m/H] –0.95 and –0.05, whilst the Held et al. dataset has peaks at [Fe/H] –1.2 and –0.3, corresponding to roughly [m/H] –0.90 and 0. The metal-rich end of the GC MDF is coincident with that of the model stellar MDF because both have the same origin in merger-induced star formation. As discussed in [Beasley et al. (2002)] (2002), a good fit is achieved at the metal-poor end only if the GC formation in PGDs is halted early (5).
6 The Effect of Star Bursts on the MDF
Since the primary purpose of this paper is to compare the predictions of the semi-analytic model with the observed MDF, our previous comparisons have been performed with the fiducial Cole et al. (2000) model. However, to test the robustness of these predictions, we now change the relative importance of merger-induced star formation (the burst mode) in the model. The following is not meant to be an exhaustive exploration of the parameter space, but rather is a test of the sensitivity of the model MDF output to the burst assumptions.
Two parameters which have a direct influence on the burst mode are and . As mentioned in Section 3, represents a mass ratio between the central and satellite galaxy, which determines whether a merger is classed as ’major’ or ’minor’. Major mergers result in a change in galaxy morphology (i.e. discs are destroyed, stars are redistributed into the bulge) and in general any cold gas is converted in its entirety into stars. Minor mergers result in a mass accretion, but do not give rise to disc destruction, or generally, star formation. Any cold gas belonging to the incoming satellite is added to the disc of the central galaxy.
The fiducial model of Cole et al. (2000) sets =0.3 (a 30% central-satellite mass ratio), which is the lower limit of the range suggested by numerical simulations of mergers ([Walker et al. (1996)] 1996; [Barnes (1998)] 1998). Increasing has the principal result of changing the morphological mix of galaxies in the model; a higher mass ratio results in fewer major mergers and more ’discy’ systems (e.g. [Benson et al. (2002)] 2002). The value of does not have a significant effect on the time (or metallicity) of the last merger and its star formation, since the model ellipticals are generally selected on the basis that they have undergone a merger recent enough to destroy any significant disc present. However, increasing does decrease the burst-formed component of the MDFs in the model, which is also governed by .
The parameter sets the threshold for a merger to cause a burst of star formation, and this is set to equal in the fiducial model. In this way, a burst of star formation implicitly occurs whenever there is a major merger with cold gas present. We can test the effect on the mean galaxian MDFs by changing to a smaller value, thus lowering the mass threshold required for a burst and increasing the mean number of bursts per galaxy. Setting allows impinging satellites to produce a burst of star formation without disrupting any disc present.
We have therefore re-simulated 500 early-type galaxies (B/T ratio 0.6) in approximately the same luminosity range as the previous realisations (–22.7 MB - 5 log –19.5). For this purpose, we use the updated version of the semi-analytic code described in [Benson et al. (2002)] (2002). To facilitate a direct comparison with our previous model realisations, we have turned off the photoionizing background contribution [Benson et al. (2002)] . The updated code produces essentially identical integrated properties to those of our previous realisations for luminous ellipticals at 0.
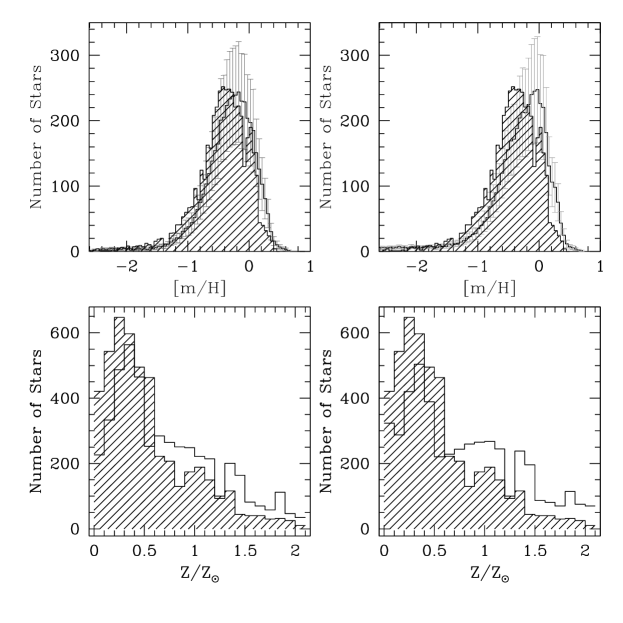
We compare the resulting MDFs with =0.3 (left panels) and =0.1 (right panels) in Figure 16. As shown in Section 5, whilst the form of the fiducial model MDF is very similar to these NGC 5128 data, the model is 0.1 dex offset towards the metal-rich end. The linear plots (Z/Z⊙) clearly show the excess of higher-metallicity stars. The model realisations with =0.1 (i.e. have on average more bursts of star formation) are slightly more metal rich again since the stars formed in bursts which contribute to the model MDF all have around solar metallicities. However, the differences are not significant; within the scatter the two sets of model realisations are identical.
In terms of the GCs, the model with =0.1 produces proportionally more metal-rich GCs than the fiducial model used in Beasley et al. (2002). From comparisons with the well-studied elliptical NGC 4472, Beasley et al. (2002) found that the formation efficiency (in the absence of dynamical destruction) of the metal-rich GCs, =0.007. By applying the normalisation to NGC 4472 described in Beasley et al. (2002), we find that =0.004 for =0.1. Thus effects the efficiency of the metal-rich GC formation, .
7 An Age-Metallicity Relation for NGC 5128?
We show the age-metallicity relation (AMR) of our model galaxy and its GCs in Figure 18. The dashed line in the figure indicates the average metallicity of stars at a given mass-weighted age in the galaxy. At 0, this galaxy has a mass-weighted mean age of 9.5 Gyr, and a mass-weighted metallicity of [m/H]= –0.1. Prior to 10 Gyr, the relation for the galaxy stars is steep, and rapidly flattens off at later epochs (e.g. [Kauffmann (1996)] 1996). This is broadly consistent with the behaviour of the solar neighbourhood AMR ([Edvardsson et al. (1993)] 1993; [Garnett & Kobulnicky (2000)] 2000), and that of the SMC star clusters [Da Costa & Hatzidimitriou (1998)].

The metal-poor GCs do not trace the enrichment history of the galaxy, but it should be noted that this feature of the blue clusters is a direct consequence of the model assumptions (the formation epoch of these clusters is deliberately truncated at 5). However, they clearly are able to enrich substantially (up to [m/H]= –1.0) prior to our truncation redshift. This is a result of the rapid enrichment undergone by ’dwarf’ size haloes in the model.
On the other hand, as metal-rich GCs are created in each major merger undergone by the galaxy, each burst of star formation produces GCs with ages and metallicities corresponding to the epoch of the merger. In this scheme, the metal-rich GCs are discrete tracers of the dissipational merging undergone by the galaxy. This is in contrast to the luminosity-weighted properties of the host galaxy since, not only will age-fading make any burst-formed stellar population virtually undetectable after a few Gyr (e.g. [Bruzual & Charlot (2001)] 2001), but also the rapidly decreasing cold gas fraction in PGDs towards later epochs leads to increasingly smaller burst-formed populations (e.g. see figure 2 in [Beasley et al. (2002)] 2002).
It is also worth noting in Figure 18, that a fraction of the metal-rich GCs are slightly more metal-rich than the global properties of the galaxy itself. This occurs because, whilst the GCs are formed from enriched, well-mixed gas of a single metallicity, the galaxian stellar population comprises of a mixture of metal-rich and metal-poor stars (e.g. Figure 14). Since merging is expected to produce new stars preferentially in the central regions of the merger product (e.g. [Mihos & Hernquist (1996)] 1996), the central kpc of the galaxy may be expected to have properties most similar to the mean properties of the metal-rich GCs.
Note that the extent of the blue GC AMR is sensitive to the truncation redshift we adopt, truncating their formation at later epochs results in more metal-rich GCs. The red GC AMR is a direct result of the merger histories in the hierarchical model.
8 Discussion and Conclusions
Semi-analytic models have had some success in reproducing the integrated properties of galaxies over a wide distribution in redshift (e.g. [Kauffmann et al. (1993)] 1993; [Kauffmann (1996)] 1996; [Baugh et al. (1996)] 1996; [Baugh et al. (1998)] 1998). In this paper, we have pursued a rather more specific comparison; that between the observed and predicted metallicity distribution functions of the old stars and GCs of a single elliptical galaxy.
Clearly some discrepancies arose in the comparison; as noted above, the most obvious one is that the metal-rich stellar component of the model is broader and more metal-rich than the observed MDF. However, it is important to remember we have compared an ensemble of model realisations to data for a single galaxy. Whilst integrated colours and spectra give some reason to believe the MDFs of ellipticals may be similar, the MDF of the outer bulge of the Milky Way [Zoccali et al. (2002)] shows some subtle differences from that of NGC 5128. Until more star-by-star MDFs are obtained for other ellipticals, the existence of significant variations (or lack thereof) in their MDFs has yet to be demonstrated.
In terms of the model, we could have altered a number of parameters to better fit the galaxy MDF. For example, decreasing the yield in the model by 0.1 dex would act to lower the global metallicity of the model MDF, better matching the metal-poor tail of the observed MDF (and GCs) shown in Figure 14. Since the expected theoretical yields for a given IMF are rather uncertain (e.g. [Prantzos (2000)] 2000) this would not be an unreasonable adjustment, although in so doing may weaken the successes of the model in reproducing other galaxy properties.
In any event, obtaining an exact match to the data was not the purpose of this study. Rather, our purpose was to see whether the star formation in the model leads to an adequate reproduction of the galaxy data, and whether in turn we may reconstruct a plausible star formation history for NGC 5128. In this respect, the agreement has been encouraging. The vast majority of the star formation in the model occurs ’quiescently’, where the interplay between gas cooling, star formation and feedback yields old stellar populations which are chemically enriched not unlike those observed in the NGC 5128 bulge/halo. Merging of this enriched gas creates an additional metal-rich component, including metal-rich GCs (e.g. [Beasley et al. (2002)] 2002).
Considering the relative simplicity of the star formation prescription in the semi-analytic model, the agreement between the observed and model MDFs is remarkable. We argue that this is also true for the metal-rich GCs, which fall naturally out of a hierarchical merging model. Constraining the red GC formation efficiency through observation is a reasonable undertaking until we have a consistent theory for globular cluster formation (e.g. [Ashman & Zepf (2001)] 2001). Formation of the blue GCs in the model requires for them to be disconnected from the star formation in their progenitors after the truncation redshift . Understanding the formation of the blue GCs will require an understanding of these high-redshift progenitors (e.g. [Bromm & Clarke (2002)] 2002; [Carlberg (2002)] 2002).
To conclude, we find that the metallicity distribution functions of stars and globular clusters in the nearby elliptical galaxy NGC 5128, currently the only such galaxy to have its MDF derived on a star-by-star basis ([Harris et al. (1999)] 1999; [Harris & Harris (2000)] 2000; 2002), are well reproduced by a semi-analytic model of galaxy formation ([Cole et al. (2000)] 2000; [Beasley et al. (2002)] 2002). Since the imprint of relatively old mergers may be hidden in stellar populations of galaxies, GCs may provide one of the few probes of this star formation. A large spatially unbiased sample of good quality spectra for NGC 5128 GCs will provide an important test of this scheme.
9 Acknowledgements
We would like to thank Daisuke Kawata, Brad Gibson and Chris Brook for lengthy discussions regarding this study, and Carlton Baugh for his hard work. Thanks also to E. Held for sending us his written contribution for IAU207 prior to publication, and the anonymous referee, whose input improved the paper substantially. This work was supported in part by the Natural Sciences and Engineering Research Council of Canada, through research grants to WEH and GLHH, and through Victorian Partnership for Advanced Computing grants to DAF.
References
- Arimoto & Yoshii (1987) Arimoto N., Yoshii Y., 1987, AAP, 173, 23
- Ashman & Zepf (1992) Ashman K. M., Zepf S. E., 1992, ApJ, 384, 50
- Ashman & Zepf (2001) Ashman K. M., Zepf S. E., 2001, AJ, 122, 1888
- Barger et al. (1999) Barger A. J., Cowie L. L., Trentham N., Fulton E., Hu E. M., Songaila A., Hall D., 1999, AJ, 117, 102
- Barnes (1998) Barnes J. E., 1998, in Saas-Fee Advanced Course 26: Galaxies: Interactions and Induced Star Formation, p. 275
- Barnes & Hernquist (1992) Barnes J. E., Hernquist L., 1992, ARA&A, 30, 705
- Baugh et al. (1996) Baugh C. M., Cole S., Frenk C. S., 1996, MNRAS, 283, 1361
- Baugh et al. (1998) Baugh C. M., Cole S., Frenk C. S., Lacey C. G., 1998, ApJ, 498, 504
- Beasley et al. (2002) Beasley M. A., Baugh C. M., Forbes D. A., Sharples R. M., Frenk C. S., 2002, MNRAS, 333, 383
- Bekki et al. (2002) Bekki K., Forbes D. A., Beasley M. A., Couch W. J., 2002, MNRAS, 335, 1176
- Benson et al. (2002) Benson A. J., Ellis R. S., Menanteau F., 2002, MNRAS, 336, 564
- Benson et al. (2002) Benson A. J., Lacey C. G., Baugh C. M., Cole S., Frenk C. S., 2002, MNRAS, 333, 156
- Bromm & Clarke (2002) Bromm V., Clarke C. J., 2002, ApJ Lett., 566, L1
- Bruzual & Charlot (2001) Bruzual G. A., Charlot S., 2001, in preparation
- Côté et al. (1998) Côté P., Marzke R. O., West M. J., 1998, ApJ, 501, 554
- Côté et al. (2002) Côté P., West M. J., Marzke R. O., 2002, ApJ, 567, 853
- Carlberg (2002) Carlberg R. G., 2002, ApJ, 573, 60
- Cole et al. (1994) Cole S., Aragon-Salamanca A., Frenk C. S., Navarro J. F., Zepf S. E., 1994, MNRAS, 271, 781
- Cole et al. (2000) Cole S., Lacey C. G., Baugh C. M., Frenk C. S., 2000, MNRAS, 319, 168
- Da Costa & Hatzidimitriou (1998) Da Costa G. S., Hatzidimitriou D., 1998, AJ, 115, 1934
- Davies et al. (1993) Davies R. L., Sadler E. M., Peletier R. F., 1993, MNRAS, 262, 650
- de Vaucouleurs et al. (1991) de Vaucouleurs G., de Vaucouleurs A., Corwin J. R., Buta R. J., Paturel G., Fouque P., 1991, in Third reference catalogue of bright galaxies (1991)
- Dey et al. (1998) Dey A., Spinrad H., Stern D., Graham J. R., Chaffee F. H., 1998, ApJ Lett., 498, L93
- Dubinski (1998) Dubinski J., 1998, ApJ, 502, 141
- Dunlop et al. (1996) Dunlop J., Peacock J., Spinrad H., Dey A., Jimenez R., Stern D., Windhorst R., 1996, Nature, 381, 581
- Edvardsson et al. (1993) Edvardsson B., Andersen J., Gustafsson B., Lambert D. L., Nissen P. E., Tomkin J., 1993, AAP, 275, 101
- Forbes et al. (1997) Forbes D. A., Brodie J. P., Grillmair C. J., 1997, AJ, 113, 1652
- Franx et al. (1997) Franx M., Illingworth G. D., Kelson D. D., van Dokkum P. G., Tran K., 1997, ApJ Lett., 486, L75
- Garnett & Kobulnicky (2000) Garnett D. R., Kobulnicky H. A., 2000, ApJ, 532, 1192
- González (1993) González J. J., 1993, Ph.D. thesis. Univ. Calif., Santa Cruz
- Gorgas et al. (1997) Gorgas J., Pedraz S., Guzman R., Cardiel N., Gonzalez J. J., 1997, ApJ Lett., 481, L19
- Harris et al. (1992) Harris G. L. H., Geisler D., Harris H. C., Hesser J. E., 1992, AJ, 104, 613
- Harris & Harris (2000) Harris G. L. H., Harris W. E., 2000, AJ, 120, 2423
- Harris et al. (1999) Harris G. L. H., Harris W. E., Poole G. B., 1999, AJ, 117, 855
- Harris (1991) Harris W. E., 1991, ARA&A, 29, 543
- Harris & Harris (2002) Harris W. E., Harris G. L. H., 2002, AJ, 123, 3108
- Held et al. (2002) Held E. V., Federici L., Cacciari C., Tesla V., 2002, AAP, in prep.
- Hibbard & Yun (1999) Hibbard J. E., Yun M. S., 1999, ApJ Lett., 522, L93
- Holland et al. (1999) Holland S., Côté P., Hesser J. E., 1999, AAP, 348, 418
- Hui et al. (1995) Hui X., Ford H. C., Freeman K. C., Dopita M. A., 1995, ApJ, 449, 592
- Israel (1998) Israel F. P., 1998, A&AR, 8, 237
- Jimenez et al. (1999) Jimenez R., Friaca A. C. S., Dunlop J. S., Terlevich R. J., Peacock J. A., Nolan L. A., 1999, MNRAS, 305, L16
- Kauffmann (1996) Kauffmann G., 1996, MNRAS, 281, 475
- Kauffmann & Charlot (1998) Kauffmann G., Charlot S., 1998, MNRAS, 297, L23
- Kauffmann et al. (1993) Kauffmann G., White S. D. M., Guiderdoni B., 1993, MNRAS, 264, 201
- Kawata (2001) Kawata D., 2001, ApJ, 558, 598
- Kennicutt (1998) Kennicutt R. C., 1998, ApJ, 498, 541
- Koda et al. (2000) Koda J., Sofue Y., Wada K., 2000, ApJ, 532, 214
- Kuntschner & Davies (1998) Kuntschner H., Davies R. L., 1998, MNRAS, 295, L29
- Larsen et al. (2001) Larsen S. . S., Brodie J. P., Huchra J. P., Forbes D. A., Grillmair C. J., 2001, AJ, 121, 2974
- Lia et al. (2002) Lia C., Portinari L., Carraro G., 2002, MNRAS, 330, 821
- Marleau et al. (2000) Marleau F. R., Graham J. R., Liu M. C., Charlot S. ., 2000, AJ, 120, 1779
- Menanteau et al. (2001) Menanteau F., Abraham R. G., Ellis R. S., 2001, MNRAS, 322, 1
- Mihos & Hernquist (1996) Mihos J. C., Hernquist L., 1996, ApJ, 464, 641
- Naab & Burkert (2001) Naab T., Burkert A., 2001, ApJ Lett., 555, L91
- Nolan et al. (2001) Nolan L. A., Dunlop J. S., Kukula M. J., Hughes D. H., Boroson T., Jimenez R., 2001, MNRAS, 323, 308
- Pahre (1999) Pahre M. A., 1999, ApJS, 124, 127
- Pearce et al. (1999) Pearce F. R. et al., 1999, ApJ Lett., 521, L99
- Prantzos (2000) Prantzos N., 2000, New Astronomy Review, 44, 303
- Rejkuba (2001) Rejkuba M., 2001, AAP, 369, 812
- Richter et al. (1994) Richter O.-G., Sackett P. D., Sparke L. S., 1994, AJ, 107, 99
- Schweizer (1987) Schweizer F., 1987, in Nearly Normal Galaxies. From the Planck Time to the Present, p. 18
- Shioya & Bekki (1998) Shioya Y., Bekki K., 1998, ApJ, 504, 42
- Silk (1977) Silk J., 1977, ApJ, 214, 152
- Somerville & Primack (1999) Somerville R. S., Primack J. R., 1999, MNRAS, 310, 1087
- Somerville et al. (2001) Somerville R. S., Primack J. R., Faber S. M., 2001, MNRAS, 320, 504
- Soria et al. (1996) Soria R. et al., 1996, ApJ, 465, 79
- Steinmetz & Navarro (1999) Steinmetz M., Navarro J. F., 1999, ApJ, 513, 555
- Terlevich & Forbes (2002) Terlevich A. I., Forbes D. A., 2002, MNRAS, 330, 547
- Thomas (1999) Thomas D., 1999, MNRAS, 306, 655
- Trager et al. (1998) Trager S. C., Worthey G., Faber S. M., Burstein D., Gonzalez J. J., 1998, ApJS, 116, 1
- van den Bergh (2000) van den Bergh S., 2000, AJ, 119, 609
- Waddington et al. (2002) Waddington I. et al., 2002, MNRAS, 336, 1342
- Walker et al. (1996) Walker I. R., Mihos J. C., Hernquist L., 1996, ApJ, 460, 121
- Zepf (1997) Zepf S. E., 1997, Nature, 390, 377
- Zepf & Ashman (1993) Zepf S. E., Ashman K. M., 1993, MNRAS, 264, 611
- Zoccali et al. (2002) Zoccali M. et al., 2002, AAP in press, (astro-ph/0210660)