Line emission from circumstellar disks around A stars††thanks: Based on observations with ISO, an ESA project with instruments funded by ESA Member States (especially the PI countries: France, Germany, The Netherlands and the United Kingdom) and with the participation of ISAS and NASA.
The nature of the tenuous disks around A stars has raised considerable controversy in the literature during the past decade. The debate whether or not the disk around Pictoris contains gaseous molecular hydrogen is only the most recent example. Since CO is in general a poor tracer for the gas content of these low mass disks, we discuss here detailed emission line calculations for alternative tracers like C and C+, based on recent optically thin disk models by Kamp & van Zadelhoff (Kamp2 (2001)). The [C ii] 157.7 m line was searched toward Vega and Pictoris — the most prominent A stars with disks — using ISO LWS data, and a tentative detection is reported toward the latter object. From a comparison with emission line observations as well as absorption line studies of both stars, the gas-to-dust ratio is constrained to lie between 0.5 and 9 for Pictoris. For Vega the [C ii] observations indicate an upper limit of 0.2 M⊕ for the disk gas mass. Predicted line intensities of C+ and C are presented for a range of models and appear promising species to trace the gas content in the disks around A stars with future instrumental capabilities (SOFIA, Herschel, APEX and ALMA). Searches for CO emission should focus on the =3–2 line.
Key Words.:
Stars: circumstellar matter – planetary systems: protoplanetary disks – Stars: early-type – Stars: individual: Pictoris – Stars: individual: Vega1 Introduction
A large number (20 – 40 %) of nearby A stars is surrounded by dust disks (Cheng et al. cheng (1992), Habing et al. habingb (2001)), see for example Pictoris (20 Myr; Barrado y Navascués et al. Barrado (1999)) or HR4796A (8 Myr; Stauffer et al. Stauffer (1995)). However, little is known about the nature of these disks: are they dusty debris disks or do they still have dust and gas and are possibly in a protoplanetary phase?
The disks around A stars have been extensively searched for gas. CO rotational line observations revealed too little gas compared to the detected dust. Upper limits suggest that the gas mass in these disks can be up to a factor of 1000 lower than deduced from the typical interstellar gas-to-dust ratio of 100 (Yamashita et al. Yamashita (1993); Savoldini & Galletta Savoldini (1994); Zuckerman et al. Zuckerman (1995); Dent et al. Dent (1995); Liseau & Artymowicz Liseau1 (1998); Liseau Liseau2 (1999)). This has been interpreted that the gas dissipates very rapidly from such disks on timescales of a few million years.
In a previous paper, Kamp & Bertoldi (Kamp1 (2000)) showed that in low mass optically thin circumstellar disks CO is likely to be photo-dissociated either by the stellar or by the interstellar ultraviolet (UV) radiation. If effective shielding prevents CO from being photo-dissociated, it is mainly found in the form of CO ice mantles on the dust grains in the cool outer disk regions. This indicates that CO is actually a poor tracer of the gas and one should look for alternative tracers. A similar conclusion has been reached for younger, more massive disks by Thi et al. (2001b ).
In order to calculate the line emission from different atoms and molecules in these disks a realistic modeling of the gas temperature is needed. With the low densities found in these disks, gas and dust are not in collisional equilibrium; hence the gas and dust temperatures divert. The computation of the gas temperature was performed by Kamp & van Zadelhoff (Kamp2 (2001)), including the relevant heating and cooling processes for the gaseous species.
Recently, Thi et al. (Thi (2001)) found hints of molecular hydrogen in the disk around Pictoris using the Short Wavelength Spectrometer (SWS) on board of the Infrared Space Observatory (ISO). They tentatively detected the S(0) and S(1) lines and deduced from the line ratio an excitation temperature of 100 K assuming LTE ( cm-3). The resulting H2 mass is 54 M⊕ with an uncertainty up to a factor of 3. On the other hand, Lecavelier des Etangs et al. (Lecavelier (2001)) failed to detect H2 line absorption superposed on the broad O vi emission doublet at 1035 Å using the FUSE satellite. Most recently, Olofsson et al. (Olofsson (2001)) observed extended emission in the gaseous Na i D lines using high resolution long-slit spectroscopy. The observed velocity pattern is consistent with resonance scattering arising in a disk in Keplerian rotation. The emission can be traced from less than 30 AU to distances of at least 140 AU.
This short summary of the debate on Pictoris shows definitely the need to find suitable gas tracers, which can resolve the question whether the disks around young A stars are debris disks without any gas, or protoplanetary disks in which gaseous planet formation may still proceed.
This paper concentrates on CO, C and C+ as possible gas tracers in these disks. Although H2 is contained in our chemical model, we abstain from a calculation of the near infrared molecular lines, since it would involve a detailed treatment of the ultraviolet pumping by stellar and interstellar photons which is beyond the scope of this paper. Moreover we do not calculate the Na emission from our models. Exploratory one-dimensional calculations indicate that in these disk models the Na i D pumping is not optically thin for the stellar radiation. Hence any radiative transfer has to take into account not only the stellar radiation field, but also the local radiation field arising from the Na atoms within the disk.
In the following sections we shortly summarize the basic properties of the optically thin disk models and describe the method used to derive the level populations and the line emission. We present results for a number of disk models with varying parameters and discuss them in the light of recent observations. In addition ISO LWS observations of the [C ii] 157.7 m line toward Vega and Pictoris are presented. At the end, suitable tracers to detect the gas in disks around A stars are discussed, and line intensities are calculated for future instruments and facilities.
2 The disk models
We use here the models for low mass disks surrounding A stars with stellar spectra similar to Pictoris and Vega presented in an earlier paper (Kamp & van Zadelhoff Kamp2 (2001)). We shortly summarize the main features of the models and refer to the two previous papers, Kamp & Bertoldi (Kamp1 (2000); hereafter Paper i) and Kamp & van Zadelhoff (Kamp2 (2001); hereafter Paper ii), for further details.
2.1 Basic physics of the models
We assume thin hydrostatic equilibrium models
| (1) |
with a dimensionless scale-height . The inner and outer radius of the disk are fixed to AU and AU. The power-law exponent of the disk surface density is , in reasonable agreement with the literature values of brightness profiles (Hayashi et al. Hayashi (1985); Dutrey et al. Dutrey (1996); Augereau et al. Augereau (2001)) ranging from to .
The radiation field is composed of a stellar and an interstellar component. The stellar field is described by an ATLAS9 photospheric model (Kurucz Kurucz (1992)) for the appropriate stellar parameters, while the interstellar component is described by a Habing (Habing (1968)) field with a flux of cm-2 s-1 from 912 Å to 1110 Å penetrating homogeneously through the entire disk.
The dust temperature follows from radiative equilibrium assuming large spherical black body grains of size
| (2) |
with the stellar luminosity in units of the solar luminosity . The assumption of radiative equilibrium is correct for the optically thin disks described in this paper. For higher mass, optically thick disks, the dust-temperature will depend on a detailed calculation of the transfer of photons, including scattering, through the disk. Scattering will in that case depend strongly on the dust-grain size. The use of a grain size distribution would directly affect the dust temperature and the shielding of UV radiation; the latter is negligible for the tenuous disks discussed in this paper. The dust temperature enters the chemistry e.g. via the formation of H2 and freezing out of CO and influences the gas temperature in some parts of the disk via IR pumping of e.g. O i fine structure lines. Moreover the photoelectric heating of the gas depends on the dust grain size distribution. For the purposes of this work, the grain size distribution is approximated by an effective dust grain size, which represents the mean properties of the dust phase. Hence, in the following a single grain size of 3 m is assumed for all calculations.
The gas temperature and the chemical composition of the circumstellar disk are derived by coupling the heating and cooling balance and the equilibrium chemistry. The most relevant heating processes are: heating by infrared background photons, heating due to the drift velocity of dust grains, cosmic ray heating, photo-electric heating, and heating due to formation and photo-dissociation of H2. Cooling, on the other hand, is dominated by [O i] and [C ii] fine-structure lines as well as the rotational lines of H2 and CO. The most uncertain process is the drift velocity heating: as grains are accelerated by the stellar radiation field and moving through the gas they loose part of their momentum. The final drift velocities reached by the dust grains depend strongly on the rotation of the disk — this cancels a certain fraction of gravity — and on the amount of momentum transfer assumed. In order to bracket reality we obtained disk models for the two extreme cases: no drift velocity and a maximum drift velocity
| (3) |
where is the thermal velocity of the gas, and is the radiation pressure on the grains.
The chemical network consists of 47 atomic, ionic, and molecular species that are related through 260 gas-phase chemical and photoreactions. A number of reactions is treated in more detail like H2 and CO photo-dissociation, and C ionization. The only surface reactions incorporated are H2 formation and freezing out of CO on cold dust-grain surfaces. Since we are dealing with large dust particles, we reduced the H2 formation rate according to the reduced grain surface area. The abundance of CO ice is due to a balance between freezing out of gaseous CO and reevaporation of CO ice. A modified Newton-Raphson algorithm is used to obtain a stationary solution of the entire chemical network.
2.2 Grid of A star disk models
We chose in Paper i and ii two very prominent representatives of the class of A stars with disks around them: Vega and Pictoris. They differ mainly with respect to the strength of their radiation field, with Vega, spectral type A0V, having an integrated ultraviolet flux about 6 000 times larger than the interstellar UV field at 40 AU, while the Pictoris UV field, spectral type A5V, is weaker than the interstellar field outwards of 53 AU. At 40 AU it is about 1.8 times the Habing field. These two radiation fields roughly give the lower and upper limits for A stars.
| a | |||||
| 0 | 0 | ||||
| Star Mgas | |||||
| [M⊕] | |||||
| A5V 0.2 | – | – | – | ||
| A5V 2.0 | |||||
| A0V 0.2 | – | – | – | ||
| A0V 2.0 | – | – | – |
Note: a and denote the stellar and
interstellar radiation field, respectively
b denotes that the
gas temperature is derived from the heating/cooling balance.
We use the disk models derived in Paper ii for both types of stars and we add two more models for the Pictoris case, where we include an interstellar UV radiation field penetrating homogeneously through the disk without any shielding. This is a valid assumption for disk masses of 2 and 0.2 M⊕ (see Paper i). Due to the high UV flux of an A0V star the interstellar radiation field can be neglected for Vega.
The mass of the disk around Pictoris is 54 M⊕ derived from the H2 S(0) and S(1) emission lines (Thi et al. Thi (2001)) and 44 M⊕ from dust emission, assuming a constant gas-to-dust mass ratio of 100 (Chini et al. Chini:91 (1991)). In this paper only calculations for lower disk masses are performed, 0.2 and 2.0 M⊕, which bracket the observations for Pictoris (upper limit for the CO emission lines and C i column densities from absorption lines). Our models require that the heating and cooling processes are optically thin. This prerequisite is not fulfilled in the disk models since the [O i] cooling lines will become optically thick.
In order to show the effects of the inclusion of interstellar radiation as well as to give an overview of the temperature structure and chemical abundances in the models presented here, two cases are described in more detail. In Fig. 1 two disks with a mass of 2.0 M⊕ are shown irradiated by a star of spectral type A5V. The disk model without interstellar UV radiation field (right hand side of Fig. 1) was presented in Paper II. The new model includes now also the interstellar UV field (left hand side of Fig. 1). For each model the temperature structure of the gas and dust are given as well as the densities of the molecular, atomic and ionic species at the midplane and at one scale height () of the disk. Both models are calculated under the assumption that . To show the effects of the drift velocity on the gas and dust temperatures, the corresponding models with are presented as well. As the chemistry depends only weakly on the temperature, at least in the temperature range covered in these models, the densities of each of the species are very similar with or without taking into account.
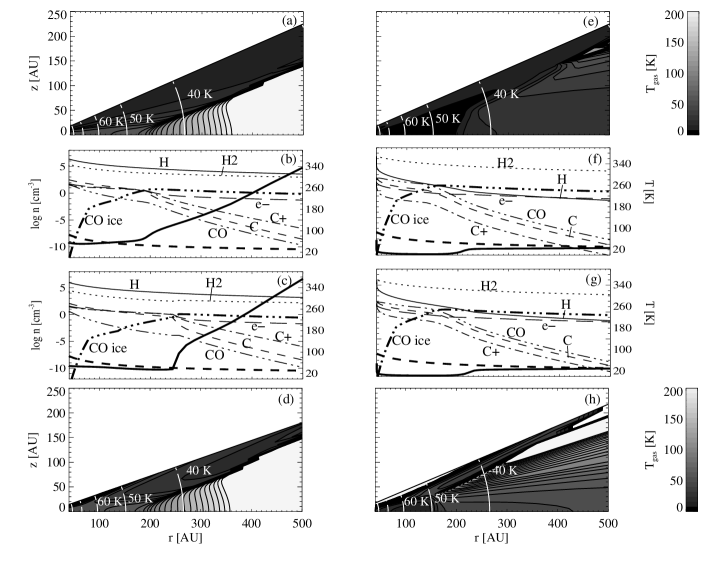
In the model without interstellar UV radiation field, hydrogen is mostly molecular and carbon is in the form of CO. As the dust temperature drops below 50 K, the critical value assumed in these models for CO molecules to freeze out onto grain surfaces, CO ice becomes the dominant carbon bearing species. The abundances of C and C+ drop according to the freeze out of the gaseous CO. The inner disk region has gas temperatures around 10 K due to efficient CO rotational line cooling. Outwards of AU, O i fine structure line cooling takes over, leading to slightly higher gas temperatures, K. The main heating processes are pumping of the O i fine structure levels by infrared background photons (inner part of the disk) and cosmic ray heating. If we include drift velocity heating, it becomes the dominant heating mechanism and as the cooling processes remain the same, the equilibrium gas temperature is higher. Even though the chemistry hardly changes due to the higher gas temperature, the excitation of atoms and molecules depends strongly on Tgas. Therefore, detailed modeling of emission lines from circumstellar disks has to be based on disk models with a realistic determination of the gas temperature.
The main difference arising from the inclusion of an interstellar UV radiation field is the enhanced dissociation of H2 and CO and the enhanced ionisation of C. The CO ice abundance (COice) is only marginally affected. In the disk with interstellar UV, CO is constantly formed and dissociated, but most of the CO freezes immediately out onto the grains. The COice is the sink for all C-bearing species at larger radii, except for the low density surface layer, where hardly any CO freezes out. Since the initial ratio of [O]/[C] 1, O together with C+ and H2 are the most important coolants available. Due to the enhanced UV flux, H2 dissociation and formation are the most important heating sources, leading to higher equilibrium gas temperatures than in the previous case without the interstellar UV radiation field. As soon as C+ is lost as a coolant because of its incorporation into CO ice, the gas temperatures rise quickly to values in excess of 100 K. Incorporating the drift velocity into this model does not alter the gas temperature, because H2 dissociation and formation heating are more efficient than drift velocity heating.
A complete list of all adopted models and performed radiative transfer calculations can be found in Table 1.
3 Radiative transfer calculations
For the line radiative transfer the Monte Carlo code developed by Hogerheijde & van der Tak (HvdT00 (2000)) is used. The disk models described in Sect. 2 are interpolated on a cylindrical grid ( grid cells), with a logarithmic radial grid in order to smoothly follow the density and temperature gradients. The size of the grid is small due to computational constraints. A comparison run with twice the number of grid cells gave a less than 20% difference in integrated line-intensity, comparable to the observational errors. The calculations concentrate on the non local-thermal-equilibrium (NLTE) intensities of the fine structure lines of C and C+ and the rotational transitions of CO. Table 2 shows the respective line data and beam sizes used for convolution in the section on comparison to observations (Sec. 6). The following paragraphs explain the calculations for the individual species in more detail.
| Line | Beam | |||
|---|---|---|---|---|
| [s-1] | [″] | |||
| C | 809.3 GHz | 3P2-3P1 | 6a;8b; | |
| 26c | ||||
| 492.2 GHz | 3P1-3P0 | 10a;13b; | ||
| 44c | ||||
| C+ | 157.74 m | 2P3/2-2P1/2 | 11c;16d | |
| CO | 115.3 GHz | 1-0 | 43a | |
| 230.5 GHz | 2-1 | 22a | ||
| 345.8 GHz | 3-2 | 14a |
a15 m telescope (SEST, JCMT),b12 m telescope (APEX),
cHIFI (Herschel), dSOFIA
In the above mentioned code, the equations of statistical equilibrium are solved in an iterative fashion, where all photons start at the outer boundary with an intensity given by the 2.728 K cosmic background radiation. The abundances of the trace species under consideration as well as their most important collision partners are taken from our stationary disk models (Paper ii and Fig. 1).
The code allows the use of two different collision partners and Table 3 shows the most important partners for each species and the respective references for the collisional rate coefficients. Stimulated absorption and emission by far-infrared radiation from dust is not significant for these species. For C–H2 and C+–H2 collisions, we assume that the ortho-to-para ratio of molecular hydrogen is determined by the local gas temperature. In the case of C+, scaled H2 collision cross sections for atomic hydrogen are used; hence the total density of the collision partner is given by the weighted sum of the H2 and H density, namely , and is considered as the second partner. Comparing CO–H and CO–e- collision cross sections, it is found that for , collisions with electrons are more important than collisions with neutral hydrogen. In the case of all A0V models and the A5V models with interstellar radiation, (H) is the main collision partner for CO; in the remaining models not enough H2 is dissociated and collisions with electrons dominate over atomic hydrogen collisions.
| Species | Collision partner | Reference |
|---|---|---|
| C | H2 | Schröder et al. (Schroeder (1991)) |
| H | Launay & Roueff (Launay (1977)) | |
| C+ | H2 | Flower (Flower (1977)) |
| H | Flower (Flower (1977))a | |
| e- | Mendoza (Mendoza (1983)), | |
| Keenan et al. (Keenan (1986)) | ||
| CO | H2 | Schinke et al. (Schinke (1985)) |
| H | Chu & Dalgarno (Chu (1975)) | |
| e- |
aScaled from H2 collision rates. See text for details.
The resulting populations at each position in the disk are used to compute the sub-millimeter line profiles of CO, C, and C+ using a ray tracing program which calculates the sky brightness distribution. Observations of circumstellar ultraviolet absorption lines of CO and C around Pictoris reveal a line-broadening parameter km s-1 (Roberge et al. Roberge (2000)). This value is used for all model calculations.
4 Results
As a first result the line profiles are calculated for a beam with the same size as the apparent diameter of the disk on the sky. The beam is centered on the stars and has a size of 50.5 ″ for simulating Pictoris and 128.9 ″ for Vega at their appropriate distances, 19.82 and 7.76 parsec, respectively. The adopted inclinations are taken from Pictoris (edge on) and Vega (face on).
Since the emission lines are optically thin, the integrated intensities can be converted directly to any inclination. These results can therefore be used for any disk around an A star as long as the total integrated flux is kept constant. In the following the presentation of the results is separated into two sections. The first deals with A5V and the second with A0V stars.
4.1 Spectral type A5V
We choose atomic carbon as an example to illustrate the effects of the various model parameters on the resulting line profiles (Fig. 2). The shapes of the emission-line profiles show a double peaked structure, with subtle differences due to excitation and/or abundances (e.g., Figs. 2f and 3b).

For the 2M⊕ model including the interstellar UV radiation field (Fig. 2c,d), the gas temperature rises above 50 K resulting in a 3P2–3P1/3P1–3P0 ratio of approximately unity. The carbon density rises by an order of magnitude compared to the other 2M⊕ models, because CO is no longer the dominant reservoir of carbon due to the additional photodissociation. There is no difference in gas temperature between the calculation with or without drift velocity heating, as the temperature balance is in this case entirely determined by H2 formation and dissociation (Fig. 1).
For the cases with only the stellar radiation field, the difference between the 2 M⊕ models with (Fig. 2e) and without (Fig. 2f) drift velocity is due to the gas temperature. drops below 20 K (Fig. 1) for a large part of the disk without any drift velocity heating, keeping most of the carbon in the ground state. Hence the lines are significantly weaker than with drift velocity heating included.
In the case where (Fig. 2g), the 3P2–3P1 line is stronger than the 3P1–3P0 line contrary to the other 2 M⊕ models (Figs. 2e, f) which include heating and cooling. This is a direct result of the temperature. In the models with heating and cooling, the gas temperature is well below 30 K in the inner 150 AU, while it stays above 50 K if is assumed. The fine-structure level of C lies at 62 K and is only significantly populated at temperatures above 30 K.

If the disk mass is reduced by a factor of 10 (Figs. 2a, b), the carbon density decreases by a slightly larger factor, because the ionization balance shifts towards C+ as shielding decreases in lower mass models. The temperature stays above 40 K in the inner 100 AU of the disk, giving rise to equally strong emission lines. This is not the case if the drift-velocity heating is absent. In that case the temperature drops below 30 K causing the 3P2–3P1 line to become much weaker and the 3P1–3P0 slightly higher.

For C+ and CO we concentrate on four models, the 2 and 0.2 M⊕ model with interstellar UV radiation and , and the 2 M⊕ models with and without interstellar radiation. The combination of these models shows all the possible influences in the models. Comparisons between panels (a) and (c) show the influence of the interstellar UV radiation field, between (a) and (b) of the disk mass, and between (c) and (d) of the drift-velocity heating on the emission lines of C+ and CO.
The influence of the interstellar radiation field on the temperature and chemical abundances can be seen in Fig. 1. The CO abundance is reduced due to enhanced photodissociation, and the C+ line therefore becomes much stronger. Moreover, the lower CO transitions =1–0 and =2–1 are generally weaker than the =3–2 line. This is due to typical gas temperatures in excess of 30 K (the =3 level lies at 33 K) due to the interstellar radiation field. The level populations were calculated using the full statistical equilibrium calculation. This has only a marginal effect on the three lowest levels of CO for the 2.0 M⊕ model. Only in the surface layers of the disk are the densities low enough to prevent collisionally excitation of =3. These slight differences are therefore only marginally visible in the line-profiles and not distinguishable with current telescope facilities.
The influence of the drift-velocity on the line emission is large in the case without interstellar UV radiation. Due to the extremely low gas-temperatures in the inner regions of the disk, where the CO density is highest, the =1 level is excited more efficiently than the higher levels, making the lowest transition the strongest (Fig. 4d).
In the case of the lower mass (0.2 M⊕) disk, the level populations do show clear NLTE effects on the level populations, even close to the midplane. The total emission, however, is extremely small. Whereas the C and C+ line emission scale roughly with mass, the CO line emission is reduced by nearly three orders of magnitude due to enhanced dissociation in the lower mass disk.
4.2 Spectral type A0V
Since we adopted the disks around A0V stars to be seen face on, no coherent velocities are seen in the line of sight and only the micro-turbulent ( km s-1) and thermal velocities remain.

All line profiles show a single gaussian emission peak, and are generally orders of magnitude weaker for C and CO than in the A5V models. Due to the high UV flux from the A0V stars, most of the CO in the gas phase is dissociated. The atomic carbon is subsequently ionized enhancing the C+ abundance and its emission by a few orders of magnitude.
Similar to the A5V stars, we illustrate the differences arising from the various models by using C as an example. The models with drift-velocity heating are generally warmer than those without. This is nicely illustrated in Fig. 5, where the 3P2–3P1/3P1–3P0 line ratio is higher for the models with . The temperature effect is more pronounced in the 0.2 M⊕ model, as the ratio is larger than unity. For the models, the cooling is more efficient in the low-mass disk giving a relatively large 3P1–3P0 line emission compared to the higher transition. In the low mass models, the ionization fraction is much higher due to a general lack of shielding. This leads to C emission that is a factor of 100 lower than in the 2 M⊕ models.

For C+ the differences are entirely due to the excitation. The C+ densities scale with the mass, but the population of the upper level ( K) depends strongly on the gas temperature. For CO, the =3–2 line is the strongest rotational transition in the models with and roughly equal to the 2–1 line in the other two models.

4.3 Integrated intensities
The line profiles presented in the above sections are calculated for a single position using different beam-sizes. Therefore they do not reveal in which part of the disk the emission arises, nor at which position the beam should be centered to pick up the maximum emission from the disk. To illustrate the radial dependence of the emission, the disk is scanned with a small beam over the disk midplane, 2 ″ in the case of the edge-on A5 V star and 5 ″ in the case of the pole-on A0 V star.
Fig. 8 shows that the maximum emission for the A5V star for all three tracers, CO, C and C+ is at 2.5 ″, corresponding to 50 AU at a distance of 19.8 pc. In the inner disk the particle densities are highest whereas outwards the density drops with . Beyond 10 ″, i.e. 200 AU, carbon is mainly in the form of CO ice (see Fig. 1) and hence the emission gradually drops off.

In the case of the A0 V star the stellar UV flux is strong enough to keep C+ as the main emitting carbon-species throughout the disk. The emission is strongest between 5 and 10 ″ (40-80 AU) for C+ and C and between 10-15 ″ (80-120) for CO. Closer to the star the beam is diluted due to the inner hole of 40 AU, hence the rapid decline in emission close to the star.

5 [C ii] observations of Vega and Pictoris
The Infrared Space Observatoty (ISO) data archive was used to retrieve all observations made with the Long Wavelength Spetrometer (LWS) in a radius of 15′ toward Vega and Pictoris. This yielded data from projects by MBARLOW and RSTARK taken in full grating scan mode (AOT L01) and grating range scan mode (LWS AOT L02). The spectral sampling interval of all data from these projects is 1/4 of a resolution element. The number of grating scans (forward and backward) varied between 6 and 24. Each scan yields simultaneous data accross ten detectors. The total integration time varied between 1172 s and 3592 s per AOT. We only considered the data from detector LW04 whose central wavelength is at m (grating in nominal position). The effective beam size of this detector is 78′′ (FWHM), the spectral resolution is about 0.6 m which corresponds to a velocity resolution of about 1150 km s-1 at 157.7 m (ISO Handbook Vol. IV; Version 1.2).
The data were automatically processed through the LWS pipeline (OLP version 10), yielding LWS Auto analysis (LSAN) files which contain the flux and wavelength calibrated spectrum of an AOT. The absolute flux calibration is estimated at about 30% (Swinyard et al. Swinyard (1996)). The wavelength accuracy for the LW detectors is m (ISO Handbook Vol. IV; Version 1.2). Final data reduction was done manually using the ISO spectral Analysis Package (ISAP) Version 2.1. Glitches and their related decays due to Cosmic Rays were removed from each individual grating scan. A medium clip was subsequenly applied to all scans for all data in a bin which is more than 2.5 larger or smaller than the median. Since the observed sources are not bright nor larger than the LWS beam, no defringing was applied. Subsequently an average to the mean of all subscans was done for each bin. A linear baseline was fitted to the averaged spectrum and the line fluxes were estimated through fitting of a gaussian profile with a FWHM comparable to the instrumental resolution.
The resulting spectra are presented in Fig. 10. The spectrum toward Vega does not reveal any spectral line, a 2 upper limit to the [C ii] line intensity was estimated at W cm-2 m-1 in a 0.15 m bin. The line-of-sight toward Pictoris shows a feature with a maximum intensity of W cm-2 m-1 and an integrated intensity of about W cm-2 centred at 157.85 m, which agrees with the wavelength of the [C ii] line within the LWS accuracy. The off-spectrum does not reveal any emission at this frequency with a upper limit of W cm-2 m-1 in a 0.25 m bin which indicates that there is no contamination by an extended interstellar [C ii] emission component. However, a contribution of weak interstellar [C ii] cannot be fully excluded since the integration time used for the OFF position is a factor 2.5 lower than used toward Pictoris.

6 Comparison of models with observations
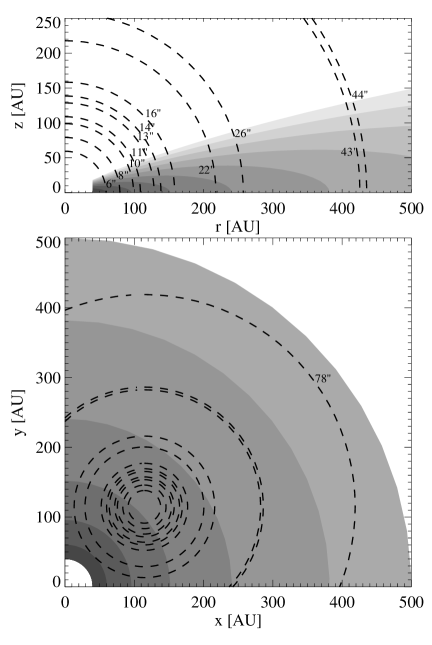
The attempts to detect the gas component in low mass disks around A stars concentrate mostly on prominent A stars like Pictoris and Vega. In order to compare the models to the observations, we have chosen the same beam sizes as used in the different observations. Table 2 shows the beam sizes for each line and telescope, while Fig. 11 illustrates the areas of the disk contained in the different beams for Pictoris (edge-on at a distance of 19.8 pc) and Vega (pole-on at a distance of 7.8 pc). For Vega a radial offset of 14.7 ″ (114 AU) is applied because the smallest beams contain only the star and the inner hole of the disk model. Observations by Holland et al. (Holland:1998 (1998)) and subsequent modeling by Dent et al. (Dent:00 (2000)) substantiate the presence of these holes.
6.1 -Pictoris
For Pictoris, the CO =1–0 and 2–1 lines have been searched several times with the SEST (Savoldini & Galletta Savoldini (1994); Liseau & Artymowicz Liseau1 (1998)) and the JCMT (Dent et al. Dent (1995)). In all cases only an upper limit on the CO column density was derived, the most strict being cm-2 so far. This is deduced from the CO 2–1 upper limit found by Liseau & Artymowicz (Liseau1 (1998)), where they obtain a noise level of mK using a binning of 0.9 km s-1. With a binning of 5 km s-1, which corresponds to the halfwidth of the CO line, the noise level goes down to 4 mK. To compare these limits to the models, Trms has to be converted using the main beam efficiency of the SEST at the corresponding wavelength. The models presented show that the =2–1 transition in the Pictoris model with 2 M⊕ and the interstellar radiation field reaches a flux of 12.2 mK with a binning of 5 km s-1, while the =1–0 line reaches only 0.9 mK (Fig. 12a). At the typical disk temperatures of 50 K in the models, mostly the =2 and =3 levels are populated. The predicted =2–1 line would not have been detected by the latest SEST observations, which have mK.
The models show that in fact the most favorable line to observe is the =3–2 line. A spectrum for this line, taken from the JCMT public archive, has a noise level of mK after smoothing to 1.1 km s-1 velocity bins. A much deeper integration should be possible with the dual polarization B3 receiver. The current limit is a factor of two lower than the modeled line (Fig. 12a, dot-dashed line).

The 2 M⊕ disk models have significantly lower mass than the value of inferred from the dust using a gas/dust ratio of 100:1. Scaling the mass up by that factor (), both the =2–1 and =3–2 line should have been easily detected even though the CO gas abundance is unlikely to scale linearly due to enhanced freeze-out.
Comparison between Figs. 12c and d reveals that without drift velocity heating the disk becomes much cooler and the lines weaker. Even the line ratios are affected, in the sense that the =2–1 and =3–2 lines are now equally strong. Moreover, the 0.2 M⊕ model gives CO lines below 0.1 mK, indicating that the threshold for CO detection occurs between 0.2 and 4 M⊕ (see Fig 12b, assuming that CO scales linearly in a narrow range of disk mass) for the distance and inclination of -Pictoris. Roughly a factor of 10 in flux is generally gained compared to the averaged intensity from the entire disk (Fig. 4). A comparison of Fig. 4d and Fig. 12d reveals that the smaller beams pick up mostly the warm CO in the inner disk regions. In addition the difference in beam dilution is largest for the =2–1 and =3–2 lines compared to the entire disk beam.
On the other hand, there are UV absorption-line studies along the line of sight towards Pictoris. Roberge et al. (Roberge (2000)) observed C i and CO using the HST STIS high-resolution echelle spectrograph. Contrary to previously detected C i absorption (Jolly et al. Jolly (1998)), an unsaturated spin-forbidden transition was observed. This allowed for an improved determination of the ground state C(3P) column of (2–4) cm-2. The CO absorption results indicate a column of cm-2.
In the 2 M⊕ disk models, the CO column density is cm-2, roughly 10 times higher than the observed value. The C i column density from the model, cm-2, is also a factor 2.5–5 higher than observed in the absorption studies. In case of the 0.2 M⊕ disk models a CO and C i column density of and cm-2 is reached respectively. Both are lower than the observed values, leading to the conclusion that the actual mass lies in between these models.
The detected [C II] line provides a reliable estimate of the amount of ionized gas in the disk around -Pictoris. The emission line was modeled adopting the ISO beam of 78 ″. The integrated emission for the 2 and 0.2 M⊕ disk models is and W cm-2 respectively. Both are lower than the observed value of W cm-2. At first sight, this would indicate that according to the model more gas is present in the disk around -Pictoris. However, this conclusion depends heavily on the assumed UV radiation and further modeling is needed.
Freudling et al. (Freudling (1995)) derived from the non-detection of the H i 21 cm line an upper limit of cm-2 for the neutral hydrogen column density. The column calculated for the 2 M⊕ disk model including the interstellar field is cm-2 and for the 0.2 M⊕ disk model cm-2, a few times higher than observed.
The H i column density in the 2M⊕ model is close to cm-2 deduced by Olofsson et al. (Olofsson (2001)) from their sodium observations using a solar Na/H abundance ratio. In the models described here, the available H i in the gas is directly related to the amount of H2 self-shielding of the stellar radiation. The interstellar radiation field penetrating through the disk is not shielded by H2, hence comparable columns of H2 and H i are reached (see paper I). A disk with a 25 times higher mass would be able to shield the midplane of the disk and the H i column will decrease. This process would hardly affect the carbon species in the outer regions, because CO will freeze out, incorporating all the available carbon. In the inner regions, the C i and CO densities would increase in a higher mass disk and the column densities would be too high compared with observations.

Our models show that a -Pictoris disk with 2 M⊕ of gas might have escaped detection in CO. The absorption studies towards Pictoris show that the models give CO and C i column densities that are up to a factor of 10 too high. In case of the 0.2 M⊕ models all of these upper limits are met as C+ and COice become the main reservoirs of carbon. In the case of the H i absorption even the low mass 0.2 M⊕ disk overestimates the observed upper limit. Since the estimate by Olofsson et al. (2001) differs by a factor of 10 and the true H2 formation rate used is not known, not too much weight should be given to the H i constraint.
6.2 Vega
For Vega, there are in general less observations than for Pictoris. Due to the pole-on geometry, absorption line studies for Vega are impossible. Yamashita et al. (Yamashita (1993)) searched for the CO =1–0 line with the 45 m Nobayama Radio Observatory (NRO). They detected no CO emission down to a of 33 mK in 1 km s-1 bins. Even with the better sensitivity of mK of the JCMT, Dent et al. (Dent (1995)) did not detect any CO =2–1 around Vega. The above calculations show that a 2 M⊕ model for Vega reaches at most 1 mK for the =3–2 transition (Fig. 13c). The lowest =1–0 transition has fluxes below 0.1 mK. This is entirely due to photodissociation. Simple scaling suggests that the lines will still not be detectable with current instruments if the disk mass is enlarged by a factor of 20.
The difference seen in comparing the models with and without drift-velocity heating (Fig. 13a-d) is entirely due to differences in gas temperature. Drift-velocity heating is the most important heating source of the gas and, if omitted, H2 formation/dissociation as well as photoelectric heating of the m-size dust particles remain, leading to lower gas temperatures. The CO fluxes are a factor of 10 higher than with the beam of 128.9 ″ corresponding to the entire disk (compare Fig. 7 and 13). This is due to the low CO densities in the outer regions picked up in the large beam. The sometimes different line ratios can be explained by the restricted area picked up by the smaller telescope beams.
The models for the Vega disk predict [C ii] integrated emission lines of 1.9 and 7.9 W cm-2 for the 2 and 0.2 M⊕ disks. The former integrated intensity corresponds to a peak intensity of W cmm-1 and the latter to W cmm-1. The ISO satellite observed Vega in the wavelength range of the [C ii] 157.74 m line (Sect. 5) and obtained an upper limit of W cmm-1. This would suggest a maximum amount of gas of in the disk around Vega.
7 Future observations
We present here [C i] predictions from our models appropriate for the new MPIfR/SRON 800 GHz and 460 GHz single channel receivers to be installed at the Atacama Pathfinder Experiment (APEX) in 2003. APEX is located at 5000 m at Chajnantor in Chili and is perfectly placed to observe -Pictoris. For Vega, the [C i] emission line is calculated using the JCMT telescope instead of APEX. Additionally [C i] and [C ii] lines for the future instrumentation on board of SOFIA and Herschel are calculated. The velocity resolution of all the telescopes is set at 1 km s-1 to detect the line profiles except for the [C i] 809.3 GHz (370 m) line, where 5 km s-1 is used.

Since detailed sensitivity estimates are not yet available for APEX, the limits in the appropriate bands are calculated for the JCMT. In general, APEX, due to its excellent site and stable atmosphere has better sensitivities.
The [C i] 370.42 m intensity of the 2 M⊕ disk model with interstellar UV field for Pictoris yields a flux of 300 mK, whereas the 2 M⊕ Vega model yields only 15 mK. Since the source is at a low zenith angle, the current 370 m receiver at the JCMT would require 200 minutes of observing time for a 5 km s-1 velocity resolution to reach a 3 detection for a 300 mK peak intensity of the line. This is clearly not feasible. The expected upgraded receiver at APEX would reach this limit in about 20 minutes for -Pictoris. A higher spectral resolution of 1 km s-1 would increase the time to about 8 hours.
The lowest [C i] line at 492.2 GHz (609.13 m) is calculated using the JCMT specifications. A typical noise level of =40 mK in 1 km s-1 bin could be reached in 1.1 hours of integration time at an elevation of 60°, appropriate for the -Pictoris disk from the APEX site. The predicted mK line should be detectable with this configuration. For a star like Vega with a strong UV radiation field, this line is not observable in low mass ( M⊕) disks.
For the HIFI instrument on board of the Herschel satellite, the [C i] line at 609.13 m is at the lower limit of Band 1, while the 370.42 m line falls in Band 3. The sensitivity estimates for a long integration (5 hours) are 2 and 3 mK respectively (de Graauw & Helmich Graauw (2001)). Since the Herschel beam is much larger than the JCMT beam, nearby edge-on disks will suffer from large beam dilution. Still, both the edge-on -Pictoris disk and the pole-on disk around Vega should be just observable in both lines.

The [C ii] fine structure line at 157.74 m can be observed in Band 6 of the HIFI instrument on board of Herschel. In a long exposure (5 hours), a sensitivity of 6 mK is reached (de Graauw & Helmich Graauw (2001)). A 2 M⊕ model will be observable in both Vega and -Pictoris.
If the slightly larger beam of SOFIA is used, 16 ″ compared to the 11 ″ of Herschel, the model fluxes for the [C ii] line decrease by about a factor 2 for an edge-on disk model due to additional beam dilution. Since we applied an offset of 15 ″ to the pole-on disk model, there is hardly any difference between the two beam sizes for this model. In both cases, the beam is entirely filled by the disk model. Apart from the difference in beam size, HIFI and the GREAT instrument on SOFIA will have comparable sensitivity limits and integration times.
The Atacama Large Millimeter Array (ALMA) will reach a sensitivity and angular resolution which will be orders of magnitude larger than the current status. In the case of Vega and Pictoris, angular resolution is of minor importance due to the relatively small stellar distances. Adopting the expected sensitivities, an hour of integration on the CO 3–2 line with a spectral resolution of 0.5 km s-1 would give a 5 detection of 0.05 K. This result is obtained for the compact configuration with baselines up to 150 m, which gives a spatial resolution of 2 ″. Figure 8 shows that the integrated line intensity of the CO 3–2 line peaks at a 2 ″ offset for -Pictoris. Using a spectral resolution of 0.5 km s-1 the local emission at 2 ″ offset reaches 2.1 K. At the wavelength of the [C i] transition the 5 level reached with ALMA is expected to be twice as high (0.1 K). The modeled intensity for this line peaks at 1.2 K. In both cases the CO and [C i] line should be detectable in a few seconds and half a minute respectively. For Vega the detection limits are more stringent and peak intensities (with a 2 ″ beam) will be 0.05 for the [C i] line and K for the CO line. [C i] will thus be detectable in 4 hours integration time and CO is undetectable (7000 hrs) for this binsize at a 5 level.
8 Discussion and conclusion
The optically thin models described in this paper provide a tool to constrain the gas mass in circumstellar disks on the basis of observed emission lines and derived column densities. Due to the complex interplay between chemistry, temperature, shielding, and radiative transfer in the emitting lines, it cannot be exluded that more massive optically thick disk models yield similar column densities and line emission, but this is left for future modeling.
Assuming that CO emission scales linearly over a small range of disk mass, the comparison with observations of CO and [C I] made for Pictoris constrains the gas mass between 0.2 and 4 M⊕. The question remains: do the results indeed lead to the conclusion that the Pictoris disk is depleted in gas, or is there still some physical input missing in the models?
Evidence that our models are still not complete comes from the recent observations of Lecavelier des Etangs et al. (Lecavelier (2001)) and Deleuil et al. (Deleuil (2001)), who have shown that Pictoris might be an active star. The detection of the O vi emission doublet at 1035 Å and of C ii and C iii lines with the FUSE satellite, lead to the conclusion that Pictoris may have a chromosphere. Even though the observed O vi lines do not overlap with any of the CO photodissociation lines, the continuum of the chromosphere increases the stellar UV flux and hence the amount of CO photodissociation. H2 will be less affected due to its more efficient self-shielding. The existence of a chromosphere in Pictoris would increase the photodissociation rate for CO as well as the ionization rate for carbon, hence leading to lower CO and C i column densities.
FUSE is not sensitive enough to detect the continuum flux shortward of 1100 Å in Pictoris. This makes it difficult to estimate the strength of the additional chromospheric UV radiation field. Nevertheless, the upper limit for a continuum given by the FUSE spectra (at 1000 Å erg cm-2 s-1 Hz-1), could still hide a chromosphere of about 10 times higher than the photospheric flux included so far in the models. Section 4 shows that the inclusion of an interstellar UV radiation field decreases the CO emission already by a factor of 20 (compare Fig. 12a and c). Hence the presence of a chromosphere in the star Pictoris, which can be according to the FUSE data up to a factor 10 in units of the interstellar radiation field, may allow larger disk masses to be consistent with the current CO =2–1 and 3–2 observational limits. Moreover it can enlarge the [C ii] 157.74 m line significantly and thus bring it closer to the observed integrated intensity.
Heap et al. (Heap:00 (2000)) report the detection of an inner warp in the disk around Pictoris. From STIS coronographic observations, they deduce a two component disk model: a main outer disk and a fainter inner disk, which is inclined by 4-5° with respect to the main disk and extends to about 80 AU. Hence, the inclined inner disk will receive more stellar UV radiation, leading to less CO, C i and more C ii. In the case of an inner warp, the UV absorption-line studies would miss some of the inner disk material and underestimate the total disk mass. Both effects allow larger disk masses to be consistent with the present observations.
So we are left with the final question: do the dusty disks seen around A stars (“Vega-type” stars) still contain gas? The previously drawn conclusion that these disks are debris disks which contain less gas than dust, is mainly based on CO conversion factors appropriate for molecular clouds. But the low mass disks around A-type stars resemble more a photodissociation region than a molecular cloud. From the models presented here and the discussion of the various observations for Pictoris, it is difficult to keep the gas-to-dust ratio as high as 100. On the basis of the present models, we argue for a gas-to-dust ratio between 0.5 and 9 for Pictoris, assuming a dust mass of 0.44 M⊕ (Chini et al. Chini:91 (1991)). This ratio depends of course on the dust mass and on the basis of different modeling approaches Dent et al. (Dent:00 (2000)) found a dust mass of 0.04 M⊕, while Li & Greenberg (Li:98 (1998)) obtained 0.33 M⊕. Any chromosphere included in the models will — depending on its strength — raise the gas-to-dust value. Moreover, the 2 M⊕ model with the interstellar radiation field suggests that the inclusion of a chromospheric UV radiation field can solve the remaining problem with CO, C i, and C ii simultaneously. This shows the power of using observations of several species to constrain the gas mass instead of using only one, namely CO.
For Vega, the non-detection of CO gave an upper limit for the gas mass of M⊕ using a CO abundance of (Yamashita et al. Yamashita (1993)). Our models show, that CO is entirely photodissociated in Vega and hence this upper limit has to be regarded with caution. Following the models presented in this paper, most of the carbon is in form of C+. Hence, we use [C ii] observations to constrain the gas mass in the disk around Vega and obtain an upper limit of 0.2 M⊕. This gives and upper limit of 33 for the gas-to-dust ratio, assuming a dust mass of M⊕ (Chini et al. Chini:90 (1990)) and 80 assuming a dust mass of M⊕ (Dent et al. Dent:00 (2000)).
In order to improve our understanding of these disks and to constrain the gas mass, more suitable gas tracers than CO are needed. While absorption studies only probe the disk material in the line of sight, emission line studies contain information on the disk structure as a whole and are therefore better suited to constrain the disk models. The calculations presented in this paper for a 2 M⊕ disk with a gas-to-dust mass ratio of 100 show that the best tracers among those considered here (CO, C, and C+) are C+ and C. This result does not depend on the geometry of a nearby disk, because the beams of APEX, SOFIA and Herschel are small. Moreover the conclusion holds for disks around A stars with a moderate radiation field like Pictoris as well as for disks that are exposed to a larger UV flux like around Vega.
Acknowledgements.
The authors are grateful to M. Hogerheijde and F. van der Tak for use of their 2D Monte Carlo code. The JCMT data have been obtained from the Canadian Astronomy Data Center, which is operated by the Dominion Astrophysical Observatory for the National Research Council of Canada’s Herzberg Institute of Astrophysics. I. Kamp acknowledges support by a Marie Curie Fellowship of the European Community programme “Improving Human Potential” under contract number MCFI-1999-00734. Astrochemistry in Leiden is supported by a SPINOZA grant from the Netherlands Organization for Scientific Research (NWO).References
- (1) Augereau, J. C., Lagrange, A. M., Mouillet, D., & Ménard, F. 2001, A&A, 365, 78
- (2) Barrado y Navascués, D., Stauffer, J. R., Song, I., & Caillault, J.-P. 1999, ApJ, 520, L123
- (3) Cheng, K.-P., Bruhweiler, F. C., Kondo, Y., & Grady, C. A. 1992, ApJ, 396, L83
- (4) Chini, R., Kruegel, E. & Kreysa, E. 1990, A&A, 227, L5
- (5) Chini, R., Kruegel, E., Kreysa, E., Shustov, B., & Tutukov, A. 1991, A&A, 252, 220
- (6) Chu, S.-I., & Dalgarno, A. 1975, Royal Society (London), Proceedings, Series A, vol.342, no.1629, 191
- (7) de Graauw, Th., & Helmich, F. P. 2001, in ESA SP-460, eds. G. L. Pilbratt, J. Cernicharo, A. M. Heras, T. Prusti, R. Harris, 45
- (8) Deleuil, M., Bouret, J.-C., Lecavelier des Etangs, A., et al. 2001, ApJ, 557, L67
- (9) Dent, W. R. F., Greaves, J. S., Mannings, V., Coulson, I. M., & Walther, D. M., 1995, MNRAS, 277, L25
- (10) Dent, W. R. F., Walker, H. J., Holland, W. S., Greaves, J. S. 2000, MNRAS, 314, 702
- (11) Dutrey, A., Guilloteau, S., Duvert, G., et al. 1996, A&A, 309, 493
- (12) Flower, D. R., & Launay, J. M. 1977, J. Phys. B, 10, 3673
- (13) Freudling, W., Lagrange, A.-M., Vidal-Madjar, A., Ferlet, R., & Forveille, T. 1995, A&A, 301, 231
- (14) Habing, H. 1968, Bull. Astr. Inst. Netherlands, 19, 421
- (15) Habing, H. J., Dominik, C., Jourdain de Muizon, M., et al. 2001, A&A, 365, 545
- (16) Hayashi, C., Nakazawa, K., & Nakagawa, Y. 1985, in Protostars & Planets II, eds. D. C. Black, M. S. Mathews, 1100
- (17) Heap, S. R., Lindler, D. J., Lanz, T. M., et al. 2000, ApJ, 539, 435
- (18) Hogerheijde, M. R., & van der Tak, F. 2000, A&A, 362, 697
- (19) Holland, W. S., Greaves, J. S., Zuckerman, B., et al. 1998, Nature, 392, 788
- (20) Jolly, A., Mc Phate, J. B., Lecavelier, A., et al. 1998, A&A, 329, 1028
- (21) Kamp, I., & Bertoldi, F. 2000, A&A, 353, 276 (Paper i)
- (22) Kamp, I., & van Zadelhoff, G.-J. 2001, A&A, 373, 641 (Paper ii)
- (23) Keenan, F. P., Lennon, D. J., Johnson, C. T., & Kingston, A. E. 1986, MNRAS, 220, 571
- (24) Kurucz, R. L. 1992, Rev. Mex. Astron. Astrofis., 23, 181
- (25) Launay, J. M., & Roueff, E. 1977, A&A, 56, 289
- (26) Lecavelier des Etangs, A., Vidal-Madjar, A., Roberge, A. et al. 2001, Nature, 412, 706
- (27) Li, A., Greenberg, J. M. 1998, A&A, 331, 291
- (28) Liseau, R., & Artymowicz, P. 1998, A&A, 334, 935
- (29) Liseau, R. 1999, A&A, 348, 133
- (30) Mendoza, C. 1983, in IAU Symposium 103, Planetary nebulae, ed. D. R. Flower, 143
- (31) Olofsson, G., Liseau, R., & Brandeker, A. 2001, ApJL, 563, L77
- (32) Roberge, A., Feldman, P. D., Lagrange, A. M., et al. 2000, ApJ, 538, 904
- (33) Savoldini, M., & Galletta, G. 1994, A&A, 285, 467
- (34) Schinke, R., Engel, V., Buck, U., Meyer, H., & Diercksen, G. H. F. 1985, ApJ, 299, 939
- (35) Schröder, K., Staemmler, V., Smith, M. D., Flower, D. R., & Jacquet, R. 1991, J. Phys. B, 24, 2487
- (36) Stauffer, J. R., Hartmann, L. W., & Barrado y Navascués, D. 1995, ApJ, 454, 910
- (37) Swinyard, B. M., Clegg, P. E., Ade, P. A. R., et al. 1996, A&A, 315, L43
- (38) Thi, W. F., Blake, G. A., van Dishoeck, E. F., et al. 2001, Nature, 409, 60
- (39) Thi, W. F., van Dishoeck, E. F., Blake, G. A., et al. 2001b, ApJ, 561, 1074
- (40) Yamashita, T., Handa, T., Omodaka, T., et al. 1993, ApJ, 402, L65
- (41) Zuckerman, B., Forveille, T., & Kastner, J. H. 1995, Nature, 373, 494