X-Ray Emission from Multi-Phase Shock in the Large Magellanic Cloud Supernova Remnant N49
Abstract
The supernova remnant (SNR) N49 in the Large Magellanic Cloud has been observed with the Advanced CCD Imaging Spectrometer (ACIS) on board the Chandra X-Ray Observatory. The superb angular resolution of the Chandra/ACIS images resolves a point source, the likely X-ray counterpart of soft gamma-ray repeater SGR 052666, and the diffuse filaments and knots across the SNR. These filamentary features represent the blast wave sweeping through the ambient interstellar medium and nearby dense molecular clouds. We detect metal-rich ejecta beyond the main blast wave shock boundary in the southwest of the SNR, which appear to be explosion fragments or “bullets” ejected from the progenitor star. The detection of strong H-like Si line emission in the eastern side of the SNR requires multi-phase shocks in order to describe the observed X-ray spectrum, whereas such a multi-phase plasma is not evident in the western side. This complex spectral structure of N49 suggests that the postshock regions toward the east of the SNR might have been reheated by the reverse shock off the dense molecular clouds while the blast wave shock front has decelerated as it propagates into the dense clouds. The X-ray spectrum of the detected point-like source is continuum dominated and can be described with a power law of 3. This provides a confirmation that this point-like X-ray source is the counterpart of SGR 052666 in the quiescent state.
1 INTRODUCTION
N49 is a bright supernova remnant (SNR) in the Large Magellanic Cloud (LMC) (Dopita, 1979; Long et al., 1981). The low metal abundances of N49 (Danziger & Leibowitz, 1985; Russell & Dopita, 1990) indicated a substantial mixture of the supernova (SN) ejecta material with the LMC interstellar medium (ISM), which is consistent with the relatively old dynamical age as derived to be 5000 10000 yr (Long et al., 1981; Vancura et al., 1992). The most remarkable feature of N49 is strong enhancements of the optical/X-ray surface brightness in the south-east. This asymmetric intensity distribution has been attributed to the interaction of the blast wave with the nearby molecular clouds located in the east of the SNR (Vancura et al., 1992; Banas et al., 1997). The radio images show similar intensity distribution to the X-ray morphology, but with a complete shell in the west as well as in the east (Dickel et al., 1995). The radio spectral index of = 0.58 (Dickel & Milne, 1998) is typical for a shell-type SNR. Although the mean fractional polarization over the whole remnant is low (5%), the western side of the SNR is highly polarized. The highly organized magnetic field in the west of the SNR is supportive of the less-disturbed blast wave expanding into the low density ISM in the west (Dickel & Milne, 1998).
Vancura et al. (1992) have performed extensive optical/UV spectroscopy and have found that N49 is interacting with dense clouds ( 150 cm-3 on average) while the preshock intercloud density is 0.9 cm-3. This dense ISM is most likely associated with the CO clouds detected in the east of the SNR (Banas et al., 1997). The bright optical/UV emission arises from “sheets” of emission generated by slow radiative shocks of 140 km s-1 as the blast wave interacts with the dense ambient material, while the X-ray emission appears from the fast shock ( 730 km s-1) propagating in the intercloud medium.
The X-ray spectrum of N49 as obtained with ASCA was fitted with a non-equilibrium ionization (NEI) model with 0.6 keV and 1011 cm-3 s (Hughes et al., 1998). The fitted electron temperature and the ionization age are consistent with the Sedov evolution without significant alteration of the preshock ISM by the stellar winds from the progenitor (the model suggested by Shull et al. [1985]), which supports the overall picture proposed by Vancura et al. (1992). The overall X-ray spectrum was fitted with low metal abundances, which is also consistent with the optical/UV spectral analysis.
The position of the outburst of the soft gamma-ray repeater (SGR) SGR 052666 in 1979 March 5 has been known to be within the boundary of N49 (Cline et al., 1982) and is consistent with the unresolved X-ray source RX J05260.3660433 (Rothschild et al., 1994), suggesting the identification of this source as the X-ray counterpart of SGR 052666. This unresolved X-ray source appears spatially associated with SNR N49 based on its positional coincidence within the boundary of the SNR although an incidental alignment along the line of sight between the two cannot be ruled out (Gaensler et al., 2001). Although an 8 s pulsation from SGR 052666 has been detected during the -ray burst in 1979 (Mazets et al., 1979), the X-ray timing/spectral analysis of this unresolved X-ray source has been limited with previous detectors (e.g., Marsden et al. 1996). No counterparts in the infrared and radio bands have been found for SGR 052666 (Dickel et al., 1995; Smith et al., 1998; Fender et al., 1998). These results from SGR 052666 share typical characteristics of the Anomalous X-ray Pulsars (AXP), provided that the detection of the X-ray pulsar is confirmed. High resolution X-ray imaging with the moderate spectral capability of Chandra observations would be critical to confirm the detection of the X-ray counterpart of SGR 052666.
We here report the results from the imaging and spatially resolved spectral analysis of SNR N49 from the Chandra observations. While this work is primarily devoted to the analysis of the diffuse X-ray emission from SNR N49, we also report some preliminary results from the detected point source, the X-ray counterpart of SGR 052666. We describe the observation and the data reduction in §2. The image and spectral analyses are presented in §3, and a discussion in §4. A summary will be presented in §5.
2 OBSERVATIONS & DATA REDUCTION
SNR N49 was observed with the Advanced CCD Imaging Spectrometer (ACIS) on board the Chandra X-Ray Observatory on 2001 September 15 as part of the Chandra Guaranteed Time Observation (GTO) program (ObsID 1041). The ACIS-S3 chip was chosen to utilize the best sensitivity and energy resolution of the detector in the soft X-ray bands. The pointing (2000 = 05h 25m 26s.04, 2000 = 65∘ 59′ 069) was roughly toward the X-ray centroid of the nearby LMC SNR N49B with the aim point shifted by 245 detector pixels (2′) from the nominal S3 chip aim point in order to simultaneously observe both of N49 and N49B on the same CCD chip. This pointing direction results in an angular offset of 65 from the aim point at the position of N49. The results from the data analysis of the pointed target SNR N49B are presented elsewhere (Park et al. 2002b, ).
We have utilized the data reduction techniques developed at the Pennsylvania State University for correcting the spatial and spectral degradation of the ACIS data caused by radiation damage, known as charge transfer inefficiency (CTI) (Townsley et al., 2000). The expected effects of the CTI correction include an increase in the number of detected events and improved event energies and energy resolution (Townsley et al., 2000; Townsley et al. 2002a, ). We screened the data with the flight timeline filter and then applied the CTI correction before further data screenings by status and grade. We removed “flaring” pixels and selected ASCA grades (02346). The overall lightcurve was examined for possible contamination from time-variable background. The overall lightcurve from the whole S3 chip shows relatively high background (by a factor of 2) for the last 10% of the observation time. This contamination from the variable background is however negligible for the N49 source region (14 diameter) and we ignore it in the data analysis. After these data reduction process, the effective exposure was 34 ks that contains 241 k photons in the 0.3 8 keV band for the whole remnant within a 14 diameter circular region.
During Chandra cycle 1 (2000 January 4), N49 was observed with the ACIS-S3 as a Guest Observer (GO) program, which is now publicly available in the archive (ObsID 747). The pointing was toward the position of SGR 052666 (2000 = 05h 26m 00s.7, 2000 = 66∘ 04′ 350). In this observation, instead of the whole CCD and the standard 3.2 s frame time, a 128-row subarray with a 0.4 s frame time was used for the temporal study of the target object SGR 052666. Due to the selection of the subarray of the CCD chip, the coverage of the SNR was incomplete and only the northern parts of the SNR were observed. The total exposure was 40 ks. Although the angular coverage is incomplete, this on-axis observation provides better angular resolutions than our GTO data, thus we utilize these archival data as supplements in the analysis. We have reprocessed the raw archival data in exactly the same way as the GTO data were processed, including the CTI correction.
3 ANALYSIS & RESULTS
3.1 X-ray Color Images
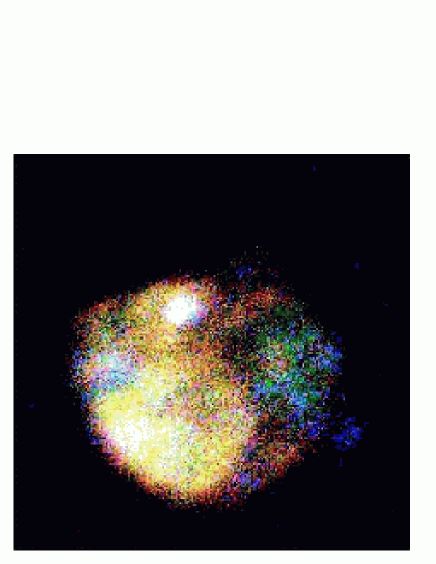
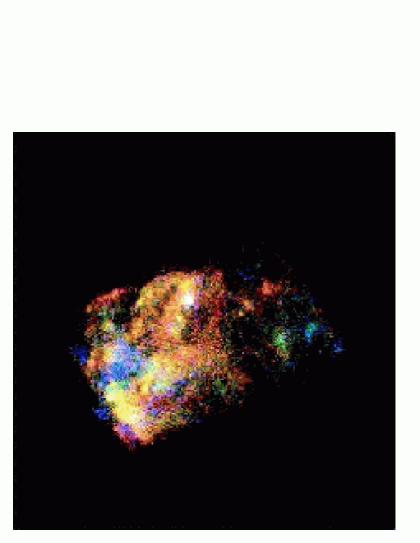
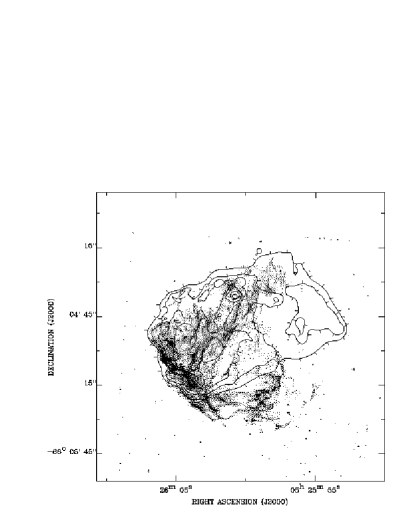
The “true-color” X-ray images of SNR N49 from the Chandra/ACIS observations are presented in Figure 1. Figure 1a is the image from the GTO observation and Figure 1b is the one from the archival GO data. The differences in the point spread function (PSF) between two images due to the angular offset of 65 from the aim point in the GTO data are apparent. The high resolution on-axis archival data reveal the detailed diffuse filamentary structure, particularly in the east of the SNR, far better than the off-axis GTO data. The detection of the point source as the counterpart of SGR 052666 is evident in the middle of the northern part of the SNR as shown by a bright white spot (Figure 1b). This point source is also detected in the off-axis image (Figure 1a) but appears extended because of the PSF degradation. Despite the superior angular resolution of the on-axis data, the selection of the subarray of the CCD allows only a partial coverage of the SNR: i.e., about a third of the SNR in the south-west was not covered (Figure 1b). The imaging and spectral analysis over the whole remnant is important to understand the global nature of the SNR and we primarily utilize our GTO data for the data analysis. In order to take advantage of the high angular resolution, we use the archival data for supplementary purposes.
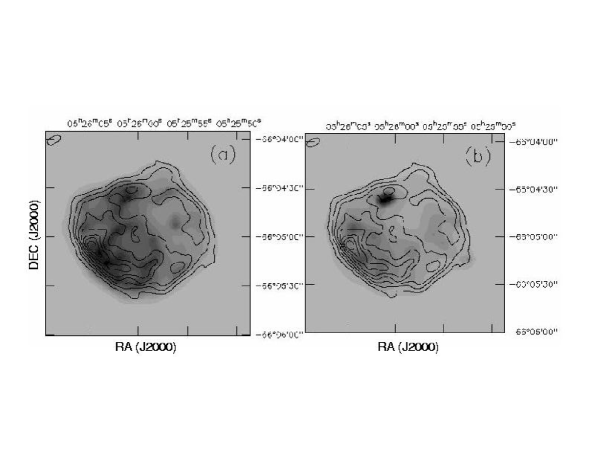
In Figure 1, the soft X-ray emission (red-yellow) reveals various filamentary structures across the SNR. The circumferential shell-like soft X-ray features around the SNR are spatially coincident with the radio shells (Figure 2a), representing the blast wave shock front. By comparison, the hard X-ray emission features show little correlation with the radio intensities (Figure 2b). Based on astrophysical considerations, we believe that it is reasonable to suppose that shocks are reflecting off the denser molecular gas in the east and may be propagating back into the interior of N49. This could be a partial explanation for the higher temperatures we find in the spectral analysis of the eastern region (§3.3.2), although a definitive conclusion would require a detailed investigation of the hydrodynamics of N49 that is beyond the scope of this work. Other evidence, albeit more speculative, in support of reflected shocks in the eastern region of N49 include (1) the morphology of the hard X-rays which peak closer to the interior on the eastern side than the soft X-rays do (Figure 2), and (2) the clear arc-like feature in the Si EW map (§3.2 and Figure 5f) which traces hot gas, that perhaps delineates the edge of the inward moving reflected shock. The western half is, for the most parts, dominated by hard X-ray emission (green-blue), which may indicate that the blast wave is propagating through a low density ISM, as suggested by radio data (Dickel & Milne, 1998).
The brightest diffuse emission is in the southeast, as recognized by previous X-ray observations, where the SNR is interacting with dense molecular clouds. The overall bright X-ray emission in the eastern half of the SNR is significant in all colors and likely has complex spectral structure. While filamentary soft, red-yellow emission prevails in the eastern half of the SNR, there are apparent blue regions in the east (primarily to the immediate north of the southeast brightest region; Figure 1). This diffuse X-ray emission with spectral variations appears localized to produce spatially distinctive layers of X-ray colors in the eastern half of the SNR. The interactions of the blast wave shock with the clumpy dense molecular clouds in these regions appear responsible for the observed spatio-spectral substructures of the diffuse X-ray emission (see §3.3). For example, the bright filametary emission features from the optical OIII images are largely anti-correlated with the blue, hard X-ray intensity and more correlated with the soft, red X-ray emission (Figure 3a and Figure 3b). The optical emission from N49 is believed to originate primarily from slow radiative shocks entering dense molecular clouds, while the X-ray emission is in general from fast shocks propagating through the intercloud medium (Vancura et al., 1992). The high resolution X-ray images from the ACIS data reveal that the hard X-rays are indeed from intercloud regions where little optical emission originates, and that the soft X-ray emission is spatially more coincident with the bright optical emitting regions. These features support the interactions of the blast wave with the clouds as the origin of the X-ray spectral variations observed in the color images.
We detect an interesting, previously unknown feature of N49 with our Chandra GTO data: i.e., the blue, hard X-ray knot in the southwest, beyond the main boundary of the SNR (Figure 1a), from which faint radio emission is also associated (Figure 2b). The extended shape of this feature appears caused by the off-axis PSF and the true morphological nature of this emission is uncertain with the current off-axis data. We cannot utilize the high resolution archival data, because this feature lies outside the field of view (Figure 1b). We find no proper counterparts for this feature in other wavelengths, which suggests that it is unlikely a projection of a background/foreground point source (§3.3.3). The X-ray spectrum of this feature indicates metal-rich thermal emission with strong atomic emission lines rather than a power law dominated spectrum (§3.3.3). These spectral features support the proposition that this hard X-ray knot is a part of the SNR, probably fragment(s) of SN ejecta.
3.2 Equivalent Width Images
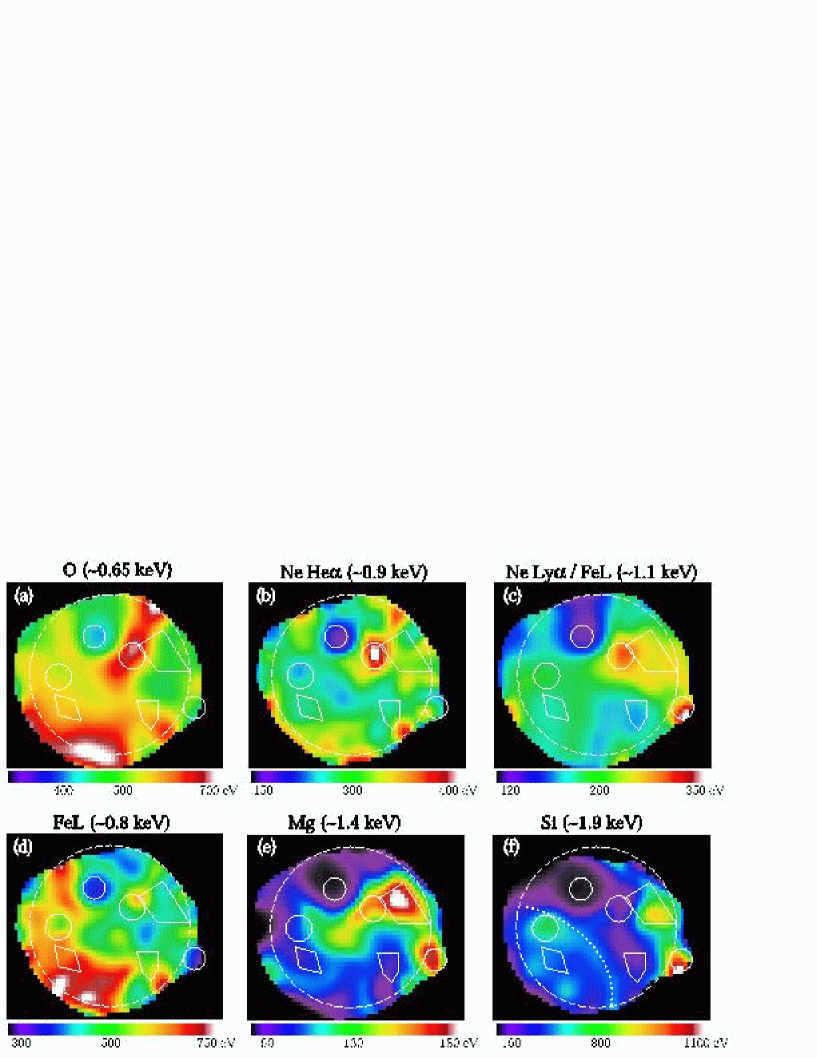
The overall spectrum of N49 shows some broad atomic emission lines (Figure 4) and we generate equivalent width (EW) images of K-shell line emission from the atomic elements O, Ne, Mg, Si, S, and the L-shell line emission of Fe by selecting photons around the broad line complexes (Table 1), following the methods described by Park et al. (2002a). Images in the bandpasses of interest for both the lines and continuum were extracted with 2 pixels and smoothed by a Gaussian with = 7. The underlying continuum was calculated by logarithmically interpolating between images made from the higher and lower energy “shoulders” of each broad line. The estimated continuum flux was integrated over the selected line width and subtracted from the line emission. The continuum-subtracted line intensity was then divided by the estimated continuum on a pixel-by-pixel basis to generate the EW images for each element. In order to avoid noise in the EW maps caused by poor photon statistics near the edge of the SNR, we have set the EW values to zero where the estimated continuum flux is low. We also set the EW to zero where the integrated continuum flux is greater than the line flux. We present the EW images for O, Ne, Mg, Si, and Fe (Figure 5). The S EW image is unreliable due to the low photon statistics. The broad line complexes at 0.8 1.1 keV are from various ionization states of Ne K and Fe L-shell line emission, and we present tentative identifications in Figure 5 and Table 1. Although Mg and Si lines show He-like and H-like substructures in the overall spectrum (Figure 4), we present the EW images from the combined broad lines in Figure 5 since the H-like lines of these elements are too weak to separately produce useful EW images over the whole SNR.
The O EW distribution is generally consistent with the optical OI,III intensity distributions and shows higher EW in the east and south of the SNR (Figure 5a; Vancura et al. 1992). The Fe EW (Figure 5d) shows similar distribution to the O map. Ne/Fe and Mg EW (Figure 5b, Figure 5c, and Figure 5e) distributions appear to be opposite to O, showing higher intensities in the west of the SNR. The Si EW is relatively strong in both east and west (Figure 5f). The O and Fe EW enhancements are spatially correlated with the location of the dense molecular clouds where the X-ray and optical emission is generally bright (Figure 5a and Figure 5d). Since the X-ray emission in these regions is presumably dominated by the shocked dense ISM, these high O and Fe EWs are unlikely due to abundance enhancements, but appear to trace shock temperature variations. Optical spectroscopic studies have indicated that metal abundances of N49 are close to the LMC values (Russell & Dopita, 1990; Vancura et al., 1992) and support temperature variations, rather than abundances, as the origin of these EW distributions. Based on the plane-parallel shock model with a moderate ionization timescale ( 1012 cm-3 s) and the LMC abundances, the Fe L EW (Figure 5d) is in fact representative of the broad line complex at 0.8 keV, which is characteristic of a “cool” plasma ( 0.5 keV) as opposed to the “hot” component ( 1 keV) that would produce a prominent Fe L line complex at 1 keV.
In direct contrast, the H-like Ne (and/or hot Fe L) EW (Figure 5c), which is sensitive to high temperatures of 1 keV, is enhanced in the west where the blast wave is expanding into a low density ISM. These EW distributions may thus indicate the presence of an undisturbed (by dense ISM) blast wave shock in the west, which may have a higher temperature than that in the eastern side of the SNR. If the dominant contributor to the enhanced EW at 1.1 keV is Ne, comparisons between He-like and H-like Ne EW images (Figure 5b and Figure 5c) may suggest progressive ionizations of Ne by the reverse shock as detected in other SNRs (Gaetz et al., 2000; Flanagan et al., 2001; Park et al. 2002a, ). The Si EW enhancements in both east and west are intriguing and may suggest the presence of hot phases in addition to cool phase shocks in the south-east parts of the SNR (see more discussion in §3.3). The Si EW enhancements in the southeastern quadrant are largely shell-like, as indicated by a dotted line in Figure 5f. This may also be interpreted as hot, highly ionized plasma in the southeastern regions of the SNR.
The hard X-ray knot in the southwest beyond the SNR boundary, as revealed with the true-color image, shows strong enhancements in the Si, Mg, and hot Ne/Fe EW images. The actual spectral analysis indicates that these high EWs are caused by metal abundances as well as advanced ionizations and high temperature (see §3.3.3). The enhanced EWs for the elemental species caused by high metal abundances support that this hard X-ray knot may not be a background extragalactic source, and that it is likely emission from metal-rich SN ejecta associated with N49. The EW around the detected point source is, on the other hand, very low for all elemental species. These low EWs are strong indications of the continuum-dominated X-ray spectrum for the point source. This is in good agreements with the presumed identification of the point source as the neutron star, or the X-ray counterpart of SGR 052666 in the quiescent state.
3.3 X-ray Spectra
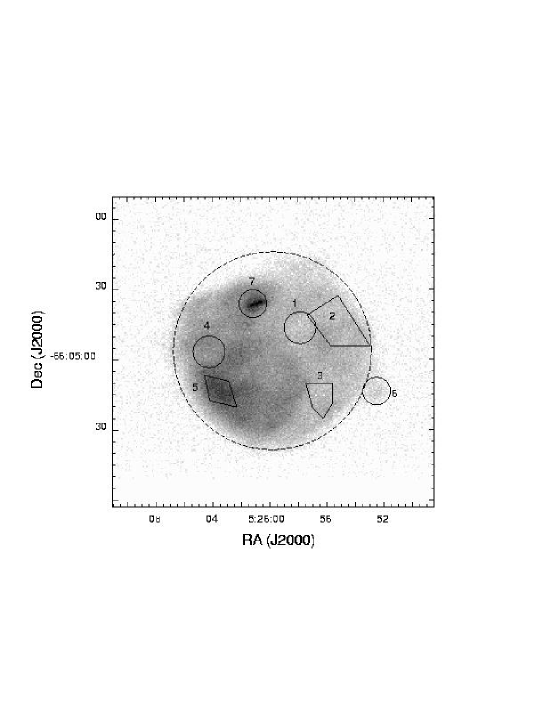
The high resolution ACIS data, for the first time, allow us to perform spatially-resolved spectral analysis in X-rays for the study of SNR N49. Despite the PSF degradations due to the large angular offset from the aim point, the GTO data provide moderate angular resolution of a few arcsec, which are still sufficient to resolve major diffuse structure of N49. Moreover, the complete spatial coverage of the SNR with the GTO data is advantageous over the archival data for the efficient and consistent study of the global structures of the SNR. Combining two data sets may not be desirable because of the significant difference in the PSF. We thus make a simple and secure approach for the spatially-resolved spectral analysis by utilizing the GTO data as the primary data and the archival data as the supplementary data: i.e., we perform all spectral analysis with the GTO data and then verify the results with the archival data as necessary. We extract the spectrum from several small regions over the SNR. The regional selections were based on the characteristics revealed by the broad band color images and the EW images, and are presented in Figure 6. In all spectral fittings, we made a low energy cut at the photon energy of = 0.5 keV because of unreliable calibrations of the ACIS spectrum in the soft bands. In most cases, we bin the data to contain a minimum of 20 counts for the spectral fitting. For the spectral analysis of our CTI corrected data, we have utilized the response matrices appropriate for the spectral redistribution of the CCD, as generated by Townsley et al. (2002b). The low energy ( 1 keV) quantum efficiency (QE) of the ACIS has been degraded because of the molecular contamination on the optical blocking filter. We have corrected this time-dependent QE degradation by modifying the ancillary response function (ARF) for each extracted spectrum by utilizing the IDL version of ACISABS software developed by Chartas et al. (2002).
3.3.1 SNR West: Single-Phase Shock
We select three regions from the western half of the SNR (regions 1, 2, and 3; Figure 6). These regions are where the broad band surface brightness is relatively low, while the EW images reveal some noticeable features (Figure 5 and Figure 6). Region 1 is where O and Ne EWs are enhanced and contains 3500 photons. Region 2 is where Ne/Fe, Mg and Si are enhanced containing 8100 counts. Region 3 shows low EW for most of the elements and contains 3200 photons. We fit these spectra with the plane-parallel shock model (Borkowski et al., 2001) as presented in Figure 7a, Figure 7b, and Figure 7c. The elemental abundances were fixed for He (= 0.89), C (= 0.30), N (= 0.12), Ca (= 0.34) and Ni (= 0.62) at values for the LMC (Russell & Dopita, 1992) (hereafter, all abundances are with respect to the solar; Anders & Grevesse 1989) since the contribution from these species in the spectral fitting is expected to be insignificant in the selected energy range. Other elements were allowed to vary. The results of the spectral fittings for the west regions of the SNR are summarized in Table 2 and Table 3.
These spectra in the western half of the SNR can be described by a thermal plasma with the best-fit of 0.52 0.65 keV. The implied absorptions are 0.6 2.7 1021 cm-2. These results are consistent with the results from the ASCA data (Hughes et al., 1998). The fitted abundances are generally consistent with the EW distributions. The results from the region 2 spectrum are perhaps the most interesting. This is where Ne/Fe, Mg, and Si EWs are enhanced and the best-fit abundances for those elemental species (except for Fe) are also relatively high, although the magnitudes of the enhancements are moderate only at around the solar level. The fitted abundances for this region suggest that the high EW responsible for the emission line at 1.1 keV (Figure 5c) is due to highly ionized H-like Ne rather than hot Fe. The best-fit shock temperature and the ionization timescale for this region are higher than region 1 in which He-like Ne EW is enhanced (Figure 5b). This supports the advanced ionization in region 2 as suggested by the EW images. The region 3 spectrum is on the other hand fitted with low LMC-like abundances for all elements. The broad band X-ray surface brightness is also low for this region, indicating X-ray emission from the shocked low density LMC ISM.
3.3.2 SNR East: Multi-Phase Shock
We select two regions from the eastern half of the SNR (regions 4 and 5; Figure 6). Region 4 is within the bright eastern rim which is evidently dominated by the hard X-ray emission as displayed in Figure 1. A total of 10000 photons are extracted from region 4. Region 5 is the brightest knot in the southeast, where we extract 17000 counts. We fit these spectra in the same way as we did for the western regions: i.e., we use the plane-parallel shock model with O, Ne, Mg, Si, S, and Fe abundances variable in the fittings. Both of the spectra in the eastern half of the SNR show significant Si Ly line ( 2.0 keV) as well as strong soft X-ray emission ( 1 keV) (Figure 7d and Figure 7e). In order to adequately describe these spectral features, a hot component shock with 1 keV is required in addition to the soft component with 0.4 0.5 keV. The hot components have larger ionization timescales ( 1012 cm-3 s) than the cool components ( 1011 cm-3 s). The fitted ionization timescales for the hot component are not constrained in the upper bounds and a thermal plasma in the complete collisional ionization equilibrium (CIE) may also fit the data with the equivalent statistical significance. The implied absorbing columns are 3 4 1021 cm-2 for these regions.
The soft component model for the region 5 spectrum indicates low metal abundances of 0.5 solar for fitted elemental species. This soft component dominates the X-ray emission at 1 keV, which consistently supports that the enhanced O and Fe EWs (Figure 5a and Figure 5d) are not caused by high abundances. The best-fit model for the hard component implies overabundances (typically 1 2 solar) compared with the LMC abundances for some elemental species. The statistical uncertainties for the fitted abundances are however large enough that the reality of these high abundances are inconclusive with the current data. For example, this region 5 spectrum may also be fitted with subsolar abundances, for both of the soft and hard components of the shock, with equivalent statistical significance based on the F-test. The EWs distributions in the east of the SNR are therefore more likely dominated by the shock temperature and the ionization states rather than by metal abundances. The fitted model parameters for the region 4 spectrum are also generally consistent with the results from region 5, which also supports the temperature and ionization states for the origins of the observed EW distributions. We note that region 4 EWs appear relatively weak for the atomic lines at low photon energies (O and Fe; Figure 5a and Figure 5d) and stronger in higher energies (Si; Figure 5f) compared with region 5, even though there is no significant difference in the fitted shock parameters between these two regions. These features may imply a difference in the local interstellar environments due to the clumpy structure of the interacting dense molecular clouds: i.e., a density gradient of the clouds between these two regions might have caused deficient soft X-ray emission in region 4 as displayed by the lack of red, soft emission there (Figure 1). The anticorrelations between optical and hard X-ray emission are supportive of this case. The fitted volume emission measure () of the soft component plasma for the region 5 spectrum is indeed significantly higher than that for region 4, which also supports this interpretation. The results of the spectral fittings for the east regions of the SNR are summarized in Table 4.
3.3.3 Extended Feature Beyond the Shock Boundary
The hard X-ray knot in the southwest beyond the main boundary of the SNR (region 6 in Figure 6) contains 800 counts and we binned the spectrum to contain a minimum of 12 counts per bin. The spectrum can be fitted with a single-temperature plane-parallel shock (Figure 7f). The spectrum features strong atomic emission lines and is most likely emission from metal-rich ejecta. The strong Si Ly line ( 2.0 keV) constrains the plasma temperature to 1 keV. Although statistical uncertainties are large due to the poor photon statistics of this faint feature, the best-fit model indicates strong enhancements in metal abundances at several times larger than solar abundances. The broad band line features between 0.8 keV and 1.2 keV represent Fe L line complex as well as He-like and/or H-like Ne K lines. With the photon statistics of the current data, it is difficult to identify these individual atomic lines. We have thus attempted fitting the spectrum by assuming dominant contributions from Ne or Fe as well as from both elements. The overall fits are statistically indistinguishable among these cases. We however note that the model fits Fe as dominant contributor (Fe abundance 0.8, Ne 0) when both Ne and Fe are simultaneously allowed to vary. Even with Fe abundance fixed at LMC value, the fitted Ne abundance is still low (0.4). We therefore obtain the best-fit model by allowing Fe abundance to vary with Ne fixed at the LMC abundance. The fitted parameters are summarized in Table 2 and Table 3.
Although the metal-rich spectrum indicates that this feature is likely emission from shocked SN ejecta, the isolated morphology of this hard X-ray knot outside of the main boundary of the SNR may suggest the possibility of a projected background object. The source position for the knot is 2000 = 05h 25m 52s.53, 2000 = 66∘ 05′ 135, and the ACIS astrometric uncertainties at 6′ off-axis is generally 2 (e.g., Feigelson et al. 2002). The Chandra/ACIS position of SGR 052666 based on the on-axis data has a conservative astrometric uncertainty of 23 (Kaplan et al. 2001 and references therein). The position of the SGR of our off-axis data as determined by wavdetect algorithm is 18 offset from the on-axis SGR position. The source positions with our off-axis data therefore appear to have 4 accuracy as a conservative limit. We have searched for counterparts around the source position in SIMBAD and NED catalogs as well as 100 multi-wavelengh on-line catalogs available through HEASARC. We find no candidate for an extragalactic counterpart within 1′ radius of the source position. The derived X-ray flux is 6.0 10-14 ergs s-1 cm-2 and 1.5 10-14 ergs s-1 cm-2. Based on the logN logS relations of the Chandra Deep Field (Brandt et al., 2001), these X-ray fluxes imply the probability of only 10-4 within a generous area of 5 radius around the source position for a coincidental detection of an extragalactic object.
We find an LMC star, MACS J0525660#037 (Tucholke et al., 1996) which has an angular offset from the position of the hard X-ray knot of 62. Considering the positional accuracy of the MACS catalog (05; Tucholke et al. 1996), the apparent angular offset between the hard X-ray knot and optical position of the MACS star is significant. We find another nearby LMC star within the OB association LH 53 as cataloged (ID # 1630) by Hill et al. (1995). The relatively small angular offset (2) of this star from the X-ray hard knot position suggests that this star could be the optical counterpart of the X-ray knot. The derived X-ray luminosity of 3.4 1034 ergs s-1 (at the distance of 50 kpc) for the X-ray knot is however higher than that of typical late-type young stellar objects ( 1028 1030 ergs s-1; e.g., Imanish et al. 2001) by a few orders of magnitude. A massive early-type star should be brighter ( 1032 ergs s-1; e.g., Seward & Chlebowski 1982), but may also not match the derived high of the hard X-ray knot. Moreover, although there are 80 LH 53 stars within 1′ radius of this hard X-ray knot position (Hill et al., 1995), none of them is detected with our ACIS observation at the flux level of this hard X-ray knot. It is unlikely for only one star to be detected with the ACIS at this particular position at this flux level.
If this object is a foreground young late-type Galactic star with a typical X-ray luminosity of 10281030 ergs s-1, this object must be nearby with a distance of 30 300 pc, and a V magnitude of 11 14 is expected from the measured X-ray flux. We have, however, found no such bright stars in Galactic star catalogs. We find a faint star in the Guide Star Catalog with an 2 offset from the source position, but the cataloged B magnitude is only 19.44. The best-fit absorbing column from the X-ray spectral modeling may also be higher ( = 1.1 1021 cm-2) than the Galactic absorption toward the position of this hard X-ray knot ( 6 1020 cm-2; Dickey & Lockman 1990).
This hard X-ray knot is therefore most likely a feature spatially associated with SNR N49. This feature then appears to be fragments from the SN explosion ejected outside of the SNR shock boundary or “shrapnel” as discovered in other Galactic SNRs such as Vela and Tycho (Aschenbach et al., 1995; Vancura et al., 1995; Warren et al., 2002). The true angular size and shape of this hard X-ray knot is however uncertain because of the poor off-axis PSF. We note that an on-axis Chandra/ACIS observation with a full angular coverage of N49, targeted on SGR 052666 has recently been performed (ObsID 2515). The detailed results from the diffuse X-ray emission of the SNR have yet to be reported.
3.3.4 Point Source
The spectrum from the point-like source is extracted from region 7 (Figure 6). Due to the angular offset from the aim point, the PSF at the position of the point source is significantly degraded (2), and we select a relatively large area (a circular region with a radius of 6), which contains 14000 photons. Although the total count rate (0.4 counts s-1) is relatively high, pileup is insignificant due to the large off-axis angle. Since the source location is within fairly bright diffuse emission from the SNR, the degraded PSF also makes the background estimation difficult. We thus include a thermal component for the background spectrum in the spectral fitting instead of subtracting the background from the source spectrum.
In a direct contrast to the diffuse emission spectra, the point source spectrum is dominated by continuum, as perhaps expected from a neutron star (Figure 8a). The source spectrum can be described with a single power law model of photon index = 2.98. The embedded background thermal component is a 0.33 keV plasma with LMC-like metal abundances, which is primarily responsible for the soft emission at 1 keV. A black body model may also fit the data ( 0.52 keV) with acceptable statistics, but appears, qualitatively, inappropriate to describe the hard tail of the specrum.
Since the archival data are pointed in the direction of the position of the point source or SGR 052666, the on-axis high angular resolution allows us to manipulate the background subtraction with less confusion. We extract the source spectrum from a circular region with a radius of 2, which contains 10000 photons. Because of the utilized short time-frame (0.4 s), pileup is negligible with this on-axis observation. SGR 052666 is on top of complex filamentary structure of the diffuse emission from the SNR and the background emission for the SGR is non-uniform (Figure 1b). We thus extract the background emission from the immediate annular region centered on the point source position (inner radius of 25 and outer radius of 4), in order to obtain an “average” spectrum over the variable emission features around the SGR. The SGR spectrum from the on-axis data can be fitted with a single power law model (Figure 8b). The best-fit photon index is = 2.72 which is in good agreement with the result from the off-axis data. The results from the fit with a black body model ( 0.50 keV) are also identical to the off-axis data and appear inadequate by the reason of the same hard-tail discrepancy. The implied X-ray luminosity is = 2.1 1035 ergs s-1 in the 2 10 keV band with the off-axis data ( = 2.5 1035 ergs s-1 based on the on-axis data), which is consistent with the ASCA upper limit (Hughes et al., 1998) and that of the Galactic SGR 180620 (Mereghetti et al., 2000). The results from the spectral model fits of the point source are summarized in Table 5.
4 DISCUSSION
4.1 Multi-Phase Shock Structure
The X-ray color images and the EW images indicate complex spectral structure of the diffuse X-ray emission across the SNR N49. The filamentary and clumpy emission features in the eastern half of the SNR show spatially distinctive bright structures in different colors. The spatial and spectral structure of the X-ray emission in the western half is relatively uniform, primarily represented by intermediate-to-hard emission (green-blue) with low surface brightness. The soft (red-yellow) X-ray shell-like emission features represent the blast wave shock front as observed in the radio band. The overall features of the EW images indicate enhancements of soft line emission ( 1 keV) in the south-east and hard emission lines ( 1 keV) in the west of the SNR. These features are consistent with the overall density distributions of the ambient ISM; i.e., the blast wave is propagating into a low density ISM in the west and interacting with dense clouds in the east. The comparisons between the X-ray and optical images also suggest that the hard X-ray emission ( 1.6 keV) appears to be produced in less-dense intercloud regions while the soft X-rays ( 0.75 keV) originate near the dense clouds.
The results from the spatially-resolved spectral analysis confirm the speculations inferred from the image analysis by revealing that shock temperatures and ionization states in the east of the SNR are significantly different from those in the western half: i.e., the western portion of the SNR is described by a simple one-temperature plane-parallel shock with relatively large ionization timescales while two-temperature model with multiple ionization timescales is required in the eastern half. The global spectral structure of the SNR may then be represented by a multi-phase shock model with three characteristic temperatures, i.e., the “cool” ( 0.44 keV) and “hot” ( 1.25 keV) components in the east, and the “intermediate” ( 0.59 keV) component in the west. The presence of multiple phases of the shock due to the interactions of the blast wave with the dense molecular clouds has been put forth by Hester & Cox (1986). Recently, based on the high resolution Chandra/ACIS observation of the Galactic SNR Cygnus Loop, Levenson et al. (2002) reported evidence for the three distinct regions characterised as: (i) the forward shock decelerated by the clouds, (ii) the postshock SNR interior, and (iii) the reflected shock that re-heated the postshock regions. In this context, we propose that the cool component of X-ray emission from N49 corresponds to the forward shock entering the dense clouds, the intermediate component to emission from the postshock region, and the hot component to emission from the re-heated postshock region, respectively. Comparisons of the X-ray emission features with optical images indicate that the soft X-rays are spatially coincident with the bright optical knots while the hard X-ray emission is anti-correlated with the optical intensity distribution. Since the bright filamentary optical emission features are believed to originate from the slow, cool radiative shock entering dense molecular clouds, the observed correlation/anti-correlation between X-ray and optical images provide good support for the suggested multi-phase shock interpretation.
Hester et al. (1994) have developed a simple 1-dimensional model in order to describe such a multi-phase shock structure of the nearby Galactic SNR Cygnus Loop, probably a “magnified” version of the distant SNR N49. Our best-fit electron temperatures indicate that the ratios of temperatures between the re-heated postshock and the postshock without re-heating are = 1.8 2.3, which implies the preshock cloud density 30 2500 based on the model by Hester et al. (1994), where is the preshock intercloud density. Assuming the preshock intercloud density 0.9 cm-3 as estimated from the optical spectroscopy Vancura et al. (1992), we derive 27 2300 cm-3 for the interacting dense molecular clouds. This is in plausible agreements with the previous estimations based on optical/UV spectroscopy ( = 20 940 cm-3; Vancura et al. 1992). The best-fit s in the eastern regions imply (/)2(/) = 2 13, where is the X-ray emission volume of the cool forward shock component and is the X-ray emission volume of the hot re-heated component (we assume an X-ray emitting volume filling factor of 1, hereafter). Provided that / is in the order of 101 103, this implies / 0.01. The soft X-ray emission from the cool forward shock is then from the blast wave entering small-volume, clumpy clouds while the hot component originates from the large-volume, re-heated intercloud postshock regions. For an adiabatic shock, the relations between the shock temperature and the shock velocity is = and can be written as
where is the shock temperature, is the shock velocity, and mean atomic mass 0.7 ( = proton mass). The cool component shock velocity is then = 582 km s-1, the hot component velocity is = 981 km s-1, and the intermediate velocity is = 674 km s-1. For comparisons, Vancura et al. (1992) have derived a shock velocity of = 730 km s-1 for the X-ray emission of N49 (Note: For simplicity, we assumed the electron and ion temperatures in equalibration in these calculations).
The ionization timescale () ratios between the cool and the hot components are ()c/()rh 0.1, which implies 0.01, where is the ionization age of the shock entering the clouds and is the ionization age of the re-heated regions. Assuming an SN explosion energy of = 1051 ergs, the SNR radius of = 10 pc based on the X-ray image of N49, and the preshock density = 0.9 cm-3, the implied Sedov dynamical age (Sedov, 1959), is 6600 yr. Assuming is on the order of or 104 yr, the measured ratios imply 100 yr. This short ionization age suggests that the soft X-ray emission ( 0.44 keV) has been produced by a rapidly decelerated shock entering dense molecular clouds as was observed from the Cygnus Loop SNR (Hester et al., 1994).
4.2 Supernova Ejecta Fragments
The hard X-ray knot in the southwest beyond the SNR blast wave shock front (region 6; Figure 6) is most likely associated with the SNR rather than a background/foreground object. The X-ray spectrum is dominated by emission lines and can be described with a 1 keV plasma with metal-rich abundances, which supports the shocked ejecta origin. The fitted plane-parallel shock model indicates a highly advanced ionization state ( 5 1013 cm-3 s-1) and the spectrum may also be equally described with a thermal plasma in the CIE. The high temperature and the large ionization timescale of this feature are also supportive of its origin as the high-speed ejecta fragments created at the time of the SN explosion.
Because of the PSF degradation, the apparent angular extension of this feature (5 in radius) is likely an artifact and the true morphology is uncertain with the current data. In order to estimate the electron density , we thus assume two extreme cases of a circular shape with a radius of 5 (for the apparent angular size and so 1.2 pc radius in physical size at the distance of = 50 kpc) and 05 (for the case of an unresolved point-like source, and so the physical size of 0.125 pc radius at = 50 kpc). The assumed range of the physical size of the knot (0.1 pc 1.2 pc in radius) is reasonably consistent with the SN ejecta fragments detected in other Galactc SNRs of Vela and Tycho (Vancura et al., 1995; Miyata et al., 2001). Assuming the distance of 50 kpc to the SNR and a simple spherical geometry for the X-ray emitting volume, the best-fit implies of 2.3 cm-3 to 68 cm-3 depending on the assumed emission volume. Based on the best-fit abundances, we may derive the ejecta mass of 0.001 0.03 . Although this range of the ejecta mass is in reasonable agreements with other Galactic SN ejecta fragments (Tsunemi et al., 1999; Aschenbach et al., 1995; Strom et al., 1995), we caution that these estimations are crude due to the large uncertainties in the fitted abundances and assumed emission volumes.
The angular offset of the hard X-ray knot from the geometrical center of N49 is 48. The spatial separation of this knot from the center of the SNR is then = 11.6 ()-1 pc, where is the distance to N49 in the units of 50 kpc, and is the angle between the line of sight and the moving direction of the knot. Assuming that the SN explosion site, so the birth place of the observed ejecta fragments, is close to the geometrical center of the current X-ray remnant of N49, the mean transverse velocity is = 1717 km s-1, where is the spatial separation of the knot from the geometrical center of the SNR in the units of 11.6 pc, and is the age of the SNR in the units of 6600 yr. The analysis on this hard X-ray knot is however substantially limited by the poor PSF. Follow-up on-axis Chandra observations would be essential to unveil the detailed nature of this feature.
4.3 SGR 052666
The Chandra/ACIS observations conclusively detect an X-ray point source at the position of SGR 052666 within the boundary of SNR N49. The X-ray spectrum of this point source is dominated by continuum, which can be described with a power law model (see §3.3.4). This point source is thus confidently identified with the X-ray counterpart of quiescent phase SGR 052666.
The single power law model indicates a soft spectrum with 3 for SGR 052666, which resembles the typical spectrum of the AXPs (Mereghetti et al. 2002 and references therein), while the X-ray spectra from Galactic SGRs are described with harder single power laws of 2 (Sonobe et al., 1994; Kouveliotou et al., 1998; Woods et al., 1999; Mereghetti et al., 2000; Kouveliotou et al., 2001). As X-ray spectra from the AXPs and SGRs can be described with the power law + black body models, we have made an attempt to fit the SGR 052666 spectrum with such a multi-component model. With the off-axis GTO data, the fitted black body temperature ( 0.55 keV) is consistent with typical AXP/SGR spectra, and the improvement in the overall fit is also statistically significant based on the F-test. The power law component, with the addition of the black body component, however implies substantially harder spectrum ( 1.7) than those of the AXPs ( 34; Mereghetti et al. 2002 and references therein). Nonetheless, the two component model is still in good agreements with Galactic SGRs as they are fitted with 12 and black body temperature 0.5 keV (Woods et al., 1999; Kouveliotou et al., 2001). We however note that this two component model is not required to describe the on-axis data. Since the embedded confusion level caused by the background in the spectral model fitting is more severe for the off-axis data than the on-axis data, we consider that the presence of the black body component is inconclusive, although the improvement in the fit for the off-axis data is statistically significant with the additional black body component. Recently, Kulkarni et al. (2002) have reported the results from the spectral analysis of SGR 052666 utilizing two Chandra/ACIS GO observations: one (ObsID 747) of those two data sets was identical to that we uitilze in the current work. They found that the observed spectrum of the SGR was best described by a black body + power law model, which appears to be inconsistent with our results. Although the origin of the inconsistency is unclear, we may attribute the descrepancy to the background estimations utilized in the spectral analysis. As Kulkarni et al. (2002) pointed out, their SGR source spectrum apparently include residual emission from the diffuse SNR, whereas such a contamination in our on-axis source spectrum appears to be negligible. The soft X-rays from the diffuse emission of the SNR might have caused the slight differences in the results of the spectral analysis as presented by Kulkarni et al. (2002). We have also noticed that Kulkarni et al. (2002) have not incorperated the CTI and QE corrections in their data reduction. Although the substantial contributions by the CTI and the QE degradation effects on a point-like source in the observation taken in a relatively early phase of the Chandra mission are unlikely, we speculate that potential contaminations from these artifacts in the spectral analysis of any ACIS data cannot be completely ruled out. In addition, we would like to comment on the spectral analysis of some parts of the diffuse emission from N49 by Kulkarni et al. (2002). They have used a MEKAL model for such a spectral analysis, which should be inappropriate for the complicated diffuse SNR emission as we presented in the current work. More complex, physically realistic models should be utilized in order for an appropriate spectral analysis of such data.
The results from our simple spectral analysis may support the speculation that SGR 052666 is a transition object bridging the AXP and the SGR phases of neutron stars (Kaplan et al., 2001). Extensive analyses with the on-axis observations, which are beyond the scope of the current work, would however be necessary to understand the detailed astrophysical characteristics of this object. For example, the measurements of the period () and the period derivative (Ṗ) would be critical to determine the magnetic field strengh and the spin-down age of SGR 052666. This information can provide important clues on the nature of SGR 052666 such as the identification with a high-field ( 1015 G) neutron star or the “magnetar” (Paczyński, 1992; Duncan & Thompson, 1992). The measurement of the spin-down age would also be useful to test the physical association of SGR 052666 with SNR N49, which should provide important implications on the possible astrophysical connections between the SGRs and the AXPs (e.g., Gaensler et al. 2001). Kulkarni et al. (2002) have recently reported a detection of the 8.04 s pulsation from SGR 052666 by utilizing 85 ks Chandra/ACIS observations. The derived magnetic dipole field strength is high ( 7 1014 G) and supports the magnetar interpretation. The estimated spin-down age (/2Ṗ 2000 yr) is consistent with the dynamical age of SNR N49, which support the physical association between N49 and SGR 052666. The location of SGR 052666 in the LMC and the likely association with N49 is also supported by the fitted columns: i.e., the absorbing columns for N49 and SGR 052666 are consistent. This SGR location may confirm the enormous energy release in the 1979 March -ray burst.
If SGR 052666 is indeed the compact remnant of the SN explosion which has also created SNR N49 and it was born near the center of N49, we may estimate its transverse velocity. The angular offset of SGR 052666 from the geometrical center of N49 is 22, which implies that the spatial separation of the SGR from the center of the SNR is = 5.3 ()-1 pc at the distance of 50 kpc. Assuming that SGR 052666 is the neutron star born at the time of the SN explosion that produced N49, and that the age of the SGR is 6600 yr, the mean transverse velocity is 787 km s-1. This would suggest that SGR 052666 is a young, high velocity neutron star that is in a different class than typical AXPs instead of being the same class object as other AXPs, simply in a more evolved phase.
5 SUMMARY
SNR N49 in the LMC has been observed with Chandra/ACIS. The high resolution “true-color” ACIS images reveal complex X-ray filamentary structures which represent the blast wave shock sweeping through the ambient ISM and the shock interacting with the nearby dense molecular clouds. The overall features from the EW images of the detected elemental species indicate that soft line emission is enhanced in the south-east while hard line emission is enhanced in the west of the SNR. These overall EW features are most likely dominated by the variations in the shock temperature and the ionization states of the plasma across the SNR. The spatially-resolved spectral analysis of N49 suggests that the X-ray emission from the SNR can be described with multiple-phase shocks representing the singly-postshock region, the re-heated postshock region by the reflected shocks, and the cool forward shock entering the dense molecular clouds.
We detect a hard X-ray knot in the southwest of N49 beyond the SNR shock boundary. The X-ray spectrum of this knot is emission line dominated and can be described with a metal-rich hot thermal plasma. This result implies that this hard knot appears to be ejecta fragments created at the time of the SN explosion that produced SNR N49. The PSF degradation of the off-axis observation however restricts the data analysis of this feature and preclude resolving the angular structure of this knot. Follow-up on-axis observations with a decent exposure might be necessary to address the detailed nature of this feature.
The ACIS observations of N49 also firmly detect the X-ray counterpart of the quiescent phase of SGR 052666. The X-ray spectrum of SGR 052666 is continuum dominated and can be fitted with a power law model. The implied photon index is 3. This power law spectrum is generally consistent with those from the AXPs although the observed -ray burst of SGR 052666 is a rare characteristic of typical AXPs.
References
- Anders & Grevesse (1989) Anders, E., & Grevesse, N. 1989, Geochimica et Cosmochimica Acta, 53, 197
- Aschenbach et al. (1995) Aschenbach, B., Egger, R., & Trümper, J. 1995, Nature, 373, 587
- Banas et al. (1997) Banas, K. R., Hughes, J. P., Bronfman, L., & Nyman, L. A. 1997, ApJ, 480, 607
- Borkowski et al. (2001) Borkowski, K. J., Lyerly, W. J., & Reynolds, S. P. 2001, ApJ, 548, 820
- Brandt et al. (2001) Brandt, W. N., Alexander, D. M., Hornschemeier, A. E., Garmire, G. P., Schneider, D. P., Barger, A. J., Bauer, F. E., Broos, P. S., Cowie, L. L., Townsley, L. K., Burrows, D. N., Chartas, G., Feigelson, E. D., Griffiths, R. E., Nousek, J. A., &, Sargent, W. L. W. 2001, AJ, 122, 2810
- Chartas et al. (2002) Chartas, G. et al. 2002, ApJL, Submitted (also Chandra Contributed Software: http://asc.harvard.edu/cont-soft/software/ACISABS.1.1.html).
- Cline et al. (1982) Cline, T. L., Desai, U. D., Teegarden, B. J., Evans, W. D., Klebesadel, R. W., Laros, J. G., Barat, C., Hurley, K., Niel, M., Vedrenne, G., Estulin, I. V., Kurt, V. G., Mersov, G. A., Zenchenko, V. M., Weisskopf, M. C., & Grindlay, J. 1982, ApJ, 255, L45
- Danziger & Leibowitz (1985) Danziger, I. J., & Leibowitz, E. M. 1985, MNRAS, 216, 365
- Dickel et al. (1995) Dickel, J. R., Chu, Y.-H., Gelino, C., Beyer, R., Burton, M. G., Milne, D. K., Spyromilio, J., Green, D. A., Wilkinson, C., & Junkes, N. 1995. ApJ, 448, 623
- Dickel & Milne (1998) Dickel, J. R., & Milne, D. K., 1998, AJ, 115, 1057
- Dickey & Lockman (1990) Dickey, J. M., & Lockman, F. J. 1990, ARA&A, 28, 215
- Dopita (1979) Dopita, M. A. 1979, ApJS, 40, 455
- Duncan & Thompson (1992) Duncan, R. C., & Thompson, C. 1992, ApJ, 392, L9
- Feigelson et al. (2002) Feigelson, E. D., Broos, P., Gaffney III, J. A, Garmire, G., Hillenbrand, L. A., Pravdo, S. H., Townsley, L., Tsuboi, Y. 2002, Submitted to ApJ (astro-ph/0203316)
- Fender et al. (1998) Fender, R. P., Southwell, K., & Tzioumis, A. K., 1998, MNRAS, 298, 692
- Flanagan et al. (2001) Flanagan, K. A. et al. 2001, in AIP Conference proceedings, 565, Young Supernova Remnants, ed., S. S. Holt & U. Hwang (New York: AIP), 226
- Gaensler et al. (2001) Gaensler, B. M., Slane, P. O., Gotthelf, E. V., & Vasisht, G. 2001, ApJ, 559, 963
- Gaetz et al. (2000) Gaetz, T. J., Butt, Y. M., Edgar, R. J., Eriksen, K. A., Plucinsky, P. P., Schlegel, E. M., & Smith, R. K. 2000, ApJ, 534, L47
- Hester & Cox (1986) Hester, J. J., & Cox, D. P. 1986, ApJ, 300, 675
- Hester et al. (1994) Hester, J. J., Raymond, J. C., & Blair, W. P. 1994, ApJ, 420, 721
- Hill et al. (1995) Hill, R. S., Cheng, K.-P., Bohlin, R. C., O’Connel, R. W., Roberts, M. S., Smith, A. M., & Stecher, T. P. 1995, ApJ, 446, 622
- Hughes et al. (1998) Hughes, J. P., Hayashi, I., & Koyama, K. 1998, ApJ, 505, 732
- Imanishi et al. (2001) Imanishi, K., Koyama, K., & Tsuboi, Y. 2001, ApJ, 557, 747
- Kaplan et al. (2001) Kaplan, D. L., Kulkarni, S. R., van Kerkwijk, M. H., Rothschild, R. E., Lingenfelter, R. L., Marsden, D., Danner, R., & Murakami, T. 2001, ApJ, 556, 399
- Kouveliotou et al. (1998) Kouveliotou, C. 1998, Nature, 393, 235
- Kouveliotou et al. (2001) Kouveliotou, C., Tennant, A., Woods, P. M., Weisskopf, M. C., Hurley, K., Fender, R. P., Garrington, S. T., Patel, S. K., & Göğüş, E. 2001, ApJ, 558, L47
- Kulkarni et al. (2002) Kulkarni, S. R., Kaplan, D. L., Marshall, H. L., Frail, D. A., Murakami, T., & Yonetoku, D. 2002, ApJ, in press (astro-ph/0209520)
- Levenson et al. (2002) Levenson, N. A., Graham, J. R., & Walters, J. L. 2002, ApJ, in press
- Long et al. (1981) Long, K. S., Helfand, D. J., & Grabelsky, D. A. 1981, ApJ, 248, 925
- Marsden et al. (1996) Marsden, D., Rothschild, R. E., Lingenfelter, R. E., & Puetter, R. C. 1996, ApJ, 470, 513
- Mazets et al. (1979) Mazets, E. P., Golenetskii, S. V., Ilinskii, V. N., Aptekar, R. L., & Guryan, Y. A. 1979, Nature, 282, 587
- Mereghetti et al. (2000) Mereghetti, S., Cremonesi, D., Feroci, M., & Tavani, M. 2000, A&A, 361, 240
- Mereghetti et al. (2002) Mereghetti, S., Chiarlone, L., Israel, G. L., & Stella, L. 2002, “Neutron Stars, Pulsars and Supernova Remnants”, Proceedings of the 270. WE-Heraeus-Seminar, Bad Honnef, January 2002, eds. W. Becker, H. Lesch & J. Trümper, MPE-Report in press (astro-ph/0205122)
- Miyata et al. (2001) Miyata, E., Tsunemi, H., Aschenbach, B., & Mori, K. 2001, ApJ, 559, L48
- Paczyński (1992) Paczyński, B. 1992, Acta Astron., 42, 145
- (36) Park, S., Roming, P. W. A., Hughes, J. P., Slane, P. O., Burrows, D. N., Garmire, G. P., & Nousek, J. A. 2002a, ApJ, 564, L39
- (37) Park, S. Burrows, D. N., Garmire, G. P., Nousek, J. A., Hughes. J. P., & Slane, P. O. 2002b, ApJ, Submitted
- Rothschild et al. (1994) Rothschild, R. E., Kulkarni, S. R., & Lingenfelter, R.E. 1994, Nature, 368, 432
- Russell & Dopita (1990) Russell, S. C., & Dopita, M. A., 1990, ApJS, 74, 93
- Russell & Dopita (1992) Russell, S. C., & Dopita, M. A., 1992, ApJ, 384, 508
- Sedov (1959) Sedov, L. I. 1959, Similarity and Dimensional Methods in Mechanics, transl. M. Friedman (New York: Academic Press)
- Seward & Chlebowski (1982) Seward, F. D., & Chlebowski, T. 1982, ApJ, 256, 530
- Shull et al. (1985) Shull, P., Dyson, J. E., Kahn, F. D., & West, K. A. 1985, MNRAS, 212, 799
- Smith et al. (1998) Smith, I. A. et al. 1998, AdSpS, 22, 1133
- Sonobe et al. (1994) Sonobe, T., Murakami, T., Kulkarni, S. R., Aoki, T., & Yoshida, A. 1994, ApJ, 436, L23
- Strom et al. (1995) Strom, R., Johnston, H. M., Verbunt, F., & Aschenbach, B. 1995, Nature, 373, 590
- Townsley et al. (2000) Townsley, L. K., Broos, P. S., Garmire, G. P., & Nousek, J. A. 2000, ApJ, 534, L139
- (48) Townsley, L. K., Broos, P. S., Nousek, J. A., & Garmire, G. P. 2002a, Nuclear Instruments & Methods in Physics Research Section A, 486, 751
- (49) Townsley, L. K., Broos, P. S., Chartas, G., Moskalenko, E., Nousek, J. A., & Pavlov, G. G. 2002b, Nuclear Instruments & Methods in Physics Research Section A, 486, 716
- Tsunemi et al. (1999) Tsunemi, H., Miyata, E., & Aschenbach, B. 1999, PASJ, 51, 711
- Tucholke et al. (1996) Tucholke, H.-J., de Boer, K. S., & Seitter, W. C. 1996, A&AS, 119, 91
- Vancura et al. (1992) Vancura, O., Blare, W. P., Long, K. S., & Raymond, J. C. 1992, ApJ, 394, 158
- Vancura et al. (1995) Vancura, O., Gorenstein, P., & Hughes, J. P. 1995, ApJ, 441, 680
- Warren et al. (2002) Warren, J. S., Hughes, J. P., & Slane, P. O. 2002, ApJ, in press
- Woods et al. (1999) Woods, P. M., Kouveliotou, C., van Paradijs, J., Finger, M. H., Thompson, C. 1999, ApJ, 518, L103
| Elements | Line | LowaaThe high and low energy bands around the selected line energies used to estimate the underlying continuum. | HighaaThe high and low energy bands around the selected line energies used to estimate the underlying continuum. |
|---|---|---|---|
| (eV) | (eV) | (eV) | |
| O | 590 740 | 300 550 | 1200 1280 |
| Fe L | 750 870 | 300 550 | 1200 1280 |
| Ne (He) | 880 950 | 300 550 | 1200 1280 |
| Ne (Ly)/Fe L | 980 1100 | 300 550 | 1200 1280 |
| Mg | 1290 1550 | 1200 1280 | 1630 1710 |
| Si | 1750 2100 | 1630 1710 | 2140 2280 |
| RegionbbRegions as marked in Figure 6. | ccErrors are obtained after fixing and at the best-fit values. | ddVolume emission measure, = . | ||||
|---|---|---|---|---|---|---|
| (1021 cm-2) | (keV) | (1011 cm-3 s) | (1058 cm-3) | |||
| 1 | 2.7 | 0.52 | 8.6 | 2.01 | 43.3 | 60 |
| 2 | 1.2 | 0.65 | 70.0 | 2.79 | 77.0 | 93 |
| 3 | 2.5 (0.6) | 0.59 | 31.5 | 1.71 | 59.9 | 56 |
| 6 | 3.6 (1.1) | 1.04 | 41.0 (500) | 0.27 (0.12) | 19.5 | 36 |
| RegionbbRegions as marked in Figure 6. | O | Ne | Mg | Si | S | Fe |
|---|---|---|---|---|---|---|
| 1 | 0.90 | 1.01 | 0.53 | 0.39 | 5.77 (1.91) | 0.17 |
| 2 | 1.23 | 1.80 | 0.78 | 0.86 | 1.75 | 0.25 |
| 3 | 0.46 | 0.30 | 0.16 | 0.19 | 4.02 (1.50) | 0.18 |
| 6 | 5.71 | 0.33 (fixed) | 502.7 (1.11) | 5.92 | 1334.2 (3.98) | 0.94 |
| RegionbbRegions as marked in Figure 6. | Shock | ccErrors are obtained after fixing and at the best-fit values. The 90% limits (with the best-fit values in the parentheses) are presented where the best-fit parameters are unconstrained. | ddVolume emission measure, = . | ||||
|---|---|---|---|---|---|---|---|
| (1021 cm-2) | Components | (keV) | (1011 cm-3 s) | (1058 cm-3) | |||
| 4 | 3.9 | 67.7 | 94 | soft | 0.47 | 0.8 | 3.81 |
| hard | 1.08 | 14.6 (40.9) | 2.19 | ||||
| 5 | 3.6 | 86.7 | 96 | soft | 0.41 | 1.1 | 19.83 |
| hard | 1.41 | 9.3 (22.1) | 1.53 |
| RegionbbRegion #, as marked in Figure 6, is presented for the GTO data. “On-axis” indicates the source region from the archival data. | ccErrors are with a 90% confidence. | ccErrors are with a 90% confidence. | ddThe 2 10 keV band X-ray luminosity assuming a distance of 50 kpc to the source. | ||
|---|---|---|---|---|---|
| (1021 cm-2) | (1035 ergs s-1) | ||||
| 7 | 4.4 | 2.98 | 2.1 | 113.7 | 143 |
| on-axis | 4.7 | 2.72 | 2.5 | 131.8 | 170 |