Interstellar H2 in M 33 detected with Fuse††thanks: Based on observations made with the NASA-CNES-CSA Far Ultraviolet Spectroscopic Explorer, available in the public archive. FUSE is operated for NASA by the Johns Hopkins University under NASA contract NAS5-32985.
Fuse spectra of the four brightest H ii regions in M~33 show absorption by interstellar gas in the Galaxy and in M~33. On three lines of sight molecular hydrogen in M~33 is detected. This is the first measurement of diffuse H2 in absorption in a Local Group galaxy other than the Magellanic Clouds. A quantitative analysis is difficult because of the low signal to noise ratio and the systematic effects produced by having multiple objects in the Fuse aperture. We use the M~33 Fuse data to demonstrate in a more general manner the complexity of interpreting interstellar absorption line spectra towards multi-object background sources. We derive H2 column densities of to cm-2 along 3 sight lines (NGC~588, NGC~592, NGC~595). Because of the systematic effects, these values most likely represent upper limits and the non-detection of H2 towards NGC~604 does not exclude the existence of significant amounts of molecular gas along this sight line.
Key Words.:
Galaxies: individual: M 33 – ISM: abundances – ISM: molecules – Ultraviolet: ISM1 Introduction
Observations with the Copernicus satellite have shown that the ISM of the Milky Way contains large amounts of molecular hydrogen. The mass in H2 may even dominate that in atomic form (see Savage et al. 1977). Since 1996 other galaxies also have become accessible for investigation of the content of H2, using Orfeus and Fuse far ultraviolet spectra. Both the Large and the Small Magellanic Cloud appear to have substantial amounts of H2 as found from absorption line studies (de Boer et al. deboer (1998); Richter et al. richter98 (1998); Richter richter00 (2000), Tumlinson et al. tumlinson (2002)).
Fuse has sufficient sensitivity to record spectra of bright sources in other nearby galaxies such as M~31 and M~33. It is of importance to extend our knowledge about the content in molecular gas to galaxies other than the Milky Way and the LMC and SMC. These galaxies have different histories, different stellar contents and different abundances. An intercomparison of these galaxies may lead to clues about the interplay of molecular cloud and star formation with chemical content and radiation field.
M 33 is the smallest spiral galaxy of the Local Group at a distance of kpc. It has a ragged optical appearance and bright H ii regions, some of them catalogued as NGC objects. The galaxy is inclined at 55∘ and shows signs of bending as derived from 21 cm radio synthesis observations (Rogstad et al. rogstad (1976)). In the direction of two of the bright H ii regions CO has been found in emission (Wilson & Scoville wilsco (1992)). The metallicity of M 33 is subsolar with a radial abundance gradient which differs for different elements. For example, neon abundances in the observed H ii regions vary between 0.2 and 0.3 dex subsolar (see Willner & Nelson-Patel willner (2002)). Vibrationally excited H2 has been found in emission by Israel et al. (1990) towards NGC 604, most likely from background gas.
In this paper we investigate Fuse spectra of four bright objects in M 33. Each of these consist of a number of young and thus UV-bright stars surrounded by an H ii region. In 3 of the 4 spectra H2 is detected in absorption in M~33.
In Sect. 2 we give some information about the instrument, the targets, and the data reduction, in Sect. 3 the difficulties with the interpretation of interstellar absorption spectra towards multi-object background sources are described. The measurements are presented in Sect. 4, followed by a discussion of the results in Sect. 5.
| Object | Observation ID | Pos. angle | Exp. time | |||
|---|---|---|---|---|---|---|
| NGC 588 | a0860404001 | 01 32 45.50 | +30 38 55.00 | 2819 s | 8 | |
| a0860404002 | 2401 s | |||||
| NGC 592 | a0860202001 | 01 33 12.30 | +30 38 49.00 | 2164 s | ? | |
| a0860202002 | 1800 s | |||||
| NGC 595 | a0860303001 | 01 33 33.60 | +30 41 32.00 | 3620 s | 12 | |
| NGC 604 | a0860101001 | 01 34 32.50 | +30 47 04.00 | 3633 s | 9 | |
| a0860101002 | 3520 s |
2 Data


2.1 The instrument
Fuse is equipped with four coaligned telescopes and Rowland spectrographs. The detectors are two microchannel plates. For a description of the instrument and its on-orbit performance see Moos et al. (moos (2000)) and Sahnow et al. (sahnow (2000)). Information about Fuse data and their analysis can be found in the Fuse Data Handbook111Available at http://fuse.pha.jhu.edu/analysis/dhbook.html.
The typical velocity resolution of Fuse spectra is about km s-1. Because of variations in the alignment of the 8 different detector channels the measurement of absolute radial velocities is problematic and requires a separate discussion (see Sect. 4.2).
The sensitivity threshold of Fuse is set by the uncertainty in the background intensity level. It is below erg cm-2 s-1 Å-1. To allow a reasonable short integration time the source flux should be higher than about erg cm-2 s-1 Å-1.
2.2 The targets
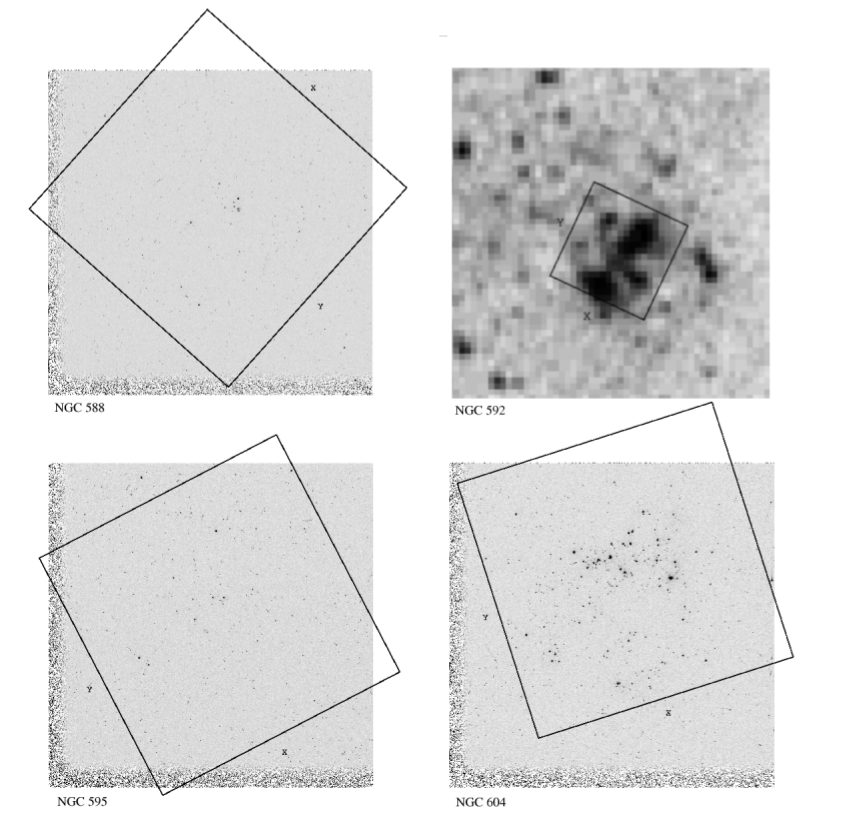
The targets are the UV-bright cores of the H ii regions NGC 588, NGC 592, NGC 595, and NGC 604 in M~33. For the Fuse observations an entrance aperture with size of square arcsec was used, being equivalent to pc2 in M~33. The precise locations of the apertures with their orientation and the exposure times are given in Table 1.
Inspection of imagery of the M~33 H ii regions shows that the Fuse aperture has included numerous objects, of which only few were bright enough in the UV to have contributed to the background flux. Nevertheless, the signal recorded is the sum of the flux of several stars. This implies that the spectra provide a blend of spectra from different lines of sight with different line of sight gas (composition and velocity) structure, in particular within M~33.
In an attempt to account for this complexity, the imagery (Fig. 1) has been investigated to identify the brightest sources in the field. We have included the scanty information from that in Table 1.
The complexity of the background sources complicates the interpretation of the interstellar absorption features as described in Sect. 3. Furthermore, the shape of the continua is difficult to assess in some cases.
While the FUV fluxes of all 4 H ii regions are well above the sensitivity of Fuse ( erg cm-2 s-1 Å-1 for NGC~588, NGC~592, and NGC~595), the exposure times were too short to have more than to counts per km s-1 resolution element. An exception is the NGC~604 spectrum where the flux ( erg cm-2 s-1 Å-1) provides roughly 400 counts per resolution element. Sample interstellar spectra are shown in Fig. 2, a few other spectra are given by Wakker et al. (wakker (2002)). Note that the spectra in Fig. 2 are rebinned over 10 pixels. The resulting pixel size corresponds roughly to one resolution element.
2.3 Data reduction
The raw spectra were calibrated with the Calfuse 1.8.7 reduction pipeline. For analysis the spectra were smoothed with a 5 pixel (NGC 604) or a 10 pixel boxcar filter (NGC 588, 592, 595) in order to handle the strong noise. Equivalent widths were measured using trapezium or Gaussian fits. The errors were calculated taking into account the photon statistics and the uncertainty in the choice of the continuum.
A calibration of the velocity zero point was made by comparison to radio data (see Sect. 4.2).
3 General considerations for the interpretation

3.1 Velocity structure
Due to the presence of several background targets within the Fuse aperture the resulting spectrum is the sum of single spectra with different fluxes and absorption features. At the distance of M~33 one arcsecond corresponds to a projected distance of about pc, so the Fuse aperture covers an area of roughly pc2. As Fig. 1 shows, the stars which dominate the UV fluxes lie within smaller areas of about to pc2. On this scale significant fluctuations in velocity structure, -values, and column densities of the M~33 interstellar medium can be expected, especially for molecular gas that exists in confined regions.
The velocity structure seen in such a sum spectrum thus reflects the combination of the possible presence of gas clouds with different velocities in front of the cluster, and/or possibly differing absorption velocities on the individual sight lines.
For the Galactic foreground absorption the latter effect of widely separated background sources in M~33 is probably of minor importance. While column density variations in the ISM are known to exist on small scales, velocity variations appear to be rather small (see e.g. Andrews et al. andrews (2001)).
Background sources separated in angle have yet another effect on the velocity structure of the spectrum. If the background sources are spread in the direction of dispersion, equal intrinsic absorption velocities and structures would be spread out to a maximum of about 100 km s-1. As can be seen in Fig. 2, the H2 and metal line absorption is wider than normally seen, but substantially less than the indicated maximum spread. We conclude that the velocity smearing due to multiple background sources is less than km s-1.
3.2 Absorption strength
In order to judge in which way the blending of the light from the individual objects affects the interpretation of the spectra we will consider a simple but realistic case.
For a single line of sight, several clouds and velocity components contribute to the interstellar absorption spectrum and the optical depth in an absorption profile is the sum of optical depths along the sight line.
In contrast, for a sum of spectra of different sight lines the measured equivalent widths of interstellar lines are mean values of the equivalent widths belonging to individual sight lines weighted by the flux of the background sources.
We have constructed a simple case of blending to investigate in which way the data become less accessible for interpretation. We consider two sight lines which contribute to one total spectrum by equal amounts. The absorption structure of the H2 lines on these lines of sight has been chosen to be different, one has a H2 column density of cm-2, the other has cm-2. Consequently, the lines in one spectrum are much weaker (if not even ‘absent’), and the light of that star blends some of the absorption present in the other spectrum. Clearly, the equivalent widths derived from the sum spectrum have been altered compared to those of the single spectra.
Column densities determined from lines in the linear part of the curve of growth are the weighted mean of the column densities on the individual sight-lines. If lines in the damping part of the curve of growth are added, the measured column density is proportional to
| (1) |
This is less or equal to
| (2) |
the weighted mean of the individual column densities, where are the equivalent widths in the individual spectra and are the weights. In the logarithmic part of the curve, where the equivalent widths depend strongly on the -value the measured column densities are again another kind of mean value. The situation is even more complicated if line profiles from different parts of the curve of growth are mixed.
| NGC 588 | NGC 592 | NGC 595 | NGC 604 | |||
|---|---|---|---|---|---|---|
| A | B | A | B | |||
| [km s-1] | ||||||
| Fe ii | ||||||
| Ar i | ||||||
| O i | ||||||
| H2 | – | |||||
We illustrate the effects of the considered case in Fig. 5. From this simple example, considering the resulting optical depth relation (see Fig. 5 c), we conclude that column densities can be derived from the Fuse M~33 H ii region spectra only in an approximate manner. In particular, a single -value cannot be used to interpret the absorption line strengths (as visible in Fig. 5 c).
3.3 Extinction
If the dust abundance in front of a cluster is spatially inhomogenous, a selection effect has to be considered for the interpretation of measured column densities. In general the dust abundance is correlated with the column density of the gaseous ISM. Sight lines with higher gas column densities have a higher colour-excess, reducing the far UV flux in the spectra and thus lowering the weight in the sum of spectra. Therefore, column densities measured in the composite spectrum of a cluster can be expected to be lower than the actual (un-weighted) average column densities towards the cluster. Because the abundance of H2 is correlated with dust (see Savage et al. savage (1977), Richter richter00 (2000), Tumlinson et al. tumlinson (2002)), sight lines with high H2 column densities are also expected to be suppressed in the composite spectrum.
4 Results
4.1 Column densities
4.1.1 Molecular hydrogen
Despite the systematic errors described in Sect. 3 we use single cloud curves of growth for column density estimates because the present data do not allow a more detailed modelling. For each rotational level the measured equivalent widths form a set of data points with unknown position on the axis. These sets are shifted along this axis in order to fit a single-cloud curve of growth.
In the present case the range in covered by each set of data points is small and the uncertainties in the equivalent widths are large. Thus the ranges of possible -values and column densities are substantial.
As mentioned in Sect. 3.2, in the case of a multiple background source, column densities derived from the damping part are systematically lower than the weighted mean of column densities for the individual sight lines. Thus the upper limits are not as rigid as they would be for a single sight line.
4.1.2 Metals
The curve of growth method was also used to obtain Fe ii and Ar i column densities. The results, especially for Fe ii, can be assumed to be more reliable than those for H2. Due to the usually higher - values in the warm neutral medium and the large range of - values of accessible Fe ii lines some data points lie on the linear part of the curve of growth (see Fig. 4). Fe ii and Ar i are the predominant ionization states of Fe and Ar in the neutral interstellar medium. The cosmic abundance ratio is (Fe/Ar). According to Sofia & Jenkins (sofia (1998)) argon is unlikely to be bound to dust in clouds that are thin enough to be observed in absorption. In partially ionized clouds, significant amounts of argon can be ionized due to its large ionization cross section although its ionization energy lies above that of hydrogen. Sofia & Jenkins (sofia (1998)) measured Ar i depletions between and on Galactic sight lines. Therefore, in general, the Fe/Ar ratio will yield an estimate for the iron depletion that is too low.
The degree of ionization of oxygen is coupled to that of hydrogen due to charge exchange reactions. Thus it would be desirable to know O i column densities, which then could be converted into H i column densities provided the metallicity is known. Unfortunately the Å line of O i is affected by blending with H2 lines and emission features and lies in the flat part of the curve of growth. We have included a plot of this line in Fig. 2, but do not analyse it. Only the spectrum of NGC~604 has a sufficient count rate below 1000 Å for a measurement of the O i line at 976 Å.
Metal column densities are given in Table 2.
4.2 Velocities
Because of the possible apparent velocity shifts induced by multiple background sources, and the variations in the alignment of the optical channels of Fuse we measured only velocity differences between Galactic and M~33 absorption components. Noise and continuum uncertainties limit the precision to about km s-1.
Using data from the Leiden - Dwingeloo - Survey (Hartmann & Burton hartburt (1997)), the velocity of the Galactic H i in the direction of M~33 can be determined. We fit km s-1 and convert the measured Fuse velocities to LSR velocities.
We compared emission line data (CO, H i, H ii or other ions) from the literature with the Fuse absorption line data to get hints on the location of the absorbing gas relative to the H ii regions and the M~33 disk. Velocities of H i 21 cm emission are taken from Rogstad et al. (rogstad (1976)) who found two disk components, a “main” and a more patchy “weak” one. These H i “main component” velocities are in agreement with velocities extracted from the work of Deul & van der Hulst (deul (1987)) based on observations with a 5 to 10 times higher angular resolution. Notably, no “weak component” shows up in the Deul & van der Hulst data at the positions of the H ii regions. This may be due the patchiness of that component or to lower sensitivity of the higher resolution data.
| NGC 588 | km s-1 | km s-1 | km s-1 | |
|---|---|---|---|---|
| 0 | 16.1 | |||
| 1 | 16.4 | |||
| 2 | 15.6 | |||
| 3 | 15.0 | |||
| 4 | 14.9 | |||
| 5 | 14.6 | |||
| 6 | 14.5 | |||
| 7 | 13.7 | |||
| NGC 592 | km s-1 | km s-1 | km s-1 | |
| 0 | 17.1 | |||
| 1 | 16.9 | |||
| 2 | 16.4 | |||
| 3 | 15.4 | |||
| 4 | 15.2 | |||
| 5 | 15.0 | |||
| 6 | 14.7 | |||
| 7 | 14.8 | |||
| NGC 595 | km s-1 | km s-1 | km s-1 | |
| 0 | 17.0 | |||
| 1 | 16.9 | |||
| 2 | 16.5 | |||
| 3 | 15.1 | |||
| 4 | 14.9 | |||
| 5 | 15.1 | |||
| 6 | 15.5 | |||
| 7 | 14.8 | |||
| NGC 604 | km s-1 | |||
| 0 | ||||
| 1 | ||||
| 2 | ||||
| 3 | ||||
| 4 | ||||
| 5 | ||||
| 6 | ||||
| 7 | ||||
4.3 Comments on the sight lines
4.3.1 NGC~588
One M~33 velocity component is detected in absorption by metals and H2 in this direction. However further components could be hidden due to the limited resolution and the noise. The radial velocity of km s-1 is about the same as that of the weak H i component seen in emission. The velocity of the main H i component ( km s-1) is more similar to that of the emitting gas in the H ii region ( km s-1, see O’Dell & Townsley odell (1988)). The column densities of Fe ii and Ar i indicate some depletion of iron and thus the presence of dust.
4.3.2 NGC 592
For this H ii region no emission line results are available. The smoothed H i velocity maps give about and km s-1 for the “main” and the “weak” component, respectively. The Fuse absorption velocities of and km s-1 are closer to the velocity of the “weak component”, but km s-1 is also consistent with the main H i component velocity. H2 is found only in the km s-1 component.
4.3.3 NGC~595
An absorption component at km s-1 is detected in metal and H2 lines. Absorption lines by higher rotational levels () are possibly shifted to more negative velocities by or km s-1. Despite the rather high “best guess” value for the H2 column density, the Fe ii to Ar i ratio points to mild depletion and relatively low dust abundance. CO emission observations by Wilson & Scoville (wilsco (1992)) revealed the existence of two molecular clouds ( km s-1 and km s-1) south of the cluster but within the region covered by the Fuse aperture. However, clouds detectable in CO emission normally have so much dust that UV star light from behind should not get through. So our data do not refer to such dense and opaque gas.
The velocity of the main H i emission component is km s-1, that of the “weak” H i component is km s-1. Possibly the km s-1 component dominates in H2 and metals while in the km s-1 component the higher -levels of H2 contribute more (see, e.g., the similar case of HD 5980 in the SMC; Richter et al. richter98 (1998)).
4.3.4 NGC~604
Two absorption components are found in metal lines: a strong one at km s-1 and a weaker one at km s-1. The velocity of the first one is consistent with the velocity of the main H i emission component ( km s-1), while the velocities of the weaker absorption component and the weak H i emission component ( km s-1) do not match.
No absorption by H2 at M~33 velocities is present, although Wilson & Scoville (wilsco (1992)) detected CO emission south-east of the area covered by the Fuse aperture at a velocity of km s-1. The LSR velocity of the H ii region is km s-1 (O’Dell & Townsley odell (1988)), similar to that of CO shifted about km s-1 compared to the main H i emission component.
The comparatively high count rate in this spectrum allows the determination of a relatively rigid upper limit for the H2 column density. The non-detection of H2 in absorption is consistent with the measured Fe ii and Ar i column densities (see Table 2). In both velocity components the abundances do not indicate any depletion. For component A it was possible to measure the O i line at 976 Å. The O i to Fe ii ratio is consistent with a cosmic abundance ratio and no depletion of iron.
5 Discussion
5.1 H2 or no H2
The results for NGC~588, NGC~592, and NGC~595 are very similar: almost identical Fe ii column densities, (Fe ii/(Ar i) between 0.3 and 0.7, indicating moderate iron depletion, and radial velocities consistent with the “weak” H i component and differing from the main disk component.
The velocity difference between the H2 detected in absorption and the emission from the H ii regions and the molecular clouds in their vicinity indicates that the observed diffuse H2 is probably not located near the H ii regions. Towards NGC~604 the velocity of the main absorption component is consistent with the velocity of the main H i emission component. While the iron column density is about the same as towards the other targets, no H2 is found on this sight line.
For NGC~595 and NGC~604 photometric results have been published. Wilson & Matthews (wilma (1995)) give for NGC~604 and for NGC~595, based on Palomar 60 inch data. They state that the colour magnitude diagrams suggest the presence of “significantly more differential reddening in NGC~604 than in NGC~595”. From HST observations of NGC~595 Malumuth et al. (malumuth (1996)) find . We conclude that the average dust abundance towards both clusters is comparable, with a considerable scatter which is probably larger towards NGC~604. Thus the extinction-effect discussed in Sect. 3.3 is heavily influencing the apparent H2 column densities in front of the clusters.
As the Galactic and Magellanic H2 surveys show (Savage et al. savage (1977), Tumlinson et al. tumlinson (2002)), on sight lines with an of 0.2 or larger H2 column densities between and cm-2 are common. Though most of the towards NGC~595 is supposed to originate in M~33 (Galactic , see Burstein & Heiles buhei (1982)), the estimated H2 column density ( cm-2) is rather low. There is no sign of lines from or lying in the damping part of the curve of growth as it would be expected for high column densities. A rough estimate of the of the FUV brightest stars in NGC~595 based on the results published by Malumuth et al. (malumuth (1996)) yields a value of about 0.1. For a colour excess like this an H2 column density of cm-2 is realistic.
The photometric data for NGC~604 are not that detailed as for NGC~595 but it is likely that the extinction selection effect is even more significant. If the scatter in extinction is indeed larger towards NGC~604, it is probable that there are some almost unreddened stars which outshine the rest of the cluster in the far UV. Independent of the actual average column density of H2 in front of the cluster, the few sight lines with negligible amounts of dust or H2 will dominate the UV spectrum and thus lead to a non-detection of H2.
Our results make clear that it is difficult to get precise quantitative information from absorption spectroscopy of extended or multiple background sources using a large spectrograph aperture.
5.2 The bottom line
For the first time diffuse molecular hydrogen has been detected in absorption in a local group galaxy farther away than the Magellanic Clouds. Since star formation is going on in M~33 and molecular clouds had been detected in emission by CO and excited H2, the presence of diffuse H2 is not unexpected. The estimated column densities are similar to those found for Milky Way and LMC along low-extinction sight lines.
More reliable data of other sight lines are desirable to investigate the physical conditions in the diffuse interstellar medium of M~33, especially parameters like radiation field and H2 formation rate. So far, 10 bright OB stars in M~33 have been observed with Fuse. Maybe in at least some of these lines of sight fewer stars lie in the field of view than in the data analysed here. Also, future work with the smaller MDRS or HIRS apertures of Fuse may alleviate the extinction-selection problem encountered with the current data.
Acknowledgements.
H.B. is supported by the GK The Magellanic Clouds and other dwarf galaxies (DFG GRK 118). O.M. was supported by grant Bo 779/24 from the Deutsche Forschungsgemeinschaft (DFG), P.R. is supported by the Deutsche Forschungsgemeinschaft, B.P.W. was partially supported by NASA grant NAG5-9024.References
- (1) Andrews, S.M., Meyer, D.M., & Lauroesch, J.T., 2001, ApJ, 552, L73
- (2) Black, J.H., & Dalgarno, A., 1973, ApJ 184, L101
- (3) Black, J.H., & Dalgarno A., 1976, ApJ, 203, 132
- (4) Blitz, L., 1985, ApJ, 296, 481
- (5) Burstein, D., & Heiles, C., 1982, AJ, 87, 1165
- (6) de Boer, K.S., Richter, P., Bomans, D.J., et al., 1998, A&A, 338, L5
- (7) Deul, E.R., & van der Hulst, J.M., 1987, A&AS, 67, 509
- (8) Gómez de Castro, A.I., Sanz, L., & Beckman J., 2000, Ap&SS, 272, 15
- (9) Hartmann, D., & Burton, W.B., 1997, Atlas of Galactic neutral hydrogen (Cambridge University Press)
- (10) Malumuth, E.M., Waller, W.H., & Parker, J.W., 1996, AJ, 111, 1128
- (11) Moos, H.W., Cash, W.C., Cowie, L.L., et al., 2000, ApJ, 538, L1
- (12) O’Dell, C.R., & Townsley, L.K., 1988, A&A, 198, 283
- (13) Richter, P., Widmann, H., de Boer, K.S., et al., 1998, A&A, 338, L9
- (14) Richter, P., 2000, A&A, 359, 1111
- (15) Rogstad, D.H., Wright, M.C.H., & Lockhart, I.A., 1976, ApJ, 204, 703
- (16) Sahnow, D.J., Moos, H.W., Ake, T.B., et al., 2000, ApJ 538, L7
- (17) Savage, B.D., Bohlin, R.C., Drake, J.F., & Budich, W., 1977, ApJ, 216, 291
- (18) Sofia, U.J., & Jenkins, E.B., 1998, ApJ, 499, 951
- (19) Tumlinson, J., Shull, J.M., Rachford, B.L., et al., 2002, ApJ, 566, 857
- (20) Wakker, B.P., Savage, B.D., Sembach, K.R., et al., 2002, ApJS in press
- (21) Willner, S.P., & Nelson-Patel, K., 2002, ApJ, 568, 679
- (22) Wilson, C.D., & Scoville N., 1992, ApJ, 385, 512
- (23) Wilson, C.D., & Matthews, B.C., 1995, ApJ, 455, 125