Does IRAS 16293–2422 contain a hot core? New interferometric results
Abstract
High angular resolution H2CO line observations have been carried out for the low mass proto-binary star IRAS 16293–2422 using the OVRO millimeter array. Simultaneous continuum observations reveal that the source most probably contains two accretion disks, less than AU in size, through which matter is fed onto the stars. The observations suggest that the binary has cleared most of the material in the inner part of the envelope, out to the binary separation. The H2CO interferometer observations indicate the presence of large scale rotation roughly perpendicular to the large scale CO outflow associated with this source. The H2CO emission is dominated by the compact dense and hot ( K) gas close to the positions of the continuum peaks.
keywords:
ISM: molecules – ISM: abundances – stars: formation – astrochemistry1 Introduction
Recent studies (Jørgensen et al. 2002; Schöier et al. 2002; Shirley et al. 2002) have suggested that the inner envelopes of low-mass protostars are dense ( cm-3) and warm ( K), as would be expected from scaling of high-mass protostars (Ceccarelli et al. 1996; Ivezić & Elitzur 1997). Detailed modelling of multi-transition single-dish observations towards the deeply embedded low mass protostellar object IRAS 16293–2422 (Ceccarelli et al. 2000; Schöier et al. 2002) shows that the abundances of some molecules, e.g. H2CO and CH3OH, are drastically increased in the warm and dense inner region of the circumstellar envelope. The location where this increase occurs is consistent with the radius at which ices are expected to thermally evaporate off the grains ( K). However, the small spatial scale of the region of hot gas ( AU) and the infalling nature of the envelope lead to very different chemical time scales between low mass and high mass hot cores, which may prevent production of second-generation complex molecules in low mass protostars. Also, shocks are thought to be relatively more important in low mass protostars. High angular resolution observations are needed to pinpoint the origin of the abundance enhancements and possibly distinguish these two scenarios. We present here observations of H2CO at 1 mm using the Owens Valley Radio Observatory (OVRO) millimeter array at resolution. The line ratio of the two H2CO lines observed is a measure of the gas temperature.
2 Observations and data reduction
IRAS 16293–2422 was observed using the OVRO millimeter array between September 2000 and March 2002. The continuum emission at 1.37 mm was obtained simultaneously with the H2CO and line emission at 218.222 and 218.475 GHz, respectively. \objectIRAS 16293–2422 was observed in the L and E configurations. The natural weighted continuum observations has a 1 noise of about 20 mJy beam-1 with a beam size of 3919.
3 Results and discussion
3.1 Continuum emission
In Fig. 1 the 221.7 GHz (1.37 mm) continuum emission observed toward IRAS 16293–2422 is presented. As expected for this proto-binary star, two continuum sources are detected, separated by approximately with faint extended emission also present. The total observed continuum flux density at 1.37 mm is about 3.5 Jy. This is roughly 50% of the flux obtained by Walker et al. (1990) from mapping with a single dish telescope, indicating that the interferometer resolves out some of the emission. The positions of the continuum sources are consistent with the two 3 mm sources MM1 (southeast) and MM2 (northwest) found by Mundy et al. (1992). At the distance of IRAS 16293–2422 (160 pc) the projected separation of the sources is about AU. The sources are unresolved and the fitted sizes in the -plane of MM1 and MM2 provide upper limits to the sizes of these disks of AU in diameter. The total fluxes estimated for the compact components MM1 and MM2 are 0.7 Jy and 1.1 Jy, respectively. The remaining 1.7 Jy of emission is attributed to the contribution from an extended circumbinary envelope. Assuming the emission to be optically thin and adopting a dust temperature of 40 K sets lower limits to the masses of 0.25 and 0.4 M⊙, respectively.
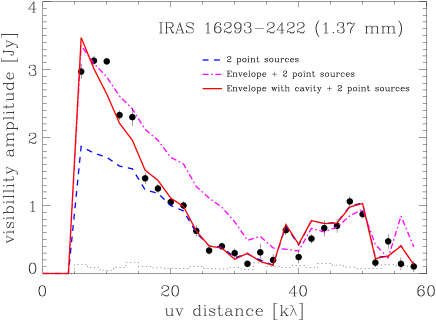
Schöier et al. (2002) determined the circumstellar structure of IRAS 16293–2422 from detailed modelling of the observed continuum emission. In addition to the SED, resolved images at 450 and 850 m obtained with the SCUBA bolometer array at the JCMT were used to constrain the large scale envelope structure. In order to investigate if the brightness distribution at 1.37 mm from the envelope model is consistent with the flux picked up by the interferometer, the same sampling was applied to the model output. Furthermore, the interferometer data constrain the envelope structure at smaller scales () than the JCMT single-dish data (). In Fig. 2 the visibility amplitudes of the observed emission are compared to the model predictions. Fitting just two compact sources underestimates the flux at small baselines, indicating additional large scale emission. Addition of the best fit envelope model of Schöier et al. (2002) produces the correct amount of flux at the smaller baselines but provides too much emission at intermediate baselines (), i.e., at scales of the binary separation. It is found that an envelope model that is void of material on scales smaller than the binary separation best reproduces the observed visibilities. The emission from the two unresolved components, possibly accretion disks, is estimated to contribute % to the total flux at 1.37 mm.
3.2 Molecular line emission
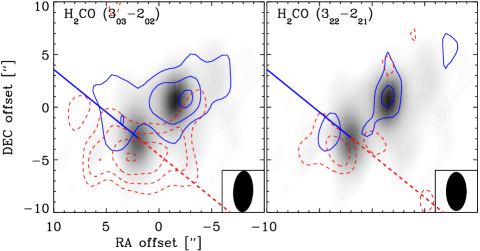
The observed H2CO ( and ) line emission obtained at OVRO is shown in Fig. 1. The emission is clearly resolved and shows a separation between the red ( km s-1) and blue ( km s-1) emission peaks. The direction of the red-blue asymmetry is roughly perpendicular to the large scale CO outflow associated with MM1 (Walker et al. 1988) and is indicative of an overall rotation of the material encompassing both MM1 and MM2. The emission from both lines peaks close to the positions of MM1 and MM2. The ()/() line ratio is sensitive to the temperature of the emitting gas (e.g., van Dishoeck et al. 1995), and is close to the positions of MM1 and MM2 indicating hot ( K) gas. Single-dish observations (van Dishoeck et al. 1995; Schöier et al. 2003, in prep.) show that the H2CO line emission is extended to scales of . Also, the large scale ()/() line ratio is , much lower than for the interferometer data, suggesting that a cold ( K) component dominates the single-dish flux.
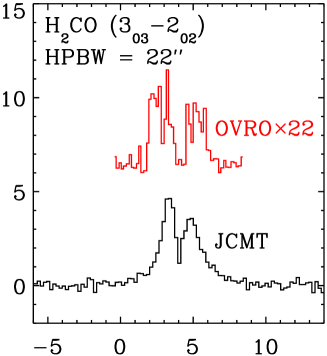
Care has to be taken when interpreting the interferometer maps due to the low sensitivity to weak large scale emission. A direct comparison between the single-dish spectrum and that obtained from the interferometer observations restored with the single-dish beam is shown in Fig. 3. The interferometer picks up only % of the single dish flux, suggesting that the extended cold material is resolved out by the interferometer and that a hotter compact component is predominantly picked up. This is to be expected from the ‘jump models’ introduced by Schöier et al. (2002) where a steep gradient in abundance needed to be introduced, for a number of molecular species including H2CO, in order to model emission lines probing a wide range of excitation conditions. Simulations where the sampling from the observations has been applied to the best fit H2CO models from Schöier et al. (2002) with and without a jump in the abundance show that the ‘hot core’ component dominates the flux as seen by the interferometer (%).
4 Summary and outlook
Interferometric continuum observations suggest that the inner parts of the circumbinary envelope around IRAS 16293–2422 is relatively void of material on scales smaller than the binary separation (). The simultaneous H2CO line observations indicate presence of hot and dense gas close to the peak positions of the continuum emission consistent with thermal evaporation of ices in ‘hot core’ regions close to the protostars. Based on the morphology and line widths little of the observed interferometric emission is thought to be associated with the known outflow(s) associated with this source.
Additional interferometric data have been obtained for IRAS 16293–2422 in a wide range of lines including C18O, CH3OH, HCN, N2H+ and SiO, that will provide additional constraints on the physical and chemical structure in the circumstellar envelope. Whatever their precise origin, the molecules located in the inner envelope of \objectIRAS 16293–2422 can be incorporated into the growing circumstellar disk(s) and become part of the material from which planetary bodies are formed.
Acknowledgements.
This research was supported by the Netherlands Organization for Scientific Research (NWO) grant 614.041.004, the Netherlands Research School for Astronomy (NOVA) and a NWO Spinoza grant. OVRO observations were supported by the National Science Foundation, grant AST-9981546.References
- [Ceccarelli et al.(1996)Ceccarelli, Hollenbach, & Tielens] Ceccarelli, C., Hollenbach, D. J., & Tielens, A. G. G. M. 1996, ApJ 471, 400
- [Ceccarelli et al.(2000)Ceccarelli, Loinard, Castets, Tielens, & Caux] Ceccarelli, C., Loinard, L., Castets, A., Tielens, A. G. G. M., & Caux, E. 2000, A&A 357, L9
- [Ivezić & Elitzur(1997)] Ivezić, Ž. & Elitzur, M. 1997, MNRAS 287, 799
- [Jørgensen et al.(2002)Jørgensen, Schöier, & van Dishoeck] Jørgensen, J. K., Schöier, F. L., & van Dishoeck, E. F. 2002, A&A 389, 908
- [Mundy et al.(1992)Mundy, Wootten, Wilking, Blake, & Sargent] Mundy, L. G., Wootten, A., Wilking, B. A., Blake, G. A., & Sargent, A. I. 1992, ApJ 385, 306
- [Schöier et al.(2002)Schöier, Jørgensen, van Dishoeck, & Blake] Schöier, F. L., Jørgensen, J. K., van Dishoeck, E. F., & Blake, G. A. 2002, A&A 390, 1001
- [Shirley et al.(2002)Shirley, Evans, & Rawlings] Shirley, Y. L., Evans, N. J., & Rawlings, J. M. C. 2002, ApJ 575, 337
- [van Dishoeck et al.(1995)van Dishoeck, Blake, Jansen, & Groesbeck] van Dishoeck, E. F., Blake, G. A., Jansen, D. J., & Groesbeck, T. D. 1995, ApJ 447, 760
- [Walker et al.(1988)Walker, Lada, Young, & Margulis] Walker, C. K., Lada, C. J., Young, E. T., & Margulis, M. 1988, ApJ 332, 335
- [Walker et al.(1990)Walker, Adams, & Lada] Walker, C. K., Adams, F. C., & Lada, C. J. 1990, ApJ 349, 515