11email: kataoka@hp.phys.titech.ac.jp 22institutetext: Institute of Space and Astronautical Science, Sagamihara, Kanagawa, Japan 33institutetext: Laboratory for High Energy Astrophysics, NASA/GSFC, Greenbelt, MD, USA 44institutetext: Department of Earth and Space Science, Osaka University, Osaka, Japan 55institutetext: Landessternwarte Heidelberg, Königstuhl, Heidelberg, Germany
Detection of Hotspot and Knots of 3C 303
We report the detection at X-rays of the radio/optical hotspot and knots of 3C 303 from a short (15 ksec) exposure in 2001 March. The X-ray morphology is similar to that of the radio/optical emission with peaks in the X-ray emission found at 5.5′′(knot B), 9′′ (knot C) and 17′′ (hotspot) from the core of 3C 303. Despite the limited signal-to-noise ratio of the short exposure, the X-ray photon spectrum was measured for the hotspot. We construct the spectral energy distribution (SED) and find that the X-ray flux is well below the extrapolation of the radio-to-optical continuum, which we interpret as resulting from the production of X-rays via inverse Compton scattering of both synchrotron photons (SSC) and cosmic microwave background photons (EC/CMB). The magnetic field strength, region size, and the maximum energy of electrons are self-consistently determined for the hotspot to be 4.3 G, 6.51021 cm, and 1.4107. This implies a magnetic field strength a factor of 30 below the equipartition value; 150 G. The origin of this large departure from equipartition is still uncertain, but the discrepancy is reduced if the plasma in the hotspot is moving with mildly relativistic speeds. Our observation of 3C 303, as well as recent detections of large scale jets and hotspots in a number of radio galaxies, confirm that particles are accelerated very efficiently in radio galaxies.
Key Words.:
galaxies: active – galaxies: individual (3C 303) – galaxies: jets – X-rays: galaxies1 Introduction
It is generally believed that the vast bulk of cosmic-ray nuclei and electrons up to 1015 eV are accelerated in the shock waves of supernova remnants (SNR). There has been dramatic confirmation of this idea with the detection of three SNRs as sources of 100 TeV particles, both in the X-ray and TeV -ray bands; SN 1006 (Koyama et al. 1995; Tanimori et al. 1998), RXJ 1713.73946 (Koyama et al. 1997; Muraishi et al. 2000; Enomoto et al. 2002) and Cassiopeia A (Hughes et al. 2000; Aharonian et al. 2001), although it is still a mystery why only three of more than 200 known SNRs are TeV -ray emitters. However, the cosmic ray spectrum extends well beyond 1015 eV, and so more powerful particle accelerators must exist in the universe. From the theory of Fermi acceleration, the maximum energy of electrons/ions is proportional to the system size ; [TeV] 103 [pc] [G] (Hillas 1984). Thus the the location of strong shocks and more extended structures than SNRs can potentially accelerate particles above 100 TeV. The large scale jets and lobes in extragalactic sources are good candidates for such acceleration sites (e.g., Hillas 1984; Gaisser 2000).
Jets are commonly observed in the radio galaxies, representing outflows that are well collimated on scales of tens to hundreds of kiloparsecs (kpc). In spite of a long history of study, however, the processes by which the jets are formed and collimated are still far from being understood. Detailed spatial imaging can potentially trace the energy transport from the vicinity of the central black hole to the outer jet region, but observations with high spatial resolution () have until recently only been possible at radio and optical wavelengths. Observations of jets at shorter wavelengths are extremely important because they can probe the sites of higher energy particle acceleration. Until the advent of , nonthermal X-ray emission had been detected from only a few kpc-scale jets by and (e.g., Biretta, Stern & Harris 1991; Röser et al. 2000). Marginal X-ray detections were reported also for the hotspots in which the jets are believed to terminate (Harris, Carilli & Perley 1994; Harris, Leighly and Leahy 1998;).
The X-ray Observatory has now resolved the X-ray spatial structure along jets, from kpc to Mpc, of more than a dozen of radio galaxies and quasars; e.g., PKS 0637752 (Schwartz et al. 2000; Chartas et al. 2000), M 87 (Marshall et al. 2002; Wilson & Yang 2002), 3C 273 (Sambruna et al. 2001), and Cen A (Kraft et al. 2002). These observations have established that X-ray emission from large scale jets is more common than had been expected. X-rays have also been detected clearly from a number of lobes and hotspots (e.g., Wilson, Young & Shopbell 2000; 2001 for Pictor A and Cygnus A; see Hardcastle et al. 2002 for a review). X-ray observations of nonthermal emission from hotspots are of particular interest to constrain the energetics and the spectrum of the relativistic electrons. For example, the presence of high energy electrons with very short radiative life-times provides direct evidence for re-acceleration in the hotspot.
3C 303 (=0.141) is an unusual double radio source with a highly asymmetrical structure. This source is classified as a broad-line radio galaxy and had been thought to be a strong X-ray “point source”. In the HRI image a faint point-like component, containing 256 counts, was found approximately coincident with the western hotspot of 3C 303 (Hardcastle & Worrall 1999). However photon statistics and image resolution were not sufficient to confirm that the X-ray detection was associated with the hotspot. In particular, it was not possible to rule out a background () QSO as the source of the X-rays (see below). In this letter, we report on the discovery of X-ray emission from the hotspot and knots of 3C 303. By combining the data from radio to X-rays, we show that radio galaxies accelerate particles to energies of 10100 TeV in the hotspot. Throughout this paper, we adopt km s-1 Mpc-1 and , so 1′′ corresponds to 2.1 kpc at the redshift of 3C 303.
2 Observation and Data Analysis
2.1 Radio, Infrared, and Optical Observations
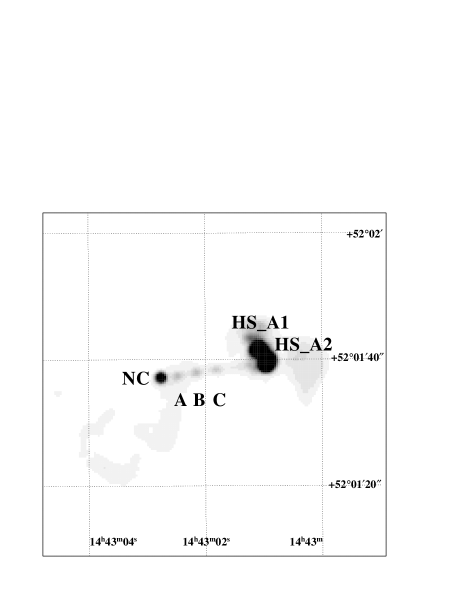
The western hotspot of 3C 303 has been well studied at radio wavelengths. A 1.5 GHz VLA image of 3C 303 is shown in Figure 1(a) (Leahy & Perley 1991). A prominent one-sided jet leads to a complex radio hotspot (Lonsdale, Hartley-Davies & Morison 1983) located at a projected distance of 17′′ (36 kpc) from the nucleus. The hotspot is actually double (components and in the 408 MHz map of Lonsdale et al. 1983), with the southern spot () being the brighter in radio images. Also, three faint jet components (knots A, B, C in Figure 1(a)) are linearly spaced between the nucleus and the hotspot. The 1.5 GHz image of Leahy and Perley (1991), made with the VLA in A and B configurations, provided the first detection of the fainter hotspot on the eastern side of the core. The fact that the eastern lobe is significantly less polarized than the western lobe was ascribed to the Laing-Garrington effect (Laing 1988; Garrington et al. 1988), confirming that the jet on the western side is directed towards us, and that the counter-jet is on the eastern side.
Recently, Giovannini et al. (2001) derived limits for the angle to the line of sight, jet speed and Doppler factor of 24 radio galaxies based on the jet–to–counter-jet ratio and core dominance. For 3C 303, they derived a Doppler beaming factor in the range by assuming a bulk Lorentz factor of = 5. They presented a single epoch 5 GHz VLBI image which shows a number of parsec-scale jet components (Figure 15 in Giovannini et al. 2001), however, as no other VLBI images have been published, it is not yet possible to determine the apparent jet speed directly.
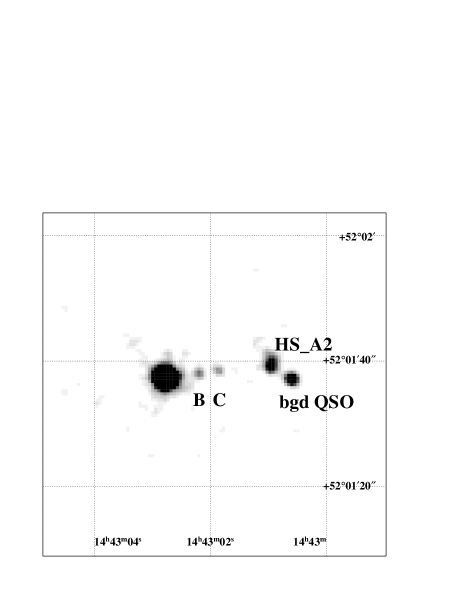
An infrared image of 3C 303 is presented in Figure 1(g) of Meisenheimer, Yates and Röser (1997). They detected a clear signal from the hotspot () and the jet which connects the nucleus with the hotspot. The background QSO, 21′′ from the nucleus and to south-west of the hotspot, identified by Kronberg (1976) was also detected.
An optical counterpart of the multiple radio hotspot was found by Lelièvre & Wlérick (1975) and Kronberg (1976). Higher resolution images were obtained by Lähteenmäki & Valtaoja (1999) using the 2.5 m Nordic Optical Telescope on La Palma in 1992 June. They showed that the total extent of the hotspot, as measured from the outermost 3 contours, is 2.3′′ 3.1′′, corresponding to a linear size of 4.96.6 kpc (without correction of broadening effect of the optical PSF and the seeing of 0.6-0.8”). The optical emission from the fainter northern hotspot () was not detected, indicating that radio-optical spectral indices are different in the two components. Considering the non-stellar structure of the image, the positional agreement, and the optical polarization, they argue that the optical candidate is a genuine counterpart to the radio hotspot () of 3C 303.
2.2 X-ray Observations
observed 3C 303 on 2001 March 23 in a guaranteed time observation. The source was at the nominal aimpoint of the Advanced CCD Imaging Spectrometer S3 chip (ACIS-S3), and the exposure was continuous for 15.10 ksec. We have analyzed archival data on 3C 303 provided by HEASARC Browse (http://heasarc.gsfc.nasa.gov/dp-perl/W3Browse/Browse.pl). The raw level-1 data were reprocessed using the latest version (CIAO 2.1) of the CXCDS software. We generated a clean data set by selecting the standard grades (0, 2, 3, 4 and 6) and energy band 0.48 keV.
The X-ray image, produced by smoothing the raw image with a Gaussian of width 0.5′′ in the energy range of 0.48 keV, is shown in Figure 1(b). X-ray emission can be clearly seen from the bright central core, the western jet knots, and the hotspot (). The total extent of the X-ray hotspot (), measured from the outermost of 3 contours in raw(un-smoothed) image, was . This is consistent with the optical extent of the hotspot, though we do not take into account the broadening of PSF ( half-energy radius, but with significant “wings” at larger scales). There is a suggestion of faint X-ray emission from the northern hotspot , but due to limited photon statistics no conclusive statement can be made. No emission was detected exceeding the background level at the location of the weak eastern hotspot seen in the Figure 15 of Leahy & Perley (1991).
The object just to the south-west of the hotspot is the background QSO at mentioned previously (72 counts; 8.5 ). Knots B and C are marginally detected at the 4.5 (20 counts) and 4.4 (19 counts) levels, respectively. The innermost knot (A in Figure 1(a)) cannot be resolved due to the contamination from the bright nucleus.
-
a
Radius (in arcsec) of a circular region to extract X-ray counts.
-
b
The best fit power-law photon index assuming a Galactic of 1.61020 cm-2.
-
c
In unit of erg cm-2 s-1.
-
d
Analysis of archival data (1995 May).
-
e
Analysis of archival data (1996 January).
The nucleus is a very bright point source, with the % photon pile-up preventing us from performing any meaningful spectral or spatial analysis of this region. As an alternative, we have analyzed archival data to determine the X-ray flux and the spectral shape of the nuclear emission. observed 3C 303 in 1995 May and 1996 January, with a 20 ksec exposure each time. The X-ray fluxes were 2.610-12 erg cm-2 s-1 in both observations (Table 1). No significant variation in the flux was detected between the two observations. Note that, due to the image resolution of , the jet, hotspot, and background QSO cannot be separated from the nucleus for the data, however, as indicated in Table 1, the contribution of these components to the nuclear flux is expected to be only . Also, the nuclear flux may have been changed between and epochs. Despite these uncertainties, the flux measured with is consistent with that expected from the piled-up fraction observed with .
In order to minimize the contamination from neighboring regions for spectral fitting, we extracted the X-ray emission from the hotspot (), knots B and C, and the background QSO, with circular regions of 3.0′′, 1.5′′, 1.5′′, and 1.5′′ radius, respectively. Approximately 95 of counts are collected with a circular region of 1.5′′ radius for a point source. Background subtractions were performed for each region, where the the background counts were accumulated at the same off-nuclear distance to the component regions.
The fitted spectra are summarized in Table 1. Errors quoted in the table correspond to 1 uncertainties for the parameter, unless otherwise stated. In each case, we assumed a power-law function absorbed by Galactic only (fixed to 1.61020 cm-2: Stark et al. 1992). The hotspot and the background QSO were adequately fitted with this model. The X-ray photon index was = 1.40.2, and the corresponding 210 keV flux was 3.710-14 erg cm-2 s-1 for the hotspot. Due to the limited photon statistics, we cannot determine the spectra shape for knots B and C. We thus fixed the spectral index to and estimated the flux. The X-ray fluxes of the knots B and C were 3.510-15 erg cm-2 s-1 and 3.510-15 erg cm-2 s-1 in 210 keV band, respectively.
For the background QSO, = 2.00.3, and the corresponding 210 keV flux was 1.610-14 erg cm-2 s-1. We remark again that although we have taken great care in reducing the data, it is impossible to eliminate the contamination of bright nucleus completely for knots B and C. Thus we mainly consider the hotspot () in the following as it was detected at high significance (92 counts; 9.6 level) and is well separated from the nucleus (17′′).
3 Discussion and Conclusion
Using a short (15 ksec) observation, we have detected the X-ray counterpart of the radio-optical hotspot () and knots B and C in the radio galaxy 3C 303. Figure 2 shows the SEDs from radio to X-ray energies of the western hotspot (). The radio-to-optical data are taken from Meisenheimer, Yates and Röser (1997). This clearly indicates that the X-ray flux obtained with is well below the extrapolation from the radio-to-optical continuum. While the radio-to-optical continuum is generally believed to be synchrotron radiation, the radiative mechanisms usually considered as the possible origin of X-rays are either synchrotron (e.g., Pesce et al. 2001; Marshall et al. 2002) or inverse Compton scattering on various possible sources of soft photons including the synchrotron photons (SSC; e.g., Hardcastle et al. 2002) and the cosmic microwave background (EC/CMB: e.g., Tavecchio et al. 2000; Sambruna et al. 2001).

Relativistic boosting appears to be necessary to explain the X-ray jet emission in the detected core-dominated radio-loud quasars. Depending on the assumptions of jet Doppler factor, different authors have reached different conclusions for the physical processes to account for the SEDs (compare, e.g., Schwartz et al. 2000 with Tavecchio et al. 2000). However, the role of Doppler boosting in the case of hotspots is still unclear. Since hotspots are where the jet is thought to be terminated, it is natural to consider that jet plasma is not beamed, or is only mildly beamed. Furthermore, a statistical analysis of samples of FR II radio galaxies implies non-relativistic velocities in the hotspots (e.g., Arshakian & Longair 2000). Taking the results of Giovannini et al. (2001) into account, we start from the assumption of a Doppler beaming factor of = 1.
Assuming a spherical geometry for the emission region, the radius of the hotspot() is set to 6.51021 cm ( 1′′; see 2) from the radio, optical, and X-ray images. By fixing and , other physical parameters and the electron population are tightly constrained. As described in the literature (e.g., Kino, Takahara & Kusunose 2002; Kataoka et al. 2002), jet parameters are closely connected with the observed quantities. The synchrotron cutoff frequency, , is given by
| (1) |
where is the magnetic field strength and is the maximum electron energy. Although the position of the synchrotron cut off is quite uncertain, we infer that it must be between optical and X-ray energy bands; Hz Hz. This leads to a condition in the plane,
| (2) |
The synchrotron luminosity is given by
| (3) |
where is the radius of the emission region, which we have set to cm. We calculate the synchrotron luminosity integrated over all frequencies using formula given by Band & Grindlay (1985). Assuming an electron population of the form = exp( /), where with the electron power law index set to = 2.7 from the radio spectral index 0.84 (Meisenheimer, Yates and Röser 1997), we obtain = 1.21043 erg s-1. Thus the synchrotron photon density is given as = 1.710-12 erg cm-3. Comparing this with the cosmic microwave background(CMB) photon energy density, = 4.110-13(1 + )4 = 6.9 10-13 erg cm-3, the synchrotron photon density is about a factor of two larger. This indicates that the dominant source of seed photons which are upscattered to the X-rays is synchrotron photons, but that CMB photons are of comparable importance.
The ratio of the synchrotron luminosity to the SSC and EC/CMB luminosities is given by
| (4) |
where is the magnetic field density ( = /8). Due to lack of -ray observations, we cannot measure Compton luminosity () accurately, however, it must be larger than the “X-ray luminosity” which is defined in the bandpass ( 4 = 9.21041 erg s-1, where is the luminosity distance to 3C 303 and is the 0.48 keV flux). This is because (i) the X-ray spectrum is still “rising” in the plane (see Figure 2) and (ii) the X-ray flux consider only a small part (0.48 keV) of overall inverse Compton emission. Considering this inequality, , the magnetic field is estimated as
| (5) |
Combining equations (2) and (5), the “allowed” region of the plane is shown as the hatched region in Figure 3. The input parameters for our model are those at the center of this region, and the resultant fit is given as solid line in Figure 2. We assume an electron population of a form = exp( /), where = 0.9 cm-3, =1.4107, and . We set the minimum Lorentz factor of electrons () to 1, and the magnetic field to = 4.3 G, respectively. Note that parameters we have chosen are valid even if the actual Compton luminosity is an order of magnitude larger, in which case equation (5) would be 8.9 G.
In Figure 3, we also show the region typical for “blazars” for comparison (adapted from Ghisellini et al. 1998; Kubo et al. 1998). Blazars are characterized by strong jet emission and the radiation is thought to be emitted from a relativistic jet directed close to our line of sight (e.g., Urry & Padovani 1995). More than 70 blazars are strong GeV and/or TeV -ray emitters, indicating that particles are accelerated very efficiently in sub-pc scale jets up to (e.g., Ghisellini et al. 1998; Kubo et al. 1998). Interestingly, our current analysis of 3C 303 implies that the hotspots of radio galaxies may be powerful particle accelerators than blazars, with particles being accelerated up to 10100 TeV.
Recent and detections of large scale jets and hotspots provide additional evidence for extremely relativistic particles in a number of radio galaxies: M87 (Wilson & Yang 2002: 107-8), 3C 390.3 (Harris, Leighly & Leahy 1998: 7.5107), and 3C 371 (Pesce et al. 2001: 4107). Similar characteristics, such as steep spectral indices and high-frequency cutoffs, have also been reported for a number of hotspots in other sources (3C 123, Pictor A, 3C 295, 3C 351; see Harris and Krawczynski 2002). Although the sample size is still small, it appears that large scale jets/hotspots in radio galaxies are an important acceleration site in the universe.
If the electrons are actually accelerated to such high energies, the electrons emitting via synchrotron in the optical band and via inverse Compton at -ray energies have relatively short lifetimes. The cooling time of electrons is
| (6) |
Assuming the parameters used to model the SED, = 1.4107 and = 4.3G, we obtain () = 7.01011 sec. In other words, the highest energy electrons can travel kpc before losing their energy. This is consistent with the size of the hotspot, but smaller than the projected distance from the nucleus (36 kpc), implying the electrons can originate from a single acceleration site in the hotspot. However considering the uncertainties in the plane, we cannot establish with this data alone that electrons entering in the hotspot actually need to be re-accelerated.

One difficulty of understanding the overall photon spectrum with the above simple picture is that the relativistic electron energy density significantly exceeds the magnetic field density ( ). For the parameters used to fit the SED (Figure 2), we expect / 1.4106, where is the minimum Lorentz factor of electrons. An equipartition magnetic field 150 G (/ 30), underproduces the X-ray flux. Such large departures from equipartition have been suggested for other X-ray hotspot sources, namely Pictor A (/ 14; Wilson, Young & Shopbell 2001) and 3C 351 (/ 12 for the northern hotspot, and 25 for the southern hotspot; Hardcastle et al. 2002).
The process responsible for the anomalously bright, flat X-ray hotspots in these sources is still an open question. Hardcastle et al. (2002) have suggested a number of possibilities, some of which may also be applicable for 3C 303 hotspots. One idea is that the hotspot is mildly beamed rather than stationary. Beaming causes the observed flux densities to change by a factor 3+α (Dermer & Schlickeiser 1993), where is the Doppler beaming factor. For an electron population with energy index , the predicted SSC flux scales as -12/(s+5) -1.6, and so Doppler dimming ( 1) increases the predicted equipartition flux. To place 3C 303 at equipartition with the beamed SSC emission, we thus require 0.01. This strongly conflicts with the range derived from radio observations, (Giovannini et al. 2001), although these limits were based in part on the properties of the parsec-scale jet, and thus it may be possible that the downstream hotspot has quite a different Doppler factor.
For the case of 3C 303 hotspot, however, considering the SSC emission alone is not sufficient because the synchrotron photon energy density only marginally dominates over the CMB photon energy density (by about a factor of two; see above). For a source in equipartition the normalization factor of the electron number density scales as (Longair 1994), where is the synchrotron comoving luminosity at a fixed frequency for a source of a given comoving volume. The equipartition magnetic field is . Combining these two equations, we obtain . The observed synchrotron luminosity at the same fixed frequency is . Using this, we obtain . Therefore, for a given observed synchrotron spectrum, as the beaming increases, the electron number density in equipartition decreases. The external Compton emission is (Dermer 1995; Georganopoulos, Kirk & Mastichiadis 2001). Substituting we obtain . Therefore, although the electron number density decreases as increases, the external Compton emission increases. Setting , for a hotspot Lorentz factor at an angle the external Compton emission is boosted by a factor of . Such hotspot Lorentz factors are routinely observed in hydrodynamic simulations (e.g., Aloy et al. 1999).
In conclusion, we suggest that for typical orientation angles of , the hotspot of 3C 303 would be closer to equipartition if it were mildly beamed, but it is not clear if beaming alone can account for the large departure from equipartition. Many theoretical models are now being developed, involving the hydrodynamic simulations and MHD calculations, to understand the physical conditions in hotspots (Aloy et al. 1999; Tregillis, Jones & Ryu 2001; Saxton et al. 2002). These numerical simulations lead to us to expect that hotspots are transient structures, and may well have different magnetic field and electrons acceleration behaviour at different times. If this is the case, it might be possible that the hotspots are being in a temporary transition state, far from equipartition.
We finally comment on the X-ray emissions from knots B and C, which may be compared to the hotspot(A2) emission. Our preliminary analysis shows that the radio flux of knots B and C at 1.5 GHz is 610-16 erg cm-2 s-1, which is about five times fainter than the corresponding X-ray fluxes (Table 1). The flux ratio between the radio and X-ray bands is almost equal to that of the hotspots A2 (/ 4). This may imply that the SED of knots B and C could be similar to that of the hotspot, although the knots are a priori more likely to be moving at relativistic speeds than hotspot A2. Unfortunately, optical detections of knots B and C have not yet been reported and so we cannot confirm this suggestion at present. Deeper and observations of radio galaxies will allow us to understand the kinematics of the jet knots hotspot and further study their likely role as one of the most efficient particle accelerators in the universe.
Acknowledgements.
We deeply appreciate the insightful comments and suggestions of the referee, M.J. Hardcastle, that have improved this paper considerably. J.K. acknowledges a Fellowship of the Japan Society for Promotion of Science for Japanese Young Scientists.References
- (1) Aharonian, F. et al. 2001, A&A, 370, 112
- (2) Aloy, M. A., Ibanez, J. M., Marti, J. M., Gomez, J.-L., & Muller, E. 1999, ApJ, 523, L125
- (3) Arshakian, T. G., & Longair, M. S. 2000, MNRAS, 311, 846
- (4) Band, D. L., & Grindlay, J. E. 1985, ApJ, 298, 128
- (5) Biretta, J. A., Stern, C. P., & Harris, D. E. 1991, AJ, 101, 1632
- (6) Chartas, G., Worrall, D. M., Birkinshaw, M. et al. 2000, ApJ, 542, 655
- (7) Dermer, C. D. 1995, ApJ 446, L63
- (8) Enomoto, R., Tanimori, T., Naito, T. et al. 2002, Nature, 416, 823
- (9) Gaisser, T. K., 2000, in AIP Conf. Ser. 558, High Energy Gamma-ray Astronomy, ed. F. A. Aharonian & H. J. Völk, 27
- (10) Garrington, S. T., Leahy, J. P., Comway, R. G., & Laing, R. A. 1988, Nat, 331, 147
- (11) Georganopoulos, M., Kirk, J. G., Mastichiadis, A., 2001, ApJ, 561, 111
- (12) Ghisellini, G., Celotti, A., Fossati, G., Maraschi, L., and Comastri, A. 1998, MNRAS, 301, 451
- (13) Giovannini, G., Cotton, W. D., Feretti, L., Lala, L., Venturi, T. 2001, ApJ, 552, 508
- (14) Hardcastle, M. J., & Worrall, D. M. 1999, MNRAS, 309, 969
- (15) Hardcastle, M. J., Birkinshaw, M., Cameron, R. A., et al. 2002, ApJ, in press (astro-ph/0208204)
- (16) Harris, D. E., Carilli, C. L., & Perley, R. A. 1994, Nat, 367, 713
- (17) Harris, D. E., Leighly, K. M., & Leahy, J. P. 1998, ApJ, 499, L149
- (18) Harris, D. E., & Krawczynski, H. 2002, ApJ, 565, 244
- (19) Hillas, A. M. 1984, ARA&A, 22, 425
- (20) Hughes, J. P., Rakowski, C. E., Burrows, D. N., & Slane, P. O. 2000, ApJ, 528, L109
- (21) Kataoka, J., Tanihata, C., Kawai, N., et al. 2002, MNRAS, 336, 932
- (22) Kino, M., Takahara, F., & Kusunose, M. 2002, ApJ, 564, 97
- (23) Koyama, K., Petre, R., Gotthelf, E. V., et al. 1995, Nat, 378, 255
- (24) Koyama, K., Kinugasa, K., Matsuzaki, K., et al. 1997, PASJ, 49, L7
- (25) Kraft, R. P., Forman, W. R., Jones, C., et al. 2002, ApJ, 569, 54
- (26) Kronberg, P. P., 1976, ApJ, 203, L47
- (27) Kubo, H., Takahashi, T., Madejski, G., et al. 1998, ApJ, 504, 693
- (28) Lähteenmäki, A. & Valtaoja, E., 1999, ApJ, 117, 1168
- (29) Laing, R. A., 1988, Nature, 331, 149
- (30) Leahy, J. P., & Perley, R. A., 1991, AJ, 102, 537
- (31) Leahy, J. P., Bridle, A. H., & Strom R. G., 1998, Internet WWW page at URL: http://www.jb.man.ac.uk/atlas
- (32) Lelièvre, G & Wlérick, G., 1975, A&A, 42, 293
- (33) Longair, M. S. 1994, High Energy Astrophysics (Cambridge Univ. Press, Cambridge)
- (34) Lonsdale, C. J., Hartley-Davies, R, & Morison, I., 1983, MNRAS, 202, 1
- (35) Marshall, H. L., Miller, B. P,, Davis, D. S., et al. 2002, ApJ, 564, 683
- (36) Meisenheimer, K., Yates, M. G., & Röser, H. -J. 1997, A&A, 325, 57
- (37) Muraishi, H., Tanimori, T., Yanagita, S., et al. 2000, A&A, 54, L57
- (38) Pesce, J. E., Sambruna, R. M., Tavecchio, F., et al. 2001, ApJ, 556, L79
- (39) Röser, H. -J., Meisenheimer, M., Neumann, M., Conway, R. G., and Perley, R. A., 2000, A&A, 360, 99
- (40) Sambruna, R. M., Urry, C. M., Tavecchio, F., et al. 2001, ApJ, 549, L161
- (41) Saxton, C. J., Sutherland, R. S., Bicknell, G. V., et al. 2002, A&A, 393, 765
- (42) Schwartz, D. A., Marshall, H. L., Lovell, J. E. J., et al. 2000, ApJ, 540, L69
- (43) Stark, A. A., Gammie, C. F., Wilson, R. W., et al. 1992, ApJS, 79, 77
- (44) Tanimori, T., Hayami, Y., Kamei, S., et al. 1998, ApJ, 497, L25
- (45) Tavecchio, F., Maraschi, L., Sambruna, R. M., and Urry, C. M. 2000, ApJ, 544, L23
- (46) Tregillis, I, L., Jones, T, W., & Ryu, D., 2001, ApJ, 557, 475
- (47) Urry, C. M., & Padovani, P. 1995, PASP, 107, 803
- (48) Wilson, A. S., Young, A. J., & Shopbell, P. L. 2000, ApJ, 544, L27
- (49) Wilson, A. S., Young, A. J., & Shopbell, P. L. 2001, ApJ, 547, 740
- (50) Wilson, A. S., & Yang, Y. 2002, ApJ, 568, 133