Refining Chandra/ACIS Subpixel Event Repositioning Using a Backside Illuminated CCD Model
Abstract
Subpixel event repositioning (SER) techniques have been demonstrated to significantly improve the already unprecedented spatial resolution of Chandra X-ray imaging with the Advanced CCD Imaging Spectrometer (ACIS). Chandra CCD SER techniques are based on the premise that the impact position of events can be refined, based on the distribution of charge among affected CCD pixels. ACIS SER models proposed thus far are restricted to corner split (3- and 4-pixel) events, and assume that such events take place at the split pixel corners. To improve the event counting statistics, we modified the ACIS SER algorithms to include 2-pixel split events and single pixel events, using refined estimates for photon impact locations. Furthermore, simulations that make use of a high-fidelity backside illuminated (BI) CCD model demonstrate that mean photon impact positions for split events are energy dependent leading to further modification of subpixel event locations according to event type and energy, for BI ACIS devices. Testing on Chandra CCD X-ray observations of the Orion Nebula Cluster indicates that these modified SER algorithms further improve the spatial resolution of Chandra/ACIS, to the extent that the spreading in the spatial distribution of photons is dominated by the High Resolution Mirror Assembly, rather than by ACIS pixelization.
1 Introduction
Shortly after its launch in 1999, the Chandra X-ray Observatory (CXO) began delivering X-ray images at exceptional spatial resolution. Now in routine operation, CXO continues to push the frontiers of X-ray astronomical imaging. When used in combination with the Advanced CCD Imaging Spectrometer (ACIS), CXO offers a potent combination of sub-arcsecond spatial resolution and moderate () spectral resolution. However, with its pixels, ACIS does not fully sample the point spread function (PSF) of the CXO High Resolution Mirror Assembly (HRMA). Therefore, in principle, there is further room for improvement in the resolving power of CXO/ACIS.
Tsunemi et al. (2001) have taken advantage of knowledge of X-ray event charge distributions among CCD pixels and the (subpixel) telescope pointing history, both of which are included as standard supporting data for an CXO observation, to generate such an improvement. Park et al. (2002) and Kastner et al. (2002) made use of the basic Tsunemi et al. (2001) method to obtain superior spatial resolution in CXO/ACIS imaging of the supernova remnant SN 1987A and of planetary nebulae, respectively. This work demonstrates the potential impact of efforts to maximize the spatial resolving power of CXO/ACIS.
Kastner et al. (2002) employed refinements to the Tsunemi et al. (2001) method that appear to better capitalize on its potential. In this paper, we fully explore these refinements, and describe additional modifications that exploit the energy resolution of ACIS.
When employed as the focal plane imaging array for CXO, ACIS collects incident X-ray photons in photon counting mode, which implicitly assumes that there is at most one photon in a subarray in one frame. ACIS registers individual incoming photons individually in an event list, which records spatial and spectral information, as well as the event grade. The grade indicates charge split morphology111An ACIS keyword, FLTGRADE, gives the charge split morphology, i.e., how many and which neighboring pixels exceed a specified split threshold. Three groups of split events, i.e. 2-pixel, 3-pixel and 4-pixel split events, have different average shifts respectively, but we do not distinguish the difference for a given group in different directions. In other words, events with FLTGRADE of 11, 22, 104 and 208 all are 4-pixel split events but split to different corners; the absolute offsets are the same for those events. in an isolated pixel island centered at the event pixel.
ACIS processing tools implemented by the Chandra X-ray Center (CXC) assume that all events have the same photon impact positions (PIPs), i.e., at the event pixel centers. However, because the charge cloud size is very small compared with the ACIS CCD pixel size (Tsunemi et al. 1999), the photon impact positions for split events will be close to the split boundaries instead of the pixel centers, offering the opportunity of subpixel event repositioning (SER) derived from the event charge distribution (grades). In addition, Chandra’s slow but intentional dither motion during a pointed observation moves the target across the detector surface, in principle allowing full sampling of the PSF of the HRMA, which otherwise would be subcritically sampled by ACIS.
Tsunemi et al. (2001) first proposed an SER algorithm; their algorithm uses corner split events only. They assume that, for 3-pixel or 4-pixel split events, the actual photon impact positions are the split corners instead of the pixel centers. So the algorithm’s implementation consists of shifting events by one-half pixel along both pixel sides towards the split corner in chip coordinates222There are three fundamental coordinate systems in CXO event list, i.e., chip coordinates, detector coordinates and sky coordinates. The conversion among them is unique. Refer to McDowell J. (2001) for detail. , then projecting the new location into the sky coordinates according to the chip orientation and the spacecraft roll angle. They also predicted that solely based on corner split events, the knowledge of photon impact positions can improve by roughly a factor of 10. They conclude that X-ray images constructed from repositioned corner split events only are almost free from degradation by the CCD pixel sampling.
However, there is a relatively small percentage of corner split events in a typical CXO observation. Tsunemi et al. (2001) and Kastner et al. (2002) note that corner split events only constitute about 4% to 16% of total events, depending on the source spectrum and CCD type employed. This is the case even for BI devices, which should generate more charge-split events than frontside-illuminated devices. Thus the improvement of spatial resolution due to the Tsunemi et al. (2001) SER algorithm is “at the cost of low efficiency” and suffers for faint sources. In addition, since the PSF of the HRMA limits the spatial resolution, the spatial resolution of Chandra would reach its maximum, i.e., be telescope limited, so long as we critically oversample the PSF, e.g., sampling at .
Mori et al. (2001) modified the Tsunemi et al. (2001) SER method by adding 2-pixel split events and single pixel events, in order to improve the statistics. Both the Tsunemi et al. and Mori et al. methods assume that all the corner split events take place precisely at the split pixel corners, while 2-pixel split events occur exactly at the centers of split boundaries. Physical CCD models (Prigozhin et al. 2002) have demonstrated, however, that corner split events can be formed even for photon impact somewhat far from the corners, where the distance is a function of photon energy. These simulations indicate that the assumed positions of split events can be refined via a physical model of the CCD-photon interaction.
2 Modifying Subpixel Event Repositioning (SER) by Expanding Event Selection Criteria
To overcome small number statistics problems and thereby improve on the SER proposed by Tsunemi et al. (2001), we want to use all 13 “viable” event grades333The grade here means FLTGRADE defined by ACIS instrument. Although there are 256 different grades, events with charge distributed over more than 4 pixels are most probably formed by noise, like cosmic rays. The 13 grades corresponding to events covering 4 pixels or less can be divided into three sub-groups, i.e., single pixel event, 2-pixel split event, and corner split event. Those 13 grades account for approximately 95% of total events for typical X-ray sources. Refer to Kastner et al. (2002) for the 13 selected grades.. Upon analysis of the ACIS simulations (see sec. 3), we found that most single pixel events occur near the pixel centers, and constrained in an area slightly smaller than an ACIS pixel. Two-pixel split events are generated by photons that are absorbed near the centers of split boundaries, while the impact positions of corner split events are limited to the smallest area, close to pixel corners. Because the charge cloud size is very small compared with ACIS pixel size, single-pixel events will have the biggest position uncertainty in both directions along pixel sides, and corner split events have the smallest uncertainty among all the events in both directions, while 2-pixel split events have relatively small uncertainty in the direction perpendicular to split boundary, and have uncertainties similar to those of single-pixel events in the direction parallel to split boundary.
Therefore, in our implementation of SER, we have modified the Tsunemi et al. (2001) model by adding 2-pixel split events and single pixel events. We assume that corner split events take place at the split corners instead of event pixel centers (as also assumed by Tsunemi et al. 2001), and 2-pixel split events occur at the centers of split boundaries, 0.366 pixel away from the pixel centers. Single pixel event PIPs remain at the event pixel centers, as we have no way to improve these PIPs based on charge distribution. The 0.366 pixel offset for 2-pixel split events was determined empirically by minimizing the PSFs of point source images in on-orbit ACIS BI CCD data (see sec. 4). We refer to this modified algorithm as “static” (energy-independent) SER. The algorithm’s schematics can be found in figure 1, in which the pixel island and assumed photon impact positions are displayed.
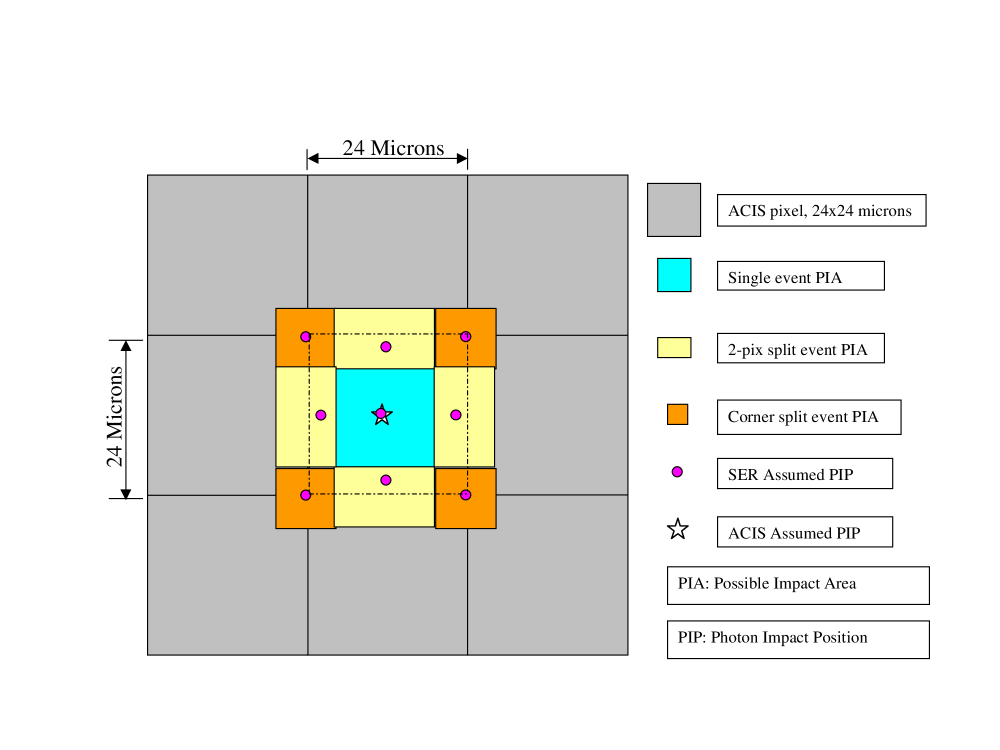
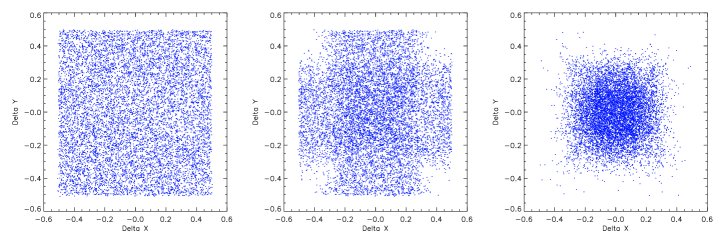
Figure 2 shows the improvement enabled by the modified SER, using the back-illuminated CCD simulated data at the energy of 1740 eV. In this three-panel plot, we show the differences between actual PIPs and various models for PIPs in chip coordinates, for all three subgroup events. The plot axes are in pixel units, i.e., 0.5 difference indicates photons interacted near the pixel boundaries. The left panel shows the difference of actual PIP with PIPs assumed to lie at event pixel centers; one can see the expected uniform random distribution within the pixel. The middle panel is the difference after corner-event-only SER correction (i.e., the Tsunemi et al. 2001 model). A big improvement for events that occur near corners can be seen. However, due to the small proportion of corner split events, there is no correction for most events, even those occurring near boundaries. The right panel shows the difference after the static SER correction. The PIP difference for the static SER model is more compact than for the Tsunemi et al. (2001) SER model, indicating that the modified PIPs are closer to their real locations. The potential for image quality improvement, using static SER, is apparent.
3 Further Modifications to SER Based on ACIS BI CCD Simulations
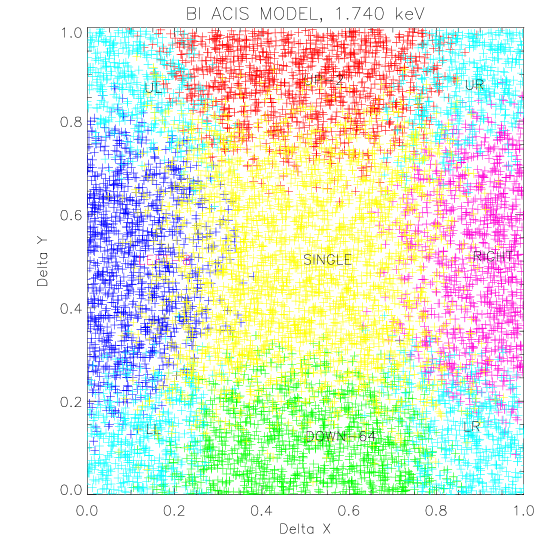
Simulations show that not all corner split events take place at the pixel corners; nor do the 2-pixel split events occur at the centers of split boundaries (figure 3). Instead, the corner split events can take place as far as 0.3 pixel away from the split corners. In addition, within a certain small area of a pixel, all three kinds of events could be generated; furthermore, the size of the area that produces specific event charge splits changes according to photon energy. Therefore the critical question for further SER modification is how best to determine the shifts for the split events. For this reason, we have used a physical model of the BI CCD (Prigozhin et al. 2002) to determine the appropriate position shifts, according to photon energies.
The simulator we used is a Monte Carlo model of a backside-illuminated ACIS CCD (CCID-17). The simulator can only be used for monochromatic simulations; the code itself randomly generates photon impact positions with subpixel accuracy and simulates where the electron clouds were formed and how the charge was spread across the pixels. The output of the simulation includes subpixel photon impact locations and the signal amplitudes in the pixels of the 3 3 event island. Thus the simulation with the BI CCD model enables us to analyze how charge is split when photon impact positions are close to boundaries.
We performed simulations consisting of 10,000 photons at each energy from 300 eV to 12 keV, with an energy step of 100 eV. Because of the attenuation-length jump at the silicon edge near 1800 eV, we lowered the energy step to 10 eV from 1800 eV to 1900 eV. For each simulation, we calculated the event grade percentages for single pixel events, 2-pixel split events, and corner split events; and the average subpixel position shifts for 2-pixel split events, 3-pixel split events, and 4-pixel split events.
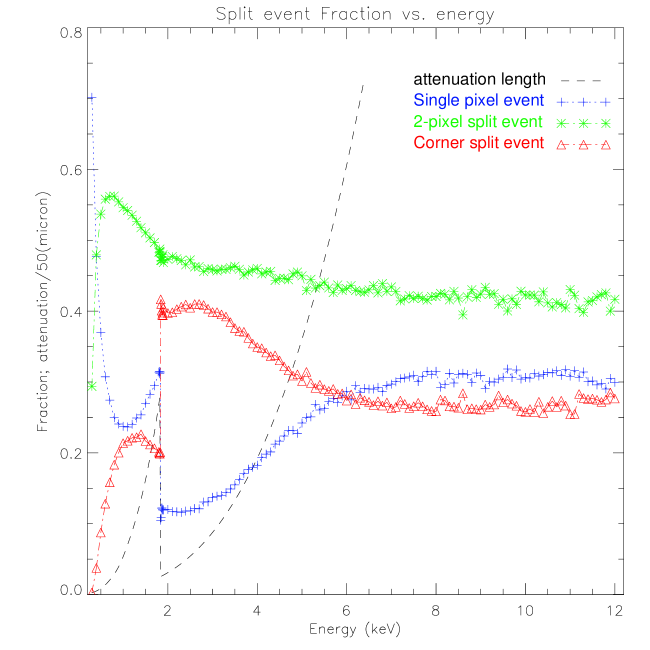
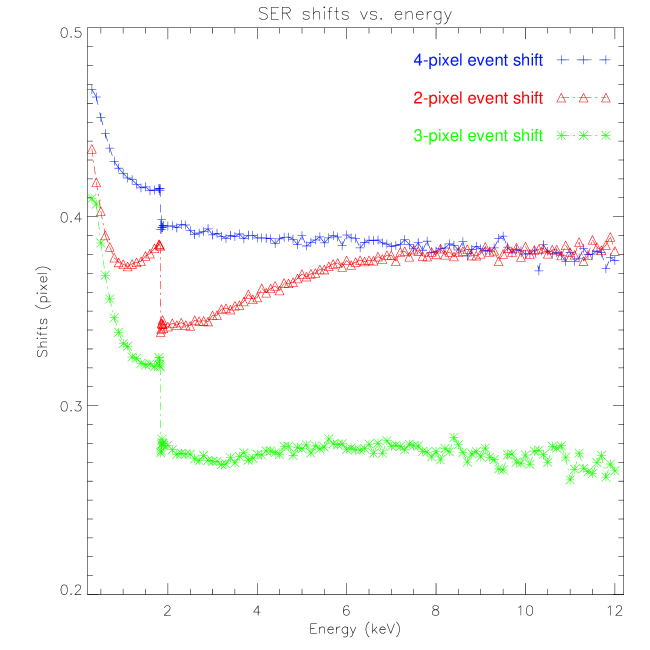
Figure 4 shows the event percentage as a function of photon energy, while figure 5 shows the mean shift in position for different split event types. Note that at low energy ( 2 keV), both subgroup event percentage and SER shifts depend sensitively on energy. The two figures clearly show the jumps at the silicon absorption edge. Above 6 keV, the 3 subgroup event percentages and PIP shifts are insensitive to energy. This can be explained by the fact that, for photons with energy exceeding 6 keV, the characteristic penetration depth becomes comparable to or larger than the thickness of the ACIS BI CCD, which is only 45 microns.
The improvement in PIP determination benefits from applying the average energy-dependent shifts for different split event groups. Based on the simulations, we calculated these average shifts for different kinds of split events. Then, we add an offset to the photon impact location in chip coordinates according to charge split morphology and photon energy. We refer to this SER modification as “energy-dependent” SER.
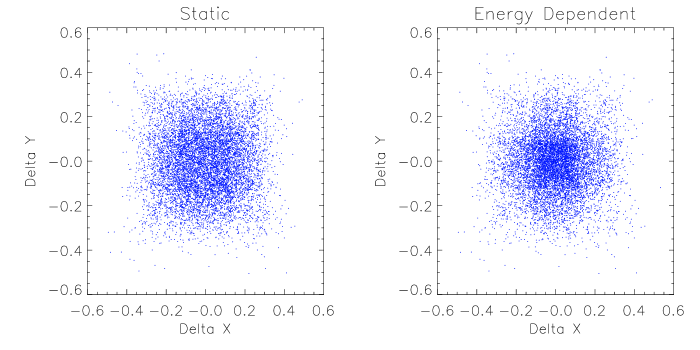
Figure 6 shows results for the static and energy-dependent SER algorithms, at an energy of 1740 eV. For comparison, we include the right-most panel in figure 2 as the left panel. The plot shows the differences between actual and calculated photon impact positions after applying SER corrections. The right panel shows the PIP differences for energy-dependent SER, i.e., by relocating events according to both event grade and energy, with shifts calculated from a look up table derived from the results illustrated in figure 5. Clearly, one can see the improvement using energy-dependent SER.
4 Application of Energy-Dependent SER
We have applied both modified SER algorithms to real Chandra/ACIS data, as an evaluation tool. The tested data is an observation of Orion Nebula Cluster (ONC) which was obtained in 1999 using the back illuminated CCD ACIS-S3 (Schulz et al. 2001). The algorithm implementation is as follows:
-
1.
Remove event position randomization that was applied by CXC standard ACIS processing.
-
2.
Filter out the 13 “viable” event grades (including single-pixel events) according to the FLTGRADE.
-
3.
From the look up table derived from results in figure 5, calculate the offset according to photon grade and energy, and add the offset in the appropriate direction(s), in chip coordinates, for every event.
-
4.
Project the new chip coordinates for relocated events444Including single-pixel events whose PIPs were not changed by SER algorithms. to sky coordinates according to the roll angle of the spacecraft and the orientation of the employed CCD.
-
5.
Reconstruct each point source from the old and new sky coordinates, fit the source with a two dimensional Gaussian function, and calculate the full width half maxima (FWHMs) before and after applying SER.
4.1 Results
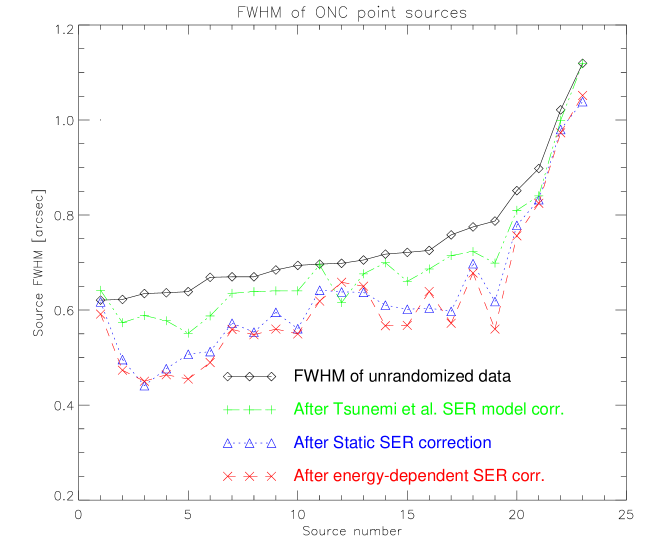
Based on the above steps, we have plotted the FWHM of 22 bright point-like sources in BI ONC data. The sources are chosen to represent range in count rate from to s-1, and in off-axis angle from to . Figure 7 and table 1 show that after applying SER algorithm to these data, all SER algorithms (sec. 3) improved the FWHM for every source (except that source 1 has no improvement after applying the Tsunemi et al. [2001] method). The abscissa axis is source number, sorted with the FWHM of original point source, before applying SER but after removing randomization. Furthermore, 17 out of 22 sources have better (smaller) FWHM for energy-dependent SER than static SER, showing that energy-dependent SER has better capability to improve Chandra/ACIS PSF function. For comparison, we include the FWHMs after applying Tsunemi et al. (2001) SER model. As expected, both modified SER algorithms demonstrate better improvement than this original model.
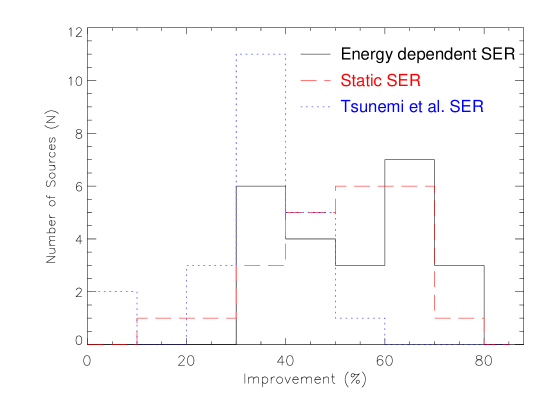
In order to evaluate the achievement of the SER algorithm, we follow Tsunemi et al. (2001) and use the FWHM of a point source to define the improvement. Assuming that and are the FWHMs of a source before and after applying SER, respectively, the improvement is defined as:
Figure 8 shows this metric of the improvement of the static and energy-dependent SER techniques. We include Tsunemi et al. (2001) model for comparison. As expected, the plot shows that most sources have superior FWHM improvement for energy-dependent SER than for static SER; only 5 of 22 display inferior improvement (figure 7). Improvements in FWHM range from 40% to 70%, for most sources, with the improvement somewhat dependent on off-axis angle, for the ONC source sample included here. There are two possible reasons why the improvements in FWHM for the energy-dependent SER, relative to static SER, are somewhat smaller than might be anticipated from the improvement in PIPs (figure 5):
-
1.
Under either modified SER method, the HRMA PSF dominates the spatial distributions of source photons. That is, CXO/ACIS images are likely telescope-limited utilizing either static or energy-dependent SER, especially at large ( 2 arcminutes) off-axis angle.
-
2.
There remain uncertainties in the CCD model, in particular, the grade branching ratios predicated by the model prevent further improvement in source FWHM, using energy-dependent SER.
We are conducting further experiments with SER-processed ACIS data obtained for the ONC, to attempt to distinguish between these possibilities.
5 Summary
We have conducted a study of potential improvements to subpixel event repositioning (SER) for CXO/ACIS data. We formulate modified SER algorithms at two levels of improvement: (1) inclusion of single-pixel events and two-pixel split events (“static” SER); (2) accounting for the mean energy dependence of differences between apparent and actual photon impact positions, based on the results of BI CCD simulations (“energy-dependent” SER).
We find that both static and energy-dependent SER produce improvements in spatial resolution over those possible using an earlier static SER algorithm employing only corner-split events (Tsunemi et al. 2001). The potential improvement in image FWHM is 50% using either of the “modified SER” algorithms described here, with energy-dependent SER producing a marginally superior result. The relatively small improvement observed for energy-dependent SER, relative to static SER, suggests that under either method, the HRMA — rather than ACIS pixelization — dominates image FWHM.
SER techniques only take into account the properties of photon charge-splitting within CCD pixels, and do not depend on the characteristics of the telescope (in particular, its PSF). Therefore, SER is applicable to both compact and extended sources (Kastner et al. 2002, Li et al. 2003). However, deconvolution methods have been developed in recent decades for optical and IR astronomical imaging, to correct for the blurring due to telescope PSF. Burrows et al. (2000) used one technique, Maximum Likelihood, to deconvolve the ACIS-S image of SN 1987A. At present, multiscale deconvolution methods are being explored, which are more suitable to process Poisson-distributed data, and therefore may be better applicable to X-ray imaging (Willett et al. 2003, Esch et al. 2003). By combining SER techniques and such multiscale deconvolution methods, one can expect the best possible spatial resolution from Chandra/ACIS imaging.
| Improvement (%) | |||||||||
|---|---|---|---|---|---|---|---|---|---|
| Source | SSNc | (arcsec) | (counts/s) | (arcsec) | Tsunemi | Static | E-Dep.g | ||
| 1 | 18.36 | 22 37.38 | 91 | 55.20 | 0.014 | 0.62 | … | 10.73 | 30.39 |
| 2 | 15.63 | 22 56.44 | 55 | 28.48 | 0.023 | 0.62 | 38.86 | 60.45 | 64.92 |
| 3 | 17.00 | 22 32.95 | 76 | 51.15 | 0.005 | 0.63 | 37.46 | 71.93 | 70.50 |
| 4 | 15.26 | 22 56.83 | 48 | 30.30 | 0.012 | 0.64 | 42.01 | 66.26 | 68.48 |
| 5 | 16.46 | 23 22.89 | C | 2.72 | 0.279 | 0.64 | 50.53 | 60.82 | 70.22 |
| 6 | 15.77 | 23 09.86 | E | 15.10 | 0.077 | 0.67 | 47.78 | 64.23 | 68.14 |
| 7 | 14.32 | 23 08.31 | 24 | 32.67 | 0.008 | 0.67 | 31.72 | 51.99 | 55.07 |
| 8 | 12.29 | 23 48.06 | 7 | 64.74 | 0.009 | 0.67 | 30.25 | 56.36 | 57.53 |
| 9 | 17.94 | 22 45.42 | 85 | 45.10 | 0.092 | 0.68 | 35.27 | 49.35 | 57.48 |
| 10 | 15.82 | 23 14.19 | A | 11.27 | 0.040 | 0.69 | 38.52 | 58.92 | 61.03 |
| 11 | 21.03 | 23 48.00 | 108 | 76.27 | 0.035 | 0.70 | 7.34 | 38.91 | 45.95 |
| 12 | 14.55 | 23 16.01 | 30 | 26.80 | 0.009 | 0.70 | 47.19 | 40.62 | 33.31 |
| 13 | 17.06 | 23 34.09 | 78 | 16.37 | 0.012 | 0.71 | 28.46 | 42.86 | 38.78 |
| 14 | 15.34 | 22 15.47 | 50 | 69.09 | 0.012 | 0.72 | 22.37 | 52.59 | 61.31 |
| 15 | 19.20 | 22 50.63 | 97 | 54.57 | 0.024 | 0.72 | 40.20 | 55.14 | 61.69 |
| 16 | … | … | … | 97.24 | 0.009 | 0.73 | 32.36 | 55.39 | 47.33 |
| 17 | 14.91 | 22 39.14 | 40 | 48.54 | 0.007 | 0.76 | 33.43 | 61.63 | 65.61 |
| 18 | … | … | … | 85.62 | 0.018 | 0.77 | 35.98 | 43.51 | 48.45 |
| 19 | 15.97 | 23 49.70 | 60 | 27.22 | 0.014 | 0.79 | 46.07 | 61.97 | 70.31 |
| 20 | … | … | … | 115.42 | 0.012 | 0.90 | 35.24 | 37.51 | 39.57 |
| 21 | … | … | … | 136.75 | 0.023 | 1.02 | 20.59 | 28.17 | 30.39 |
| 22 | … | … | … | 120.50 | 0.009 | 1.12 | 3.66 | 37.27 | 34.26 |
Notes.—
a. Right ascension for all sources is at ; values in table are in units of
seconds.
b. Declination for all sources is at ; values in table are in units of
arcminutes and arcseconds.
c. SSN stands for Schulz et al. (2001) source number.
d. = off-axis angle.
e. = source count rate.
f. is FHWM after removing randomization but before applying SER.
g. E-dep. represents result from energy-dependent SER.
References
- (1)
- (2) Burrows D., Michael E., Hwang U., McCray R. Chevalier R., Petre R., Garmire G., Holt S., Nousek J. 2000, ApJ, 543, L149
- (3)
- (4) Esch D., Karovska M. 2003, BAAS, 201, 6303
- (5)
- (6) Janesick, J.R. 2001, “Scientific Charge-Coupled Devices”, SPIE Press, p.132
- (7)
- (8) Kastner J., Li J., Vrtilek S., Gatley I., Merrill K., Soker N. 2002, ApJ, 581, 1225
- (9)
- (10) Li J., Kastner J., Schulz N., Marshall H., Prigozhin G. 2003, BAAS, 201, 5504
- (11)
- (12) McDowell J. 2001 “Coordinate Systems for Analysis of On-orbit Chandra Data, Paper I: Imaging”, CXC Internal Document,
- (13) http://cxc.harvard.edu/ciao2.1/download/doc/
- (14)
- (15) Mori K., Tsunemi H., Miyata E., Baluta C., Burrows D., Garmire G., Chartas G. 2001, in “New Century of X-ray Astronomy,” eds. H. Inoue and H. Kunieda, ASP Conf. Proc., Vol. 251, p. 576
- (16)
- (17) Park S., Burrows D., Garmire G., Nousek J., McCray R., Michael E., Zhekov S. 2002, ApJ, 567, 314
- (18)
- (19) Prigozhin G., Bautz M., Ricker G. 2003, “A Model of the Backside Illuminated Chandra CCD” , SPIE Proceedings, vol. 4851, in press
- (20)
- (21) Schulz N., Canizares C., Huenemoerder D., Kastner J., Taylor S., Bergstrom E. 2001, ApJ, 549, 441
- (22)
- (23) Tsunemi H., Hiraga J., Mori K., Yoshita K., Miyata E. 1999, Nuclear Instruments and Methods in Physics Research A 436, 32
- (24)
- (25) Tsunemi H., Mori K., Miyata E., Baluta C., Burrows D.N., Garmire G.P., Chartas G. 2001, ApJ, 554, 496
- (26)
- (27) Willett R., Nowak R., Kolaczyk E. 2003, BAAS, 201, 6301
- (28)