Ground level muons in coincidence with the solar flare of April 15, 2001.
Abstract
The counting rate of single muon tracks from the Project GRAND proportional wire chamber array is examined during the Ground Level Event (GLE) of April 15, 2001. The GLE was seen by neutron monitor stations shortly after the time of the solar X-ray flare. GRAND’s single muon data are presented and compared with neutron monitor data from Climax, Newark, and Oulu. The single muon data have mean primary hadron energies higher than those of these neutron monitor stations and so contain information about higher energy hadrons. For the single muon data for Project GRAND, the GLE is detected at a statistical significance of 6.1.
I Introduction
On April 15, 2001 the IPS Radio and Space Services website reported an X14 solar flare with a maximum X-ray intensity at 13.83 UT (8.83 hours EST or local time) [IPS Space Services, 2001]. The flare originated on the sun at coordinates S20 W85 [NOAA Space Environment Center Website, 2001] and had an X-ray intensity of W/m2 at one AU from the sun. Flares of this high intensity are rare. During the period from 1976 - 1998, only sixteen flares of magnitude X10 or greater were reported. Observations on some of these high energy flares are given in [Bieber et al., 2002], [Falcone, 1999] and [Swinson and Shea, 1990].
Data from the Project GRAND proportional wire chamber array are examined for a signal during the time of the Ground Level Event (GLE) from this flare. During the peak time of the flare, the sun was at an elevation angle of above GRAND’s local horizontal plane and an azimuth of from north. Even though the sun is near the minimum detectable elevation angle for GRAND, the Interplanetary Magnetic Field (IMF) and the magnetic field of the earth alter the direction of the protons from the sun. Charged particles from the sun follow a spiral path about the IMF (which itself curves in an Archimedes spiral about the sun) and are additionally deflected on entering the earth’s magnetic field.
Therefore the GLE associated with a particular X-ray flare should occur at a slightly later time than the X-ray event (due to the longer path length) and at a different angle than the sun, thus providing better detector acceptance even though a direct line to the sun is at a low elevation angle (see also [Munakata et al., 2001]).
GRAND detects ground level muons originating from hadronic primaries with energies above the characteristic energy of neutron monitors. The value of this characteristic energy depends upon the spectral index of the proton flux from the sun during this GLE. The energy response function of Project GRAND is discussed in more detail in Section 5. Typically, surface muon telescopes are sensitive to proton primary energies above about 4 GeV [Shea and Smart, 2002].
II Experimental Array
Project GRAND is an array of 64 proportional wire stations located at N and W at an altitude of 220 m above sea level. Each station contains four pairs of orthogonal proportional wire chamber planes; each plane of the pair has 80 wire cells 14 mm wide by 19 mm high. Each pair of planes is positioned 200 mm vertically above its neighbor. This geometrical arrangement allows for the direction of a muon track to be measured to within 0.26∘, on average, in each of two projected angles: and . The angle is measured in the xz-plane from the zenith (z) toward the east (x), is measured in the yz-plane from the zenith toward the north (y). A 50 mm thick steel plate is located above the bottom pair of PWC planes. The steel plate, in conjunction with the PWC pair of planes underneath, enables secondary muon tracks to be distinguished from those of electrons or hadrons. Each station has a total active area of 1.29 m2; the array currently collects data at a rate of 2400 muons per second.
These data are read from the 64 stations in parallel to a central data acquisition system in 70 microseconds. Eight computer nodes are used, each receiving an event (data from all 64 stations) in sequence. The node’s task is to search the 80 wires in each of 512 proportional wire planes and record the wire numbers in the eight planes of a station which had one and only one hit in each plane of that station. The eight computer nodes operating in sequence are able to conduct this search with little overall deadtime. Once a particular node has accumulated data on 900 muons in its buffer memory, the entire buffer is written to magnetic tape as a single record. Upon later off-line analysis, 96% of this recorded data turn out to fit straight tracks. A radio signal from WWVB in Boulder, Colorado provides time information with millisecond precision. This signal is used to determine the start time for the first and the last muon event in each record. These times are then recorded along with the muon data for that record on magnetic tape. Additional details on the Project GRAND detector are available on GRAND’s webpage [Project GRAND, 2001]. Other muon detectors are described, for example, in [Manakata et al., 2001] and [Duldig, 2000].
III Data Analysis
Project GRAND recorded a continuous data file on magnetic tape containing information from April 14, 2001 at 8:40 UT through April 16 at 21:30 UT, providing background information before and after the flare time. The counting rate from 14.5 hours to 24.5 hours UT was examined in 0.1 hour bins. The data file is segmented into records, each containing information on 900 muons. In order to find the time of a particular muon, the end time of the current record is compared to the end time of the previous record from that computer node; the times for each of the 900 muons is interpolated evenly within that interval. This interpolation of time should be quite adequate since the average length of a record was 3.6 seconds and thus the 0.1 hour bin size for the data is 90,000 times longer than the average time between muons.
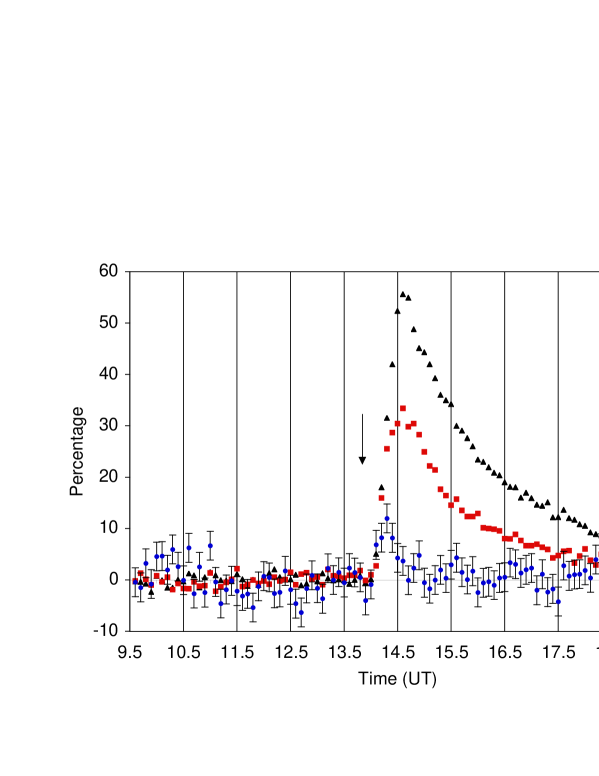
A station can turn on or off, either deliberately for miscellaneous repairs (which were not always recorded), or due to problems like, for example, high humidity coupled with a malfunctioning dehumidifier in a station. Deviations (r.m.s.) from average counting rate were measured individually for each station of the array. In order to prevent spurious individual station variations from giving a possible signal in the sum-of-all-stations, one-third of the stations with the highest individual r.m.s. deviations were eliminated from consideration leaving 39 stations (an extremely severe cut to ensure with great confidence that erratic station behavior could not cause a false signal). GRAND’s counting rate above background is shown as a function of time in Figure 1 (lower points with error bars) with the data binned in 0.1 hour intervals.
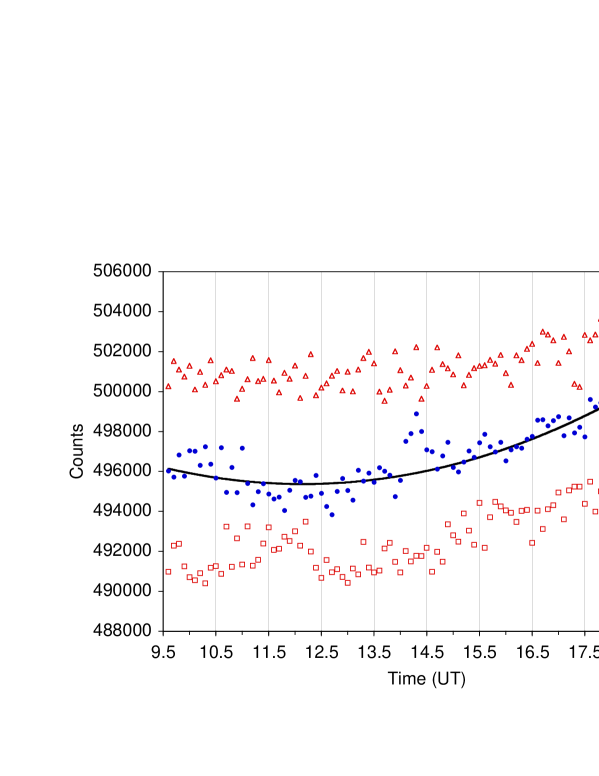
The six bins of time from 14.0 to 14.6 hours UT were used as a signal time and background bins from 9.5 to 19.5 hours UT (minus the signal time) were used. Since it is known that the muon rate depends slightly on the time of day [Poirier and D’Andrea, 2001a] (due to small solar effects in air pressure, temperature, and in the IMF), the counting rate for the background time period was fit to a curve of the form with A = 496000, B = 0.00101 and C = 0.000241 where t is time measured from 14.3 hours UT. The smallness of the B and C coefficients compared to one is a measure of the flatness of the muon counting rate during this time interval. The data as percentage above background are shown in Figure 1 with error bars.
For comparison, the data from neutron monitors at Newark for this GLE [ J. Clem and R. Pyle, 2001] and Oulu [Oulu Neutron Monitor, 2001] are also shown. The Climax neutron monitor data [C. Lopate, 2001] are almost indistinguishable from that of Newark for this GLE and, for clarity, are not shown.
GRAND’s muon data rate, although sensitive to the atmospheric pressure, has not been corrected for changes in pressure. However, the pressure was recorded every half hour and found to be constant for the entire interval of time analyzed to within 0.15%. Thus, the pressure is unlikely to be a factor in the analysis. Indeed, during the time of the flare the pressure actually rose slightly which would, if anything, depress the counting rate slightly during the time of the GLE. Thus, pressure variations could not be a cause of the excess counting rate observed from 14.0 to 14.6 hours UT.
The muon counting rate for April 14 and April 16 (the preceding and the next day from the signal) are shown in Figure 2 as well as the data containing the signal on April 15. The background curve fit to the April 15 data is also included. It is seen that the background from the day before and the day after are similar to the background curve for April 15; also, the average of four years of data show a similar shape. The zero of muon counting rate is suppressed in order to better show these small deviations from an almost constant rate.
The amount of signal above background was determined by the excess of the six signal bins above the fitted background curve. The signal in these six bins yields 10,708 counts above background with an error of 1762; this error includes the error on the background fit (A) and uses the r.m.s. deviation of the background about the fitted curve as an estimator for the rms error of the data in the signal region. This yields a Ground Level Event signal with a significance of 6.1 (where is the error on the signal).
Each of the 39 stations has an active area of 1.29 m2; correcting for those stations which were not 100% efficient yields a total effective area of 42 m2 for this analysis. The excess counting rate was 255 muons/m2 or 0.36% of the background muon counting rate during the 0.6-hour signal interval.
III.1 Can GRAND see gamma ray or neutron primaries from this GLE?
To determine if GRAND detects secondary muons from gamma ray [Poirier et al., 2001] or neutron primaries which originate from the sun (rather than the protons studied above), the muon rate was analyzed inside a by square angular window centered on the sun. During the signal time from 14.0 to 14.6 hours UT, 368 counts were measured compared to an average of 376 background counts for the 0.6 hour interval of time as obtained during 9.5 to 19.5 hours UT (minus the signal time). The low counting rate in this angular window is caused by the sun’s low elevation angle at that time. A negative signal of –8 counts from background is observed inside this by window, or –0.4 if compared to the error on the signal. Thus there is no evidence for direct gamma rays or neutrons from the sun; as well, they cannot be the cause of the 6.1 excess obtained in the data with no angular cuts.
IV Angular Distribution
The sky was divided into sixteen angular regions each with approximately equal counting rates in order to obtain some information about the angular characteristics of the signal [Poirier and D’Andrea, 2001b]. Each individual region of the sky was examined for the significance of a possible GLE signal. The significance of the GLE signal (in terms of sigma) for each of the 16 windows is shown in Table 1. For these 16 calculations, the background was individually fit to the same quadratic form as before with coefficients A, B, and C; however, due to the reduced amount of data in a region (1/16th of the entire angular region), the coefficients B and C were fixed at the value obtained for the whole sky and only the A parameter was varied in the fit to estimate the background under the signal region for each of the 16 angular regions. The angular information presented in Table 1 could be used in later analyses in an overall fit of this GLE using data from other muon detectors and neutron monitor stations around the world to obtain the mean arrival direction, pitch angle distribution, and spectral index.
| –13∘ | –13 to 0 | 0 to 13 | 13∘ | |
| 13∘ | 1.1 | 0.4 | 0.6 | 0.5 |
| 0 to 13 | 1.4 | 2.5 | 3.7 | 1.7 |
| –13 to 0 | 1.4 | 2.3 | 3.3 | 0.9 |
| –13∘ | –0.8 | –0.1 | –0.1 | –1.0 |
An overall fit for each hemisphere (in a local horizon coordinate system) gives a signal strength of 4.8 for the northern and 1.9 for the southern hemisphere, while a signal strength of 3.7 is obtained for the eastern and 3.4 for the western hemisphere. These results show a definite preference for the northern hemisphere compared to the southern and only a slight preference for the eastern hemishpere over the western. The mean location of the sun at GRAND during the time of the GLE was = +53∘ (eastward) and = –26∘ (southward).
V Primary Energy Sensitivity
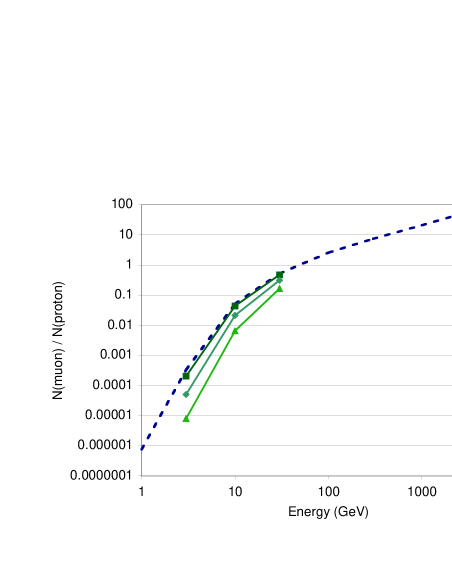
The response function of GRAND as a function of energy for primary protons yielding muons which reach detection level is calculated by using the Monte Carlo program FLUKA [Fassó et al., 2000]. The atmosphere in these simulations is approximated by 50 layers of air beginning 80 km above sea level. The calculation is similar to that reported in [Poirier et al., 2001] except that the primary particles were changed from the gamma rays of that reference to primary protons for this calculation. Each primary proton is incident on the top of the atmosphere at zero degrees from zenith angle (as well as three non-zero angles for the 3, 10, and 30 GeV energies) and all non-hadronic secondaries are followed until they are below the threshold energy to produce pions or the charged tracks reach ground level. The calculation is done for a series of fixed proton primary energies for energies from 1 GeV to 1 TeV. A summary of the results of these calculations is contained in Table 2 for proton primaries incident at the top of the atmosphere at 0∘ from zenith. Figure 3 is a plot of this response function. Protons incident at 0∘ from zenith are shown by a dashed line. Incident angles of 17∘, 34∘, and 51∘ from zenith (solid lines) show GRAND has progressively smaller responses to angles which deviate from normal incidence. The deviation is fractionally larger at the lowest energy (3 GeV) plotted.
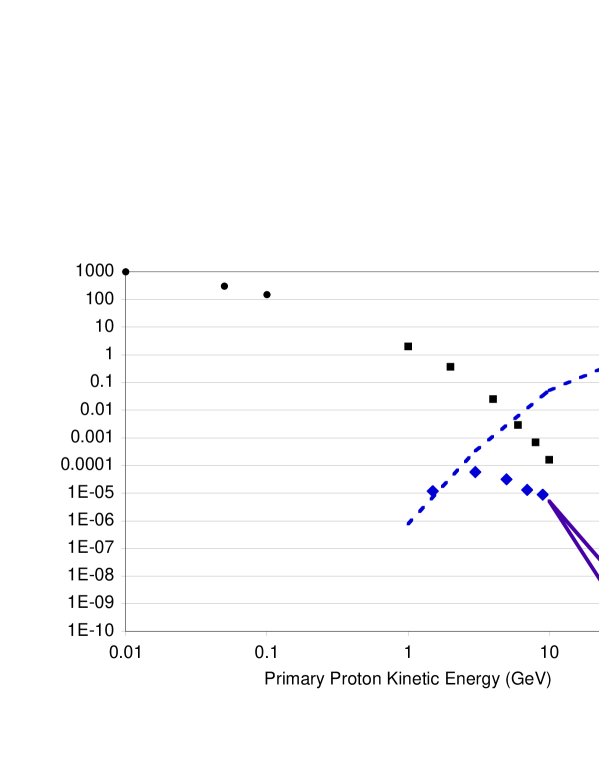
L. Miroshnichenko [Miroshnichenko, 2002 preliminary] has calculated a preliminary fit to monitor stations at Apatity, Moscow (IZMIRAN), Rome, and Athens to obtain the integral flux of protons from this GLE versus the energy of the protons from 1 to 10 GeV. These values are plotted in Figure 4 as square points. The circular points below 0.1 GeV are proton fluxes obtained by the GOES satellite [GOES Website, 2001]..
To obtain the overall differential response expected of GRAND for this GLE, the response function for GRAND (at 0∘ in Table 2) is plotted in Figure 4 as a dashed line (the numbers on the ordinate are the same with units of muons at detection level per proton of that primary energy). This response function is then folded with the flux of primary protons in each energy interval to obtain the differential energy response of GRAND for this GLE (shown as diamond points below 10 GeV). At energies GeV, the proton intensity (shown by solid curves) was approximated using a power law spectrum with differential spectral indices of –8 (upper curve) and –10 (lower curve) which are normalized to the point at 9 GeV.
.
| (GeV) | / | ||
|---|---|---|---|
| 1 | 27 | ||
| 3 | 664 | ||
| 10 | 38511 | 0.0513 | |
| 30 | 208928 | 0.522 | |
| 100 | 256847 | 2.57 | |
| 300 | 738561 | 7.39 | |
| 1000 | 825910 | 20.6 |
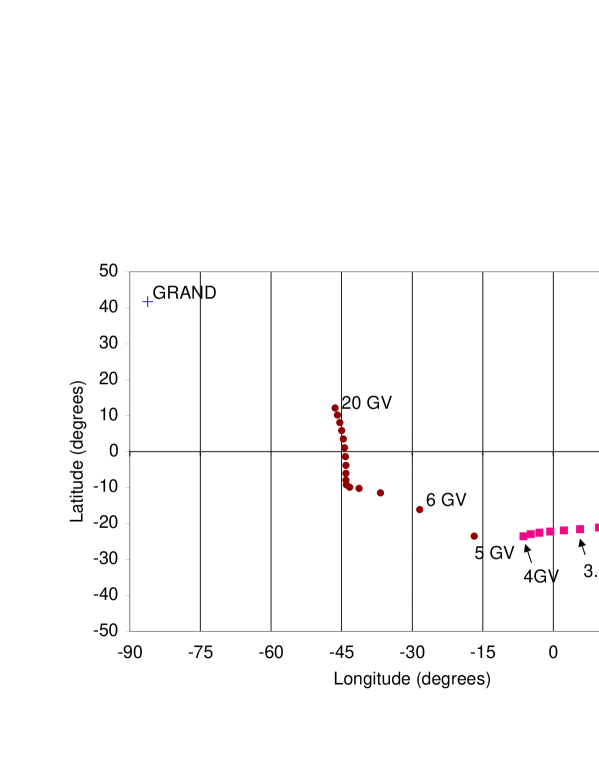
V.1 Asymptotic Direction of Observation versus Rigidity
For rigidities (momentum per charge) in the GV range (kinetic energies in the GeV range), the primaries suffer deflections in the earth’s magnetic field. In order to place GRAND’s data for this GLE in the perspective of other muon stations and neutron monitors, it is of interest to know the direction of a proton primary before entering the earth’s magnetic field (asymptotic direction) in order to arrive at vertical incidence 20 km above Project GRAND. This asymptotic direction depends on the rigidity of the primary as well as the location of the detector on the surface of the earth. We are indebted to Margaret Shea and Don Smart for performing this calculation [Shea and Smart, 2002], summarized in Figure 5, which shows the asymptotic direction of an antiproton starting at 20 km above sea level at the geographical location of GRAND (41.7∘ N and 86.2∘ W) and integrating the trajectories of various rigidities outward through a model of the earth’s magnetic field to find their direction after exiting this field. The coordinate system for the asymptotic directions can be visualized as the intersection of this antiproton’s trajectory on a huge sphere of the earth’s coordinates with a radius much larger than the earth’s magnetosphere. This is then the direction of a proton traveling toward the earth in the geomagnetic field which would reach an altitude of 20 km height above GRAND at 0∘ relative to its local zenith.
The model of the earth’s magnetic field which was used is the International Geomagnetic Reference Field, Epoch 1995 (I95). This is a quiescent field model and does not take into account magnetospheric perturbations (the index during the GLE was 4). The individual asymptotic directions change with time because of the magnetospheric configuration. However, for rigidity values above about 2 to 2.5 GV, the changes are slight. Of greater importance would be changes related to the secular variation of the geomagnetic field which, for some areas of the world, can greatly alter the asymptotic directions close to cutoff values. Also during major geomagnetic disturbances the asymptotic directions can be changed considerably since the cutoff rigidity can be considerably lowered. However, for the Easter Sunday GLE and for GRAND, the values calculated should be adequate for almost any analysis of muon response [Shea and Smart, 2002].
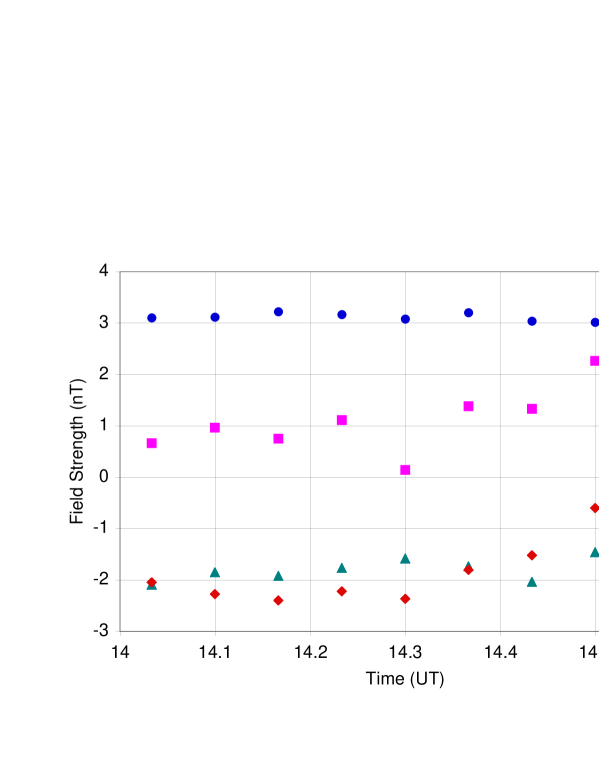
Data on the Interplanetary Magnetic Field (IMF) is shown in figure 6 [GOES website, 2002]. The magnitude of the IMF is shown as circular points. The components in GSE coordinates are by squares (x, from the earth to the Sun along the ecliptic), triangles (y, perpendicular to x in the ecliptic plane), and diamonds (z, in the direction of the north ecliptic pole). While the magnitude of the IMF remains fairly constant, the direction of the magnetic field is changing over the period of this GLE.
VI Other Observations
Data from the Climax, Newark, and Oulu Neutron Monitor Stations are compared for this time interval on April 15 [Lopate, Clem and Pyle, and Oulu Neutron Monitor Website, 2001]. In Figure 1, the data for Climax are very close to that of Newark and for clarity are not shown. The energy thresholds for the Climax, Newark, and Oulu neutron monitor stations are influenced by their vertical geomagnetic cutoff rigidity at 3.0, 2.1, and 0.8 GV respectively [University of Chicago Neutron Monitor Website, 2001] and overburden of air; their corresponding heights above sea level are 3400, 50, and 15 m. The corresponding numbers for GRAND are a geomagnetic cutoff rigidity of 1.9 GV and a height of 220 m above sea level. However, the primary energy for GRAND is influenced by the different mechanisms which produce muons (rather than neutrons) at detection level. While looking at single muon tracks at ground level, GRAND’s primary proton energy is approximately 4 GeV (see Figure 4 and [Shea and Smart, 2002]) for the spectral shape of this GLE.
When binned in six-minute intervals, the Newark signal has an onset time at 14.21 hours, the Climax signal at 14.16 hours, and Oulu at 14.27 hours (where the “onset” is the time of the half-height of the signal as measured from its rise above background to the highest measured data point of the GLE). A similar calculation for the onset time for GRAND is 14.09 hours. The width (full width at half-of-maximum above background) of the Climax, Newark, and Oulu peaks are 1.27, 1.24, and 1.61 hours in contrast to GRAND’s value of 0.48 hour. Thus the GRAND peak is: a) shorter in duration (typically, higher energies have a shorter duration than lower energies as is seen in satellite data for protons at lower energies [GOES Website, 2002]), b) the onset is 0.1 hour earlier (the earlier time might be expected on the basis of higher primary energies compared to the neutron monitors [Clem and Dorman, 2000] with faster protons traveling at smaller pitch angles yielding shorter path lengths, and c) smaller in amplitude due to GRAND’s sensitivity to higher primary energies.
VII Conclusions
Project GRAND sees a ground level signal with a significance of 6.1 when examining the secondary muon counting rate at ground level between 14.0 and 14.6 hours UT on April 15, 2001. This signal is obtained with no restrictions on the angle of the muons. This is consistent with protons originating at the surface of the sun and accelerated during the time of the X14 X-ray flare.
A slightly negative signal (–0.4 ) is obtained if a small region of the sky ( in and in ) near the angle of the sun’s position is examined. Thus, neither gamma ray nor neutron primaries are the cause of the 6.1 signal found in the data with no angular cuts.
GRAND’s GLE detection occurs slightly earlier than Climax, Newark, or Oulu neutron monitor signals which might be expected from the slightly higher primary energies detected by GRAND (above about 4 GeV) compared to the neutron monitors (the vertical geomagnetic cutoff energies for the Climax, Newark, and Oulu neutron monitor stations are 3, 2, and 0.8 GeV respectively). Earlier times would be consistent with smaller pitch angles relative to the IMF (and thus a shorter flight path) for the higher energies as well as the increased velocity. The fact that GRAND’s GLE signal is not as pronounced as those from the neutron monitors indicates that there are fewer particles at GRAND’s higher energies. The mean energy of primary protons which produces the detected muons depends somewhat upon the spectral index of this GLE in the 4 GeV region. In the future, combined analyses of world-wide neutron monitor stations and muon telescopes are anticipated to yield more detailed information on this GLE.
Acknowledgements.
The authors wish to thank Monica Dunford, Jon Vermedahl, and Marié López del Puerto for their participation in the data analyses; Kent Doggett (and the ACE science team); the GOES science team; and Stefan Roesler and Alberto Fasso for their assistance with the Monte Carlo simulations. Thanks to Leonty Miroshnichenko for preliminary intensity calculations. We also thank Margaret Shea and Don Smart for calculations of GRAND’s asymptotic direction as a function of rigidity; John Clem and Roger Pyle (and Bartol), Cliff Lopate (and Climax), and the Oulu Neutron Monitor for the use of their data; Ted Bowen for suggestions on improving the text; and Jule Poirier for proofreading. The Newark neutron monitor is operated by the Bartol Research Institute Neutron Monitor Program and is funded by National Science Foundation Grant ATM-0000315. The Climax Neutron Monitor is operated by The University of Chicago and is funded through National Science Foundation Grant ATM-9912341. Project GRAND is funded through the University of Notre Dame and private grants.References
- (1) Advanced Composition Explorer (ACE) Homepage, World Wide Web: http://www.srl.caltech.edu/ACE.
- (2) J. Bieber et al., Energetic Particle Observations During the 2000 July 14 Solar Event, Astrophysical Journal, 622, March 1, 2002.
- (3) M. Duldig, Muon Observations, Space Science Reviews, p. 207-226, January, 2000.
- (4) J. Clem and L. Dorman, Neutron Monitor Response Functions (and references therein), Space Science Reviews, 93, 335, 2000.
- (5) J. Clem and R. Pyle, Private Communication, 2001. World Wide Web: http://www.bartol.udel.edu/neutronm.
- (6) A. Falcone, J. Ryan, Milagro as a Solar Observatory, Astroparticle Physics, 283, 1999.
- (7) A. Fassò, A. Ferrari, P.R. Sala, Electron-photon transport in FLUKA: Status, Proceedings of the Monte Carlo 2000 Conference, Lisbon, 159, 2000.
- (8) A. Fassò et al., FLUKA: Status and Prospective for Hadronic Applications, ibid, 955, 2000.
- (9) GOES Website. World Wide Web: http://rsd.gsfc.nasa.gov/goes
- (10) GRAND’s Homepage. World Wide Web: http://www.nd.edu/grand
- (11) IPS Radio and Space Services Website, 2001. World Wide Web: http://www.ips.gov.au.
- (12) C. Lopate, Private Communication, 2001.
- (13) L. Miroshnichenko, Preliminary Results from Pivate Communication, 2002.
- (14) L. Miroshnichenko, Solar Cosmic Rays, Kluwer Academic Publishers, 2001.
- (15) K. Munakata, A Prototype Muon Detector Network Covering a Full Range of Cosmic Ray Pitch Angles, Proceedings of the 27th International Cosmic Ray Conference, Hamburg, 3494, 2001. World Wide Web: http://www.copernicus.org/icrc/programme.htm.
- (16) NOAA Space Environment Center Website, 2001. World Wide Web: http://www.sec.noaa.gov.
- (17) Oulu Neutron Monitor Website, 2001. World Wide Web: http://spaceweb.oulu.fi/projects/crs.
- (18) J. Poirier and C. D’Andrea, Variation of Muon Counts versus Solar Time, Proceedings of the 27th International Cosmic Ray Conference, Hamburg, 3934, 2001a. World Wide Web: http://www.copernicus.org/icrc/programme.htm.
-
Poirier and D’Andrea (2001)
J. Poirier and C. D’Andrea, A Measurement of Secondary Muon
Angular Distributions, Proceedings of the 27th International
Cosmic Ray Conference, Hamburg,
3923, 2001b. World Wide Web: http://www.copernicus.org/icrc/programme.htm. - (20) J. Poirier, S. Roesler, and A. Fassò, Distributions of Secondary Muons at Sea Level from Cosmic Gamma Rays Below 10 TeV, astro-ph/0103030, 2001.
- (21) J. M. Ryan and the MILAGRO Collaboration, High Energy Solar Particles in the 6 November 1997 Ground Level Event, Proceedings of the 27th International Cosmic Ray Conference, Hamburg, 3367, 2001. World Wide Web: http://www.copernicus.org/icrc/programme.htm.
- (22) M. Shea and D. Smart. Private Communication, 2002.
- (23) D.B. Swinson and M.A. Shea, The September 29, 1989 Ground Level Event Observed at High Rigidity, Geophysical Research Letters, 8, 1073, 1990.
- (24) University of Chicago Neutron Monitor Website, 2001. World Wide Web: http://ulysses.uchicago.edu/NeutronMonitor/neutron_mon.html.
- (25) E. V. Vashenyuk, The Ground Level Enhancement of 14 July 2000: Explaining the difference between near-by neutron monitors at Apatity and Oulu, Proceedings of the 27th International Cosmic Ray Conference, Hamburg, 3383, 2001.