01 \Year2002 \Month10 \Pagespan223227 \lhead[0]Hornschemeier et al.: The Weak Outnumbering the Mighty: Normal Galaxies in Deep Chandra Surveys \rhead[Astron. Nachr./AN XXX (200X) X]0 \headnoteAstron. Nachr./AN 32X (200X) X, XXX–XXX
The Weak Outnumbering the Mighty:
Normal Galaxies in Deep Chandra Surveys
Abstract
is detecting a significant population of normal and starburst galaxies in extremely deep X-ray exposures. For example, approximately 15% of the sources arising in the 2 Ms Chandra Deep Field-North survey are fairly normal galaxies, where “normal” means “Milky Way-type” X-ray emission rather than simply exhibiting an “optically normal” spectrum. Many of these galaxies are being detected at large look-back times (–), allowing the study of the evolution of X-ray binary populations over significant cosmological timescales. We are also detecting individual off-nuclear ultraluminous X-ray sources (e.g., X-ray binaries), providing the first direct constraints on the prevalence of lower-mass black holes at significantly earlier times. The X-ray emission from such “normal” galaxies may also be a useful star-formation rate indicator, based on radio/X-ray cross-identifications. We describe the contribution of normal galaxies to the populations which make up the X-ray background and present their directly measured X-ray number counts. We find that normal and starburst galaxies should dominate the 0.5–2 keV number counts at X-ray fluxes fainter than erg cm-2 s-1 (thus they will outnumber the “mighty” AGN). Finally, we look to the future, suggesting that it is important that the population of X-ray faint normal and starburst galaxies be well constrained in order to design the next generation of X-ray observatories.
keywords:
surveys – cosmology – X-rays: galaxies – X-rays: black holesannh@pha.jhu.edu
1 Introduction
The first detection of X-rays from a galaxy outside the Milky Way (the Large Magellanic Cloud; Mark et al. 1969) occurred during a sounding rocket flight that was similar to the one which discovered the cosmic X-ray background (Giacconi et al. 1962). Approximately ten years later, as Einstein was being launched, there were still only four normal galaxies detected in X-rays (the Milky Way, M31, and the two Magellanic Clouds; Helfand et al. 1984). Another decade later, the study of normal galaxies in the X-ray band had become rich enough to warrant an extensive review (Fabbiano 1989), and by the time of the and XMM- launches in 1999 it would have been difficult to even attempt to list the wealth of X-ray studies of normal and starburst galaxies as there are so many (but a nice example from is Read, Ponman, & Strickland 1997).
In general, these studies were confined to the relatively nearby Universe (within Mpc). This paper outlines some of the progress we are now enjoying with the new capabilities of , which has allowed us to reach significantly farther. As will be discussed, there will be plenty of puzzles to keep us busy well into and past the end of the fourth decade since the first X-ray detection of the LMC.
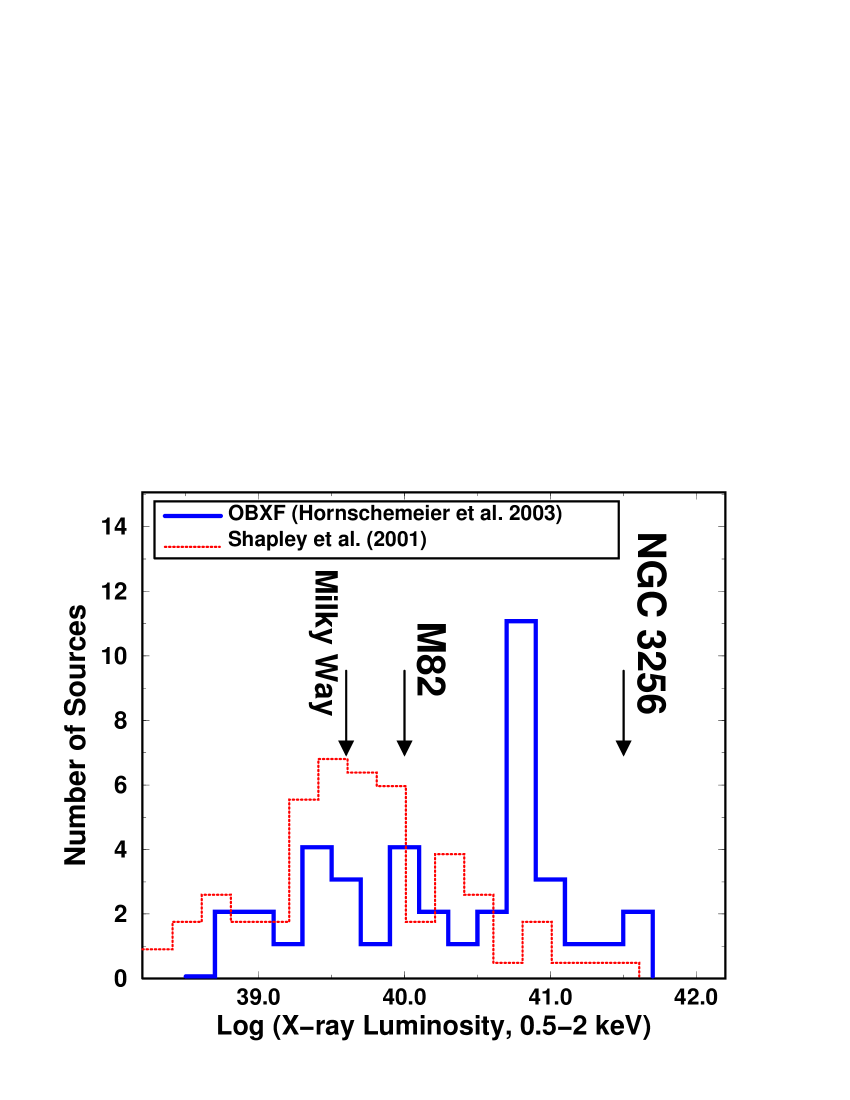
In 2000, as the Chandra Deep Field surveys (hereafter CDF-N and CDF-S) reached soft X-ray depths significantly beyond the -era deep fields (e.g., Hasinger et al. 1998), a population of normal galaxies were found to arise (e.g., Hornschemeier et al. 2001; Tozzi et al. 2001). These normal galaxies were found to have X-ray-to-optical flux ratios lower than that of AGN [e.g., ]. Recent studies have shown the majority of X-ray sources with to be consistent with infrared and radio-emitting starburst galaxies (Alexander et al. 2002; Bauer et al. 2002). This paper focuses on extragalactic X-ray sources with even lower X-ray-to-optical flux ratios [i.e., ], which are referred to as “optically bright, X-ray faint” (OBXF) throughout this paper. The OBXF sources have optically normal spectra and low X-ray luminosities (– erg s-1, 0.5–2 keV, see Figure 1), indicating they are not obviously dominated by luminous AGN; however, LLAGNs may be present in some sources. In general, these sources are consistent with more quiescent galaxies (as opposed to starbursts; Hornschemeier et al. 2003) and comprise an appreciable fraction of the faint X-ray source population (% of sources having erg cm-2 s-1, 0.5–2 keV). The majority have host galaxies of spiral and/or irregular optical morphology and % show no obvious signs of extended X-ray emission.
It is important to note that the OBXF sources are distinct from the X-ray luminous “optically normal” galaxies also being discovered in both deep and moderately-deep X-ray surveys. These galaxies, the prototype of which is the object P3 of the HELLAS2XMM survey (e.g., Comastri et al. 2002), do not show signatures for AGN in moderate-quality optical spectra but their X-ray properties suggest they are powerful AGN. For further discussion see Moran et al. (2002) and Comastri et al. in this issue of AN.
The OBXF sources (we use this term somewhat interchangeably with “normal galaxy”) are being detected at much larger distances (500–3000 Mpc; –) than was possible for normal galaxies before , enabling study of the cosmological evolution of the X-ray emission from galaxies for the first time (e.g., Ptak et al. 2001; Brandt et al. 2001b; Hornschemeier et al. 2002; Nandra et al. 2002). This paper focuses on normal and starburst galaxies in the CDF-N survey (Brandt et al. 2001a; D.M. Alexander et al., in preparation).

2 Source Types and Number Counts
Even with 1–2 Ms of data, AGN make up the majority of the X-ray sources in deep surveys (the fraction is –75%, e.g., Rosati et al. 2002; Barger et al. 2002; Hornschemeier et al. 2003). While overall the fraction of 2 Ms X-ray sources which are OBXF is %, the fraction increases significantly at faint X-ray fluxes (see §1). Correspondingly, the number of OBXF sources with X-ray fluxes slightly below the 1 Ms detection limit is significant; in the CDF-N the number of OBXF sources over the 183 square arcminute “high exposure area” doubled111At large off-axis angles, the 2 Ms CDF-N data are background-limited. The gain in number of galaxies quoted is thus pessimistic with respect to the galaxy number counts. when the integration time was increased from 1 Ms to 2 Ms (Hornschemeier et al. 2003). The gain in the number of X-ray detected galaxies with increasing X-ray depth is shown in Figure 2.
We can compare the number counts of the extragalactic OBXF population with those of the full CDF-N X-ray source population (see Figure 3 and detailed discussion in Hornschemeier et al. 2003). A maximum likelihood fit to the soft-band differential number counts from erg cm-2 s-1 to erg cm-2 s-1 yields a slope of for the corresponding cumulative number counts. By comparison, the slope for the general soft-band detected X-ray source population is quite flat over the same flux range at (Brandt et al. 2001a).
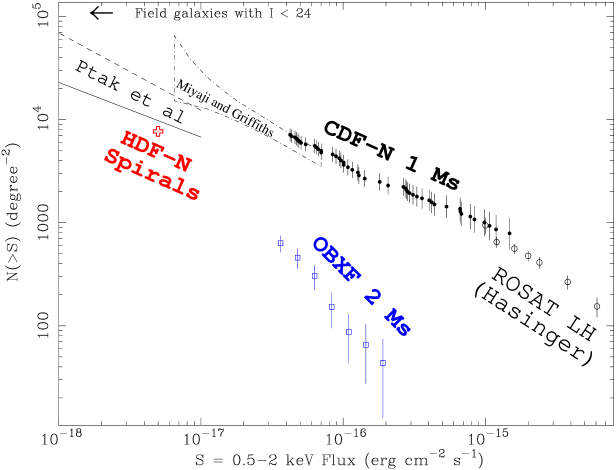
Indirect measures of galaxy number counts, which have been able to probe galaxies statistically beyond the formal 1 Ms detection limit, have included the stacking analysis work of Hornschemeier et al. (2002), which focused on quiescent spiral galaxies, and the fluctuation analysis work of Miyaji & Griffiths (2002). In Figure 3 we show these results; an extrapolation of the OBXF galaxy counts should intercept the Miyaji fluctuation analysis “fish” at a 0.5–2 keV flux of erg cm-2 s-1. This is a coarse estimate of the flux where the X-ray number counts will be dominated by normal galaxies and is in reasonable agreement with the estimates of Ptak et al. (2001) based on the optical properties of field galaxies (also shown in Figure 3) and with the stacking analyses of Hornschemeier et al. (2002).
3 X-ray Emission as a Cosmic SFR Probe
X-rays provide a unique window into star-formation processes. Of course, the penetrating power of hard X-ray emission provides a useful cross-check for methods that are sensitive to dust obscuration (e.g., ultraviolet emission; see the discussion in Seibert et al. 2002 and references therein), but studies of X-ray emission also provide important information on the evolution of stellar endpoints and hot gas that cannot be obtained at any other wavelength (e.g., the multitude of recent and XMM- studies of local galaxies). Therefore, X-ray emission is not only a possible star-formation rate (SFR) indicator but an astrophysically compelling way to study galaxies.
A number of groups have been investigating the use of hard X-rays as a surrogate for other star-formation diagnostics in vigorously star-forming galaxies (e.g., Ranalli et al. 2002; Bauer et al. 2002; Nandra et al. 2002). It is thought that the X-ray emission of vigorous starbursts is dominated by the relatively short-lived high-mass X-ray binary (HMXB) systems, which due to their relatively short lifetimes ( years) should closely track vigorous star formation episodes (e.g., Grimm et al. 2002). This use of X-rays as a star-formation diagnostic has been extended to high redshift in work done on the Lyman Break galaxies (e.g., Steidel et al. 1996). These galaxies have been found to exhibit X-ray properties that are broadly similar to local vigorous starbursts (e.g., Brandt et al. 2001b; Nandra et al. 2002). Further work demonstrated that X-ray emission provides a test for ultraviolet extinction-correction methods in calculating the star-formation rate (Seibert et al. 2002).
On longer timescales ( yr) after a starburst, low-mass X-ray binary (LMXBs) evolve to an accreting phase and emit X-rays. The increased star-formation rate at –3 (e.g., Madau et al. 1996) should thus result in elevated X-ray emission from LMXB systems in quiescent galaxies at –1. X-ray emission thus represents a “fossil record” of past epochs of star formation (e.g., Ghosh & White 2001; Ptak et al. 2001), and measurements of the X-ray luminosities of galaxies can constrain models of X-ray binary production. While X-ray emission from individual quiescent galaxies is not easily detected at , constraints have been placed on its evolution using stacking analyses (e.g., Hornschemeier et al. 2002). It was found that at , the X-ray luminosity of spiral galaxies was at most a factor of two higher than at the current epoch. This has possible implications for the evolutionary timescale of lower-mass X-ray binaries and will be improved with larger samples of galaxies.
4 Lower-mass Black Holes 1 Billion Years Ago
Several OBXF sources have X-ray emission offset from the optical galaxy center. They have full-band X-ray luminosities erg s-1, indicating that they are members of the off-nuclear ultraluminous X-ray (ULX) population. ULX sources have X-ray luminosities in excess of that expected for spherically symmetric Eddington-limited accretion onto “stellar” mass (5–20 ) black holes. These sources may still be consistent with stellar mass black holes, possibly representing an unstable, beamed phase in normal high-mass X-ray binary (HMXB) evolution (e.g. King et al. 2001) or harboring the most rapidly spinning Kerr black holes among HMXBs (e.g., Makishima et al. 2000). They may also represent a class of intermediate mass black holes (–1000 , e.g., Colbert et al. 2002) or ultraluminous supernova remnants (e.g., Blair et al. 2001). None of the ULX sources demonstrate spatial extent in the X-ray band but the physical constraints are not strong due to the low number of counts.
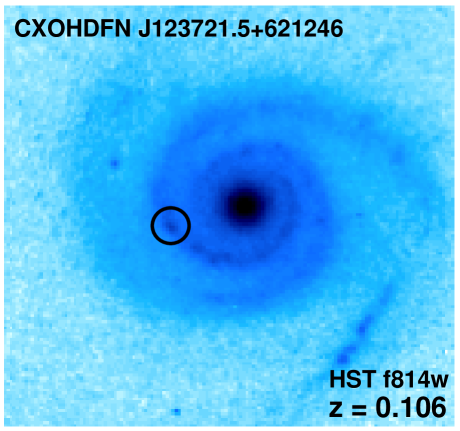
An example of this type of source is shown in Figure 4. We find that % of galaxies having in the CDF-N field harbor these off-nuclear ULX sources (Hornschemeier et al. 2003). Variability testing shows that some of the CDF-N ULX sources (found mainly near ) are likely black hole candidates. The ULX fraction measured here is only a lower limit; even Chandra’s sub-arcsecond spatial resolution often cannot resolve sources within the central –2 kpc of the nucleus. Offsets of kpc are not expected if the object is a supermassive black hole, but have been found for ULX sources in the local Universe (see the discussion in Colbert et al. 2002). We have thus made the first pass at evaluating the prevalence of lower-mass black holes at a time when the Universe was appreciably younger.
5 The Future: Beyond 2 Ms
Given that normal galaxies are expected to be the majority of the X-ray sources throughout the Universe, we consider what might be seen if we were to look even deeper with . Extremely long X-ray observations are feasible; the 2 Ms CDF-N background level indicates ACIS will remain approximately photon-limited out to 5 Ms (see also the discussion in this issue of AN by Alexander et al.) over the inner of the field (or roughly the region of the original Hubble Deep Field-North plus Hubble Flanking Fields). In Ms, we should individually detect normal galaxies in this region and be able to place important statistical constraints on thousands of other galaxies.
Large numbers of individual galaxy detections in the X-ray band will allow construction of galaxy luminosity functions and determination of the detailed relationship between the evolution of X-ray emission and that of the cosmic SFR. An ultradeep X-ray survey would also allow an unbiased determination of the frequency of ULX sources up to –0.4.
Beyond X-ray studies of galaxies, any science which requires X-ray imaging at fluxes erg cm-2 s-1 (0.5–2 keV) may need to contend with confusion from galaxies if the spatial resolution is not better than . Missions such as are planned to reach these extremely faint X-ray fluxes, possibly at this fairly large spatial resolution. In order to ensure that we have sharp enough vision to operate at these low X-ray fluxes, it is essential to understand the normal galaxy population much better.
Acknowledgements.
We thank Omar Almaini for the spirited discussion at the Santander meeting which contributed to this paper. We gratefully acknowledge the financial support of NASA grant NAS 8-38252, fellowship grant PF2-30021, NSF CAREER award AST-9983783, Chandra X-ray Center grant G02-3187A and NSF grant AST99-00703.References
- Alexander et al. (2002) Alexander, D. M., Aussel, H., Bauer, F. E., Brandt, W. N., Hornschemeier, A. E., Vignali, C., Garmire, G. P., and Schneider, D. P. 2002, ApJ, 568, L85
- Barger et al. (2002) Barger, A. J., Cowie, L. L., Brandt, W. N., Capak, P., Garmire, G. P., Hornschemeier, A. E., Steffen, A. T., and Wehner, E. H. 2002
- Bauer et al. (2002) Bauer, F. E., Alexander, D. M., Brandt, W. N., Hornschemeier, A. E., Vignali, C., Garmire, G. P., and Schneider, D. P. 2002, AJ
- Blair et al. (2001) Blair, W. P., Fesen, R. A., and Schlegel, E. M. 2001, AJ, 121, 1497
- Brandt et al. (2001a) Brandt, W. N. et al. 2001a, AJ, 122, 2810
- Brandt et al. (2001b) Brandt, W. N., Hornschemeier, A. E., Schneider, D. P., Alexander, D. M., Bauer, F. E., Garmire, G. P., and Vignali, C. 2001b, ApJ, 558, L5
- Colbert and Ptak (2002) Colbert, E. and Ptak, A. 2002, ApJS(in press)
- Comastri et al. (2002) Comastri, A. et al. 2002, ApJ, 571, 771
- Fabbiano (1989) Fabbiano, G. 1989, ARA&A, 27, 87
- Ghosh and White (2001) Ghosh, P. and White, N. E. 2001, ApJ, 559, L97
- Giacconi et al. (1962) Giacconi, R., Gursky, H., Paolini, F. R., and Rossi, B. B. 1962, Physical Review Letters, 9, 439
- Griffiths et al. (2000) Griffiths, R. E., Ptak, A., Feigelson, E. D., Garmire, G., Townsley, L., Brandt, W. N., Sambruna, R., and Bregman, J. N. 2000, Science, 290, 1325
- Grimm et al. (2002) Grimm, H.-J., Gilfanov, M., and Sunyaev, R. 2002, MNRAS submitted
- Hasinger et al. (1998) Hasinger, G., Burg, R., Giacconi, R., Schmidt, M., Trumper, J., and Zamorani, G. 1998, A&A, 329, 482
- Helfand (1984) Helfand, D. J. 1984, PASP, 96, 913
- Hornschemeier et al. (2002) Hornschemeier, A. E., Brandt, W. N., Alexander, D. M., Bauer, F. E., Garmire, G. P., Schneider, D. P., Bautz, M. W., and Chartas, G. 2002, ApJ, 568, 82
- Hornschemeier et al. (2001) Hornschemeier, A. E. et al. 2001, ApJ, 554, 742
- Hornschemeier, A. E. et al. (2003) Hornschemeier, A. E. et al. 2003, ApJ submitted
- King et al. (2001) King, A. R., Davies, M. B., Ward, M. J., Fabbiano, G., and Elvis, M. 2001, ApJ, 552, L109
- Madau et al. (1996) Madau, P., Ferguson, H. C., Dickinson, M. E., Giavalisco, M., Steidel, C. C., and Fruchter, A. 1996, MNRAS, 283, 1388
- Makishima et al. (2000) Makishima, K. et al. 2000, ApJ, 535, 632
- Mark et al. (1969) Mark, H., Price, R., Rodrigues, R., Seward, F. D., and Swift, C. D. 1969, ApJ, 155, L143
- Miyaji and Griffiths (2002) Miyaji, T. and Griffiths, R. E. 2002, ApJ, 564, L5
- Moran et al. (2002) Moran, E. C., Filippenko, A. V., and Chornock, R. 2002, ApJ in press
- Moran et al. (1999) Moran, E. C., Lehnert, M. D., and Helfand, D. J. 1999, ApJ, 526, 649
- Nandra et al. (2002) Nandra, K., Mushotzky, R. F., Arnaud, K., Steidel, C. C., Adelberger, K. L., Gardner, J. P., Teplitz, H. I., and Windhorst, R. A. 2002, ApJ, 576, 625
- Ptak et al. (2001) Ptak, A., Griffiths, R., White, N., and Ghosh, P. 2001, ApJ, 559, L91
- Ranalli et al. (2002) Ranalli, P., Comastri, A., and Setti, G. 2002, in in ”New Visions of the X-ray Universe in the XMM-Newton and Chandra Era”, ESTEC 2001, p. 2241
- Read et al. (1997) Read, A. M., Ponman, T. J., and Strickland, D. K. 1997, MNRAS, 286, 626
- Rosati et al. (2002) Rosati, P. et al. 2002, ApJ, 566, 667
- Seibert et al. (2002) Seibert, M., Heckman, T. M., and Meurer, G. R. 2002, AJ, 124, 46
- Shapley et al. (2001) Shapley, A., Fabbiano, G., and Eskridge, P. B. 2001, ApJS, 137, 139
- Steidel et al. (1996) Steidel, C. C., Giavalisco, M., Dickinson, M., and Adelberger, K. L. 1996, AJ, 112, 352
- Tozzi et al. (2001) Tozzi, P. et al. 2001, ApJ, 562, 42
- Warwick (2002) Warwick, R. S. 2002, in ‘New Visions of the X-ray Universe in the XMM-Newton and Chandra Era’, ESTEC 2001 (astro-ph/0203333)