Expansion of the R4 H2O Maser Arc Near Cepheus A HW2
Abstract
We present new (April 2000) MERLIN observations of the H2O masers located near the protostar Cepheus A HW2. The MERLIN observations detect many of the structures found in earlier (1996) VLBA observations of Torrelles and collaborators, and the changed positions of these structures are compatible with the VLBA proper motions and astrometric uncertainties. The radius of curvature of the R4 structure of maser arcs appears to have grown by a factor of two, and the displacement of the arcs between 1996 and 2000 are compatible with expansion about a common center. In addition, the MERLIN observations detect red-shifted masers not previously found; taken with the newly discovered masers, the R4 structure now resembles patchy emission from an elliptical ring. We demonstrate that a simple bow-shock model cannot simultaneously account for the shape and the velocity gradient of the R4 structure. A model involving a slow, hydromagnetic shock propagating into a rotating, circumstellar disk better describes the maser spot kinematics and luminosities. In this model, the central mass is , and we demonstrate that the mass of the disk is negligible in comparison. The expansion velocity of the post-shock gas, , is slow compared to the shock velocity, , suggesting that the post-shock gas is magnetically supported with a characteristic field strength of mG. We speculate that the expanding maser rings R4 and R5 may be generated by periodic, instability-driven winds from young stars that periodically send spherical shocks into the surrounding circumstellar material.
1 Introduction
Interstellar H2O masers trace warm, dense molecular gas associated with young stellar objects (YSOs) and star-forming regions (e.g., Genzel & Downes 1977; more recent examples include Claussen et al. 1998; Furuya et al. 2000; Rodríguez et al. 2002). In contrast with thermal tracers, H2O masers are bright, compact radio sources, and can be detected on very long baselines, corresponding to sub-milliarcsecond (mas) resolution. Using aperture synthesis techniques, one can map both the geometry of the maser spots and trace their very fine proper motions. Adding radial velocity information derived from the Doppler shift of the maser line results in a detailed picture of the maser geometry and kinematics as a measure of the dynamics very close to the YSO (e.g., Genzel et al. 1981a; Genzel et al. 1981b; Schneps et al. 1981; Gwinn, Moran, & Reid 1992).
Most of the known interstellar masers trace gas located near the base of molecular outflows on scales of 10s – 100s of AU (for reviews, see Reid & Moran 1988; Elitzur 1992) The association of masers with outflows has been unambiguous. The maser spots (i.e., individual, unresolved maser sources) align with molecular outflows mapped in millimeter-wave emission lines, or are associated with Herbig-Haro objects. The kinematics of the such masers also follow the sense of the motion of the outflow on larger scales. The proper motions are usually small compared to the molecular outflow velocities, suggesting that H2O masers trace the expanding shock front between the outflow and the ambient ISM (Claussen 2001).
There are, however, a handful of studied interstellar H2O maser sources that appear to be associated with circumstellar disks or rings rather than molecular outflows (Matveenko 1987; Cesaroni 1990; Fiebig et al. 1996; Torrelles et al. 1996; Berulis, Lekht, & Mendoza-Torres 1998; Torrelles et al. 1998a; Torrelles et al. 1998b; Hunter et al. 1999; Shepherd & Kurtz 1999; Matveenko & Diamond 2000; Patel et al. 2000; Lekht & Sorochenko 2001). These disks are thought to be the remnants of the molecular cloud cores out of which the stars formed (e.g., Shu, Adams, & Lizano 1987). The nature of these disks ultimately bears on the origin of planets, which are generally thought to form out of condensations in the circumstellar disk (e.g., as reviewed in McCaughrean 1997).
Recently, Torrelles and collaborators (Torrelles, et al. 1996; (Torrelles, et al. 1998a) reported evidence for H2O masers in a protoplanetary disk around the continuum radio source Ceph A HW2 (Hughes & Wouterloot 1984a). The radio continuum source resolves into a jet of thermal free-free emission oriented along PA 44° (Rodriguez et al. 1994). Torrelles et al. used the VLA to map the maser emission and found a compact distribution of spots, roughly 300 AU (04) in extent (assuming a distance of 725 pc: Johnson 1957). The maser spots coarsely align at right angles to the jet axis, i.e., are better aligned with the predicted position angle of a protoplanetary disk than with the thermal jet. In addition, there is a radial velocity gradient across the distribution of maser spots that is compatible with disk rotation.
Their subsequent 1996 VLBA observations resolved the apparent disk into a more complex, filamentary arrangement of maser spots. The maser spot filaments (called R1 – R5) show seemingly independent proper motions and may well be associated with unseen protostars in the neighborhood of HW2 instead of a large-scale disk associated solely with HW2 (Torrelles et al. 2001a; Torrelles et al. 2001b). In this work, we present new MERLIN observations of the H2O masers located near HW2. Our main result is the discovery of an expanding ring of maser spots associated with region R4 (using the naming convention of Torrelles et al.). There is a velocity gradient along the major axis, which is most simply explained by rotation. We consider the possibility that the R4 masers arise from a gaseous disk surrounding a forming star.
This paper is organized as follows. §2 describes both the new MERLIN and archival VLA observations of the HW2 H2O masers, and §3 presents the results of these observations. §4 describes two shock models for the HW2 R4-A maser arcs and argues in favor of a model involving a shock wave propagating into a rotating, gaseous disk. We also present some constraints on the properties of the pre-shock gas based on the shock models. §5 considers the proper motions of the other arcuate maser structures, R1 – R5 with the goal of placing a limit on the proper motion of the rotation center of the R4 masers. §6 summarizes the results of the observations and shock modeling and also briefly discusses the possible origin of the R4 masers.

2 Observations and Data Reduction
2.1 MERLIN Maser Data
On 9 April 2000, we used the 5-element Multi-Element Radio-Linked Interferometer Network (MERLIN111 MERLIN is operated by the University of Manchester on behalf of the Particle Physics & Astronomy Research Council (PPARC)) telescope, based at the Jodrell Bank Observatory, to observe the Ceph A HW2 region (pointing center: [1950] = 22 54 19.0592, [1950] = 61°45′46.51″). The central frequency was tuned to the 616 – 523 H2O maser transition (rest frequency: 22235.079 MHz), offset to the systemic velocity of the Ceph A region, km s-1. The observations were made in spectral line mode with 256 channels and a channel spacing of 0.21 km s-1. The total on-source integration time was 11.5 hrs.
Calibration involved initial editing and bandpass calibration using the “dprocs” routines developed at Jodrell Bank. We then used AIPS to compute an improved bandpass calibration, as well as atmospheric and instrumental phase and amplitude corrections against the position of the calibrator point source J2302+640, whose coordinates are known to a precision of about 12 mas (Patnaik et al. 1992). The integrated maser spectrum derived from the calibrated visibility data is plotted in Figure 1.
After calibration, the data were transformed into images of the sky using the AIPS task IMAGR, which performs both the requisite Fourier Transform and a “CLEAN” deconvolution (Högbom 1974; Clark 1980). To achieve the optimum angular resolution, the visibility data grid was given uniform weight during the Fourier Transform. The resulting angular resolution (“clean beam”) was 8 mas circular. The RMS noise in signal-free channels is 25 mJy beam-1, comparable to the expected thermal limit of 20 mJy beam-1. However, channels containing bright maser emission were always dynamic range limited at a ratio of typically 400:1 (signal: noise).

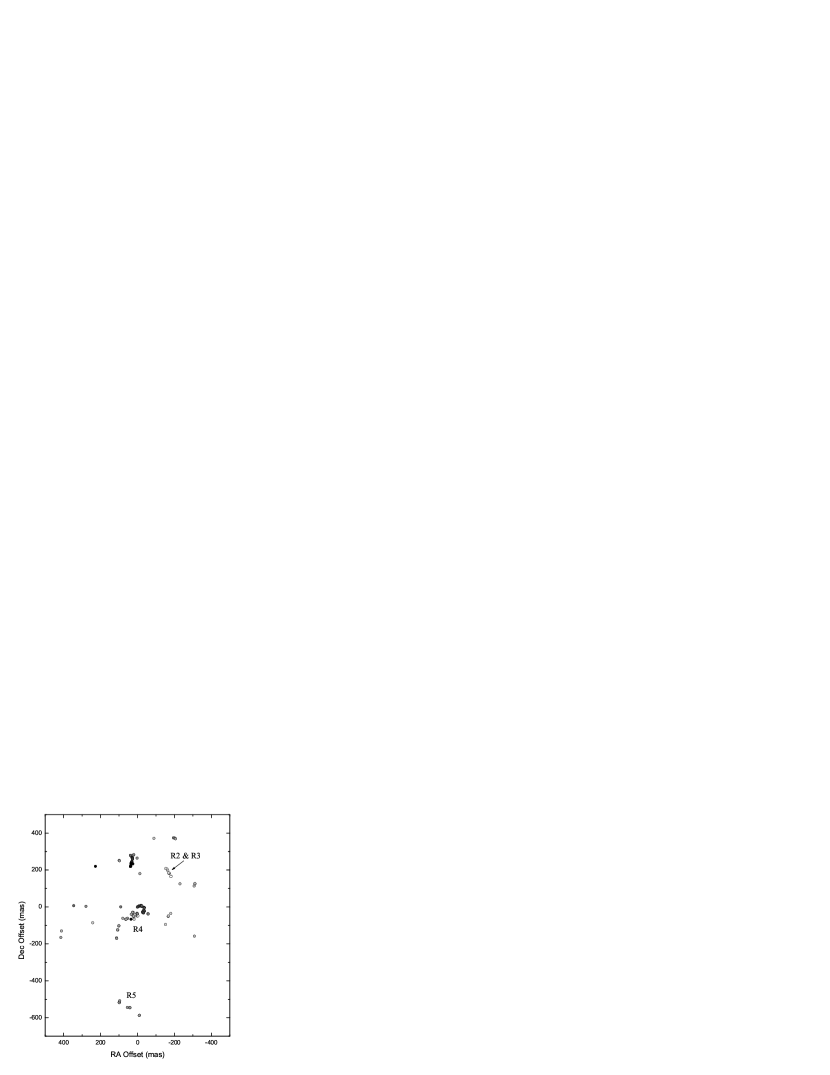
Each channel image was then examined for maser signals of signal-to-noise ratio (SNR) , from which we compiled a database of maser positions and velocities. The positions of the MERLIN maser spots are plotted in Figures 2 and 3. For convenience, and unless otherwise specified, offset coordinates are referenced to the position of the brightest spot associated with the R4 maser arc. The reference position is (J2000) 1797792, Dec (J2000) = 01′494421.
2.2 VLA Continuum Data
We also obtained archival VLA continuum observations of Ceph A HW2 to compare with the new MERLIN H2O maser data. The data were originally obtained and published by Torrelles et al.(1998a). We re-reduced the data following standard techniques within the AIPS software package. The flux calibration and astrometry of the resulting image compare very well with those presented by Torrelles et al.
We converted the radio continuum image to J2000 coordinates using the AIPS task “REGRD.” In performing the coordinate precession, we took care to correct for the fact that the B1950 VLA phase calibrator positions are given for equinox 1979.9 (e.g., Muxlow et al. 1995). The continuum image is included as an overlay in Figure 2.
3 Results
Figure 1 shows the spectrum of the calibrated visibility data. The spectrum is compatible with previous observations in the broadest sense: there are many narrow, bright maser features spread from 30 km s-1 to 0 km s-1. The spectrum does not agree in detail, however, owing to the rapid variability of the masers associated with Ceph A; factor-of-two variations occur on timescales as short as a few days (Rowland & Cohen 1986).
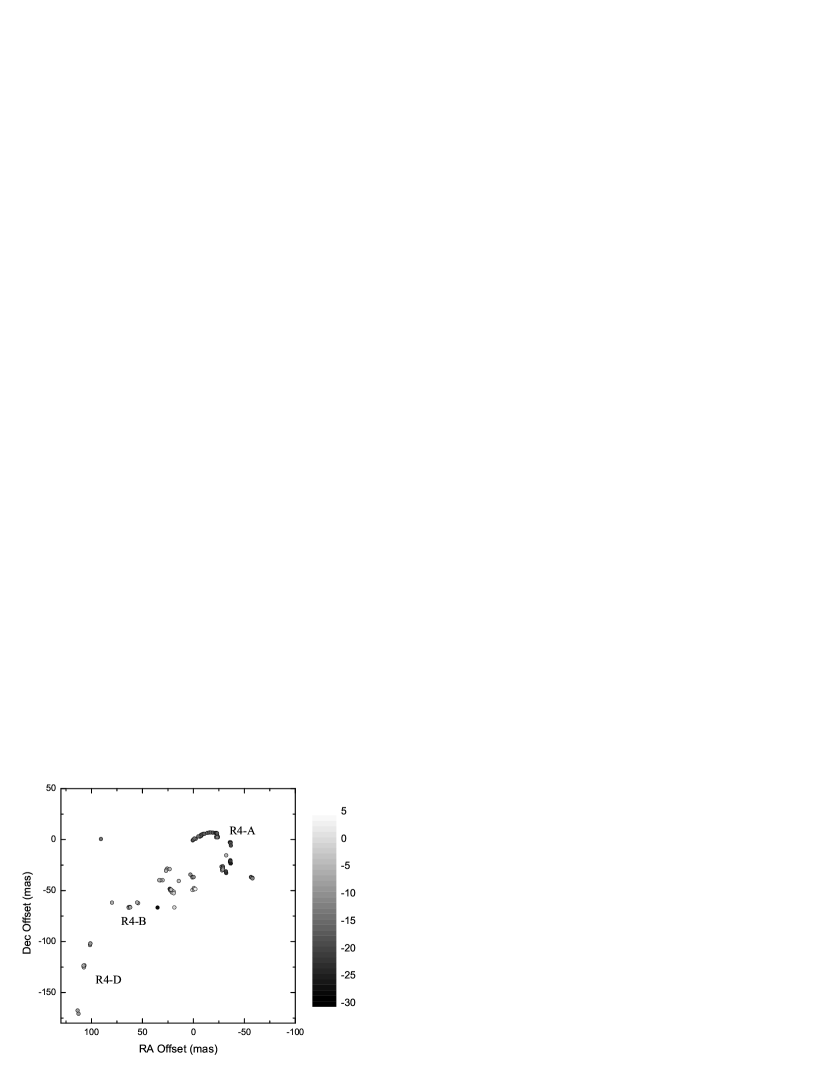
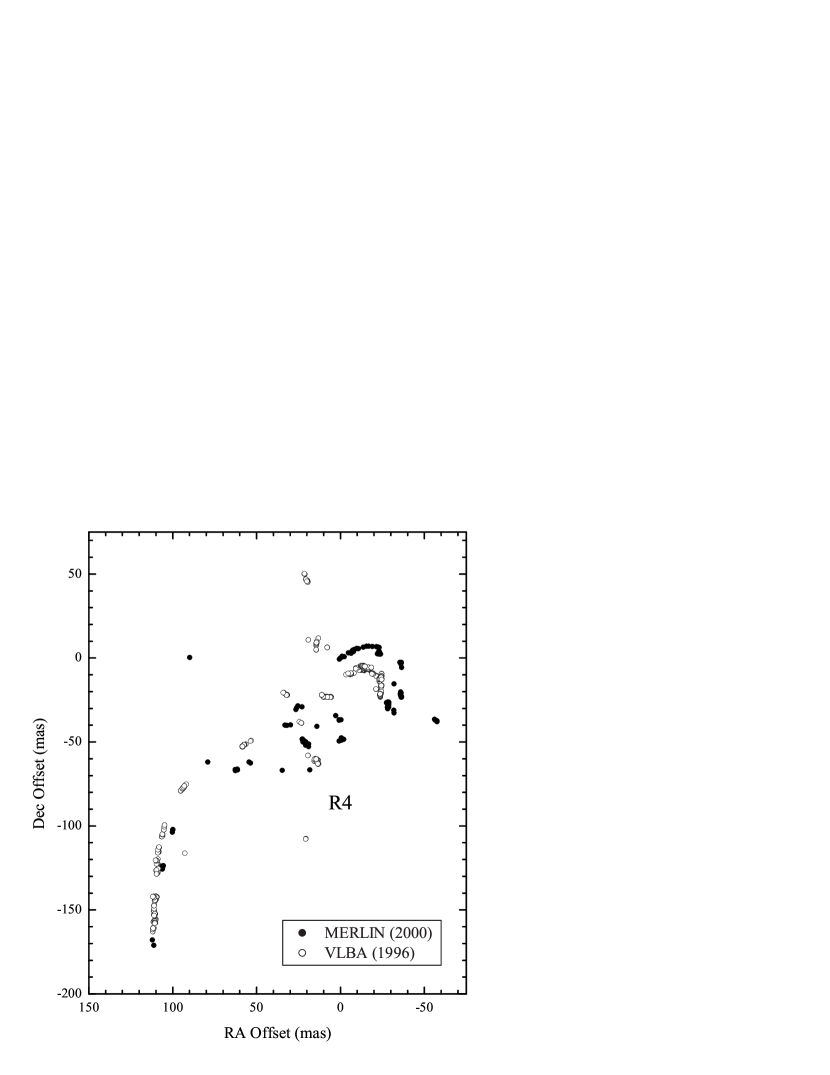
The distribution of maser spots relative to the position of the continuum source HW2 is plotted in Figure 2, and the distribution of maser spots in both position and (grayscale-coded) velocity is displayed in Figure 3. Excluding the R5 maser group, the spots spread over 1″ east-west and 0.5″ north-south. Looking at the data qualitatively, there is a broad trend of increasing velocity (blue-shifted to red-shifted) from east to west. These results compare favorably with the previous VLA observations of H2O masers in HW2 (Torrelles, et al. 1996) and the arcsecond-scale velocity gradient observed in SiO (2 1) (Gómez et al. 1999). The improved spatial and velocity resolution of the MERLIN data, however, reveals finer structure than could be mapped by the VLA. MERLIN resolves several arcuate groups of masers, including the R2 – R5 groups originally revealed by VLBA observations (Torrelles, et al. 2001a; Torrelles, et al. 2001b).
Torrelles et al. (2001a) presented details of only the blue-shifted masers associated with R4, and they measured a small proper motion away from the center of curvature. Accordingly, they interpreted the U-shaped structure as a bow shock caused by an outflow originating from a star near (in projection) to HW2 proper. The conditions within shocked molecular gas favor the generation of H2O masers (Elitzur, Hollenbach, & McKee 1989; Kaufman & Neufeld 1996), lending some support to this scenario. The MERLIN observations reveal a structure that is nearly ring-shaped (Figure 3). The velocity gradient of these brighter masers runs counter to the larger-scale gradient of the HW2 region: velocities increase from the northwest to the southeast along PA 140° (see the fitting analysis below and in Table 7). This velocity gradient and elliptical geometry suggest an alternative explanation: perhaps these R4 masers trace a rotating ring of molecular gas surrounding the unseen protostar. The ring is probably only an annular segment of a more extensive circumstellar disk. In the following section, we evaluate these two models in turn.
4 Models for the R4 Masers
4.1 Model 1: Expansion into a Static Medium (Bow Shock)
The R4-A masers, those making up the northwestern arc of R4 (see Figure 3), present the most clearly defined structure of the region. A bow shock would naturally explain the U-shape of the arcs (e.g., Raga & Böhm 1985; Raga 1986; Furuya et al. 2000) and the expansion of the R4-A structure, but it is not clear that bow shocks should produce the observed velocity gradient along the apparent major (outflow?) axis. The U-shape of a bow shock results from edge-brightening, which for masers would require radial velocity coherence for effective amplification. The challenge for the bow shock model, then, is to have the resulting line-of-sight velocity coherence naturally provide both the arcuate shape of the maser spot distribution and the observed radial velocity gradient along the symmetry (outflow) axis (see Figure 3).
We created a simple, parabolic shock front model to test this scenario. Following the formalism of Hartigan, Raymond, & Hartmann (1987) and Hartigan, Raymond, & Meaburn (1990), the geometry of the shock front is given by:
| (1) |
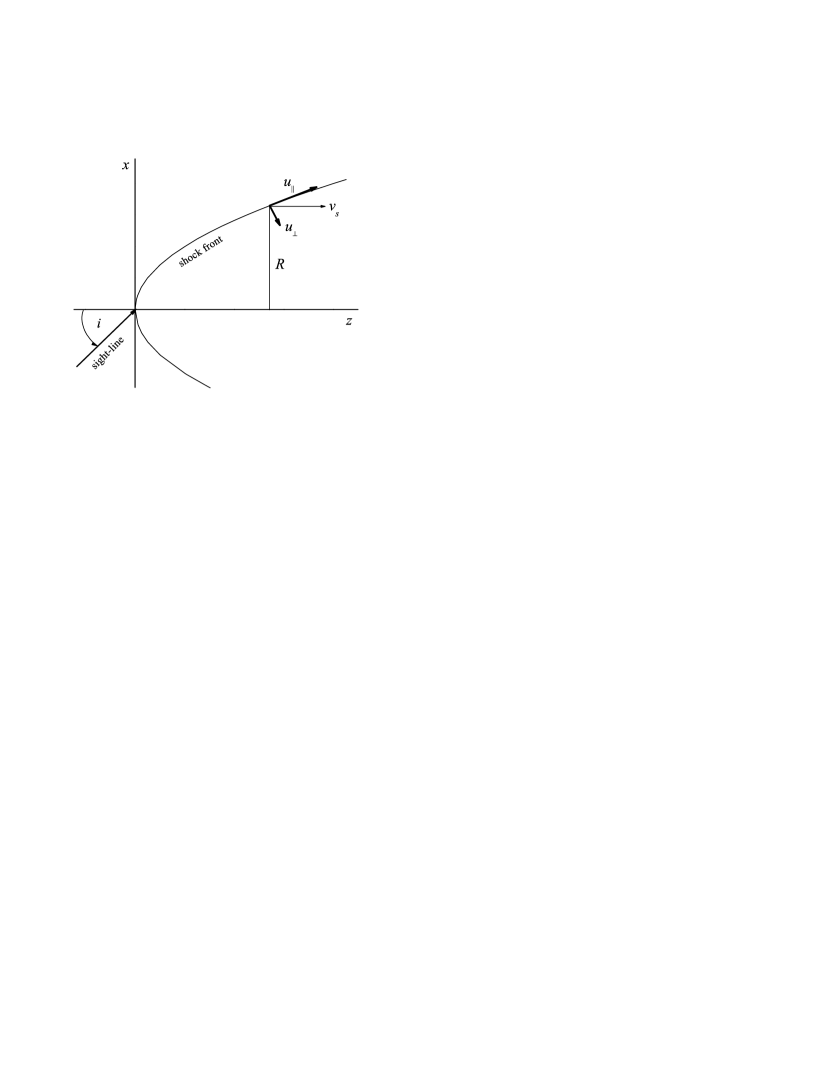
where is a shape parameter, is the position coordinate along the outflow axis, and and are the position coordinates orthogonal to the outflow axis; the sense of the coordinates is illustrated in Figure 4. As gas clouds fall into the shock, they are accelerated only along the direction normal to the surface of the shock. We will assume for this model that any bulk motions of the gas clouds are negligible compared to their motion into the shock front. To evaluate the kinematics of the maser spots, which trace the post-shock gas, we need first to decompose the pre-shock velocity into components perpendicular to the shock front and parallel to the shock front. The post-shock velocities can then be estimated using the Rankine-Hugoniot conditions. A more rigorous treatment would take into account hydromagnetic effects. At this stage, however, the goal is to evaluate coherence effects, and a more complex model is not warranted.
For the purpose of illustration, we assume isothermal (radiative) conditions for the shock. The actual conditions are probably closer to isothermal than adiabatic, because, in order to produce H2O masers, the pre-shock gas must already be dense, cm-3 (Elitzur, et al. 1989; Kaufman & Neufeld 1996). Based on the proper motion of the maser arc (see the discussion in § 4.2), the shock speed must be at least 13 km s-1, and so the immediate (adiabatic) post-shock temperatures are K (McKee & Hollenbach 1980). Under these conditions, the cooling time is only a few days, much shorter than the age of the maser arc. For the sake of completeness, it should be noted that an adiabatic shock model produces the same conclusions regarding radial velocity coherence; all that changes between the isothermal and adiabatic models is subtle, morphological details of the apparent structure of the shell.
In the reference frame of the observer (i.e., at rest with respect to the stationary, pre-shock gas), the post-shock velocity is
| (2) | |||||
where u and u are the velocity components of the post-shock gas in a coordinate system defined by the shock front (see Figure 4), is the shock speed, is the shape parameter defined above, and . Thanks to the symmetry of the problem, we can take the observer to be located at some distance away from the shock front but confined to the plane (positioning in is equivalent to an arbitrary rotation in PA). If the sight-line makes an angle with outflow axis such that is a pole-on view, the radial velocity of the post-shock gas is
| (3) |
where is the systemic velocity of the outflow source. For the purposes of simulating the maser arc, we estimated the velocity and shape parameters of the shock as follows. The maximum velocity of the R4 maser spots is 7 km s-1 relative to systemic. Again assuming a fully radiative shock, deprojection gives the shock velocity: km s-1 (in fact the proper motion argues for a shock speed of about 13 km s-1; however, the magnitude of shock speed does not affect the conclusions). The projected shape of the shock on the sky ( is related to the intrinsic shape () according to (Hartigan, et al. 1990). Based on a least-squares fit to the R4-A maser spot positions, we find (mas, which we used in our numerical models.
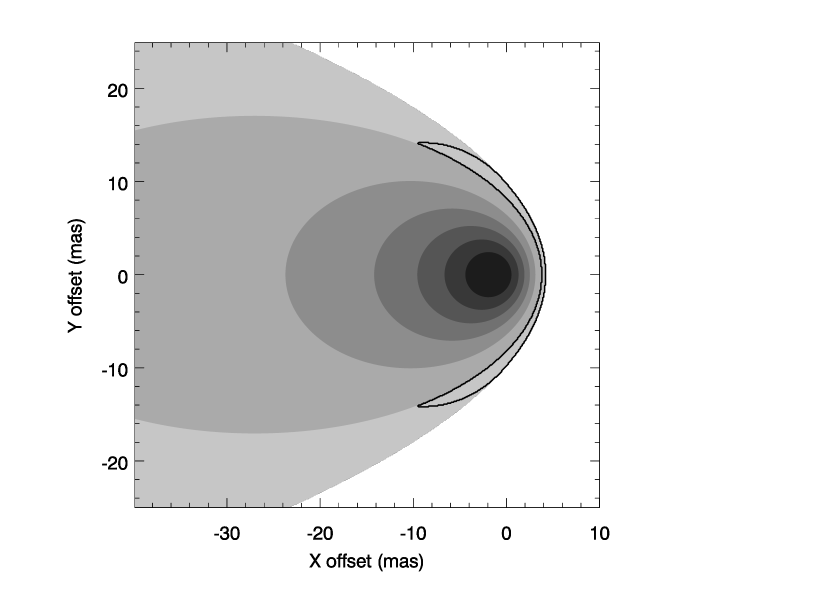
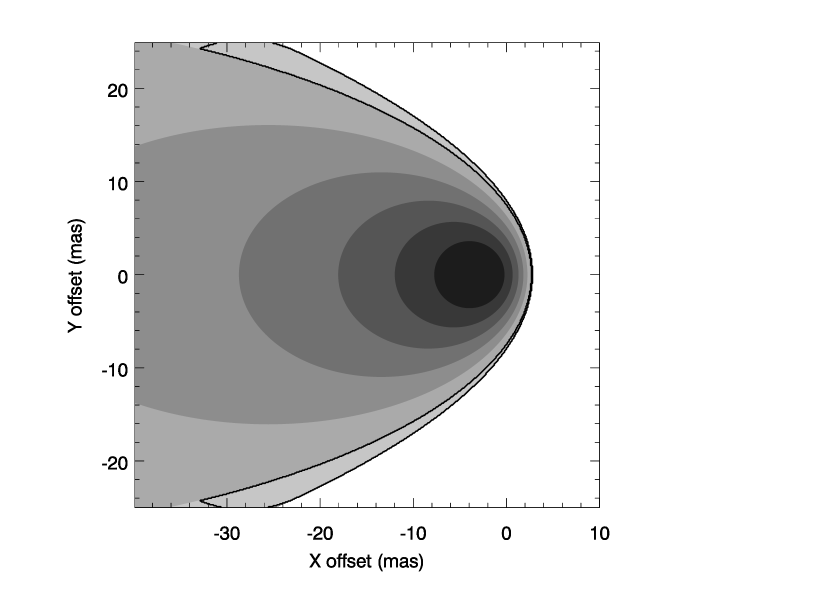
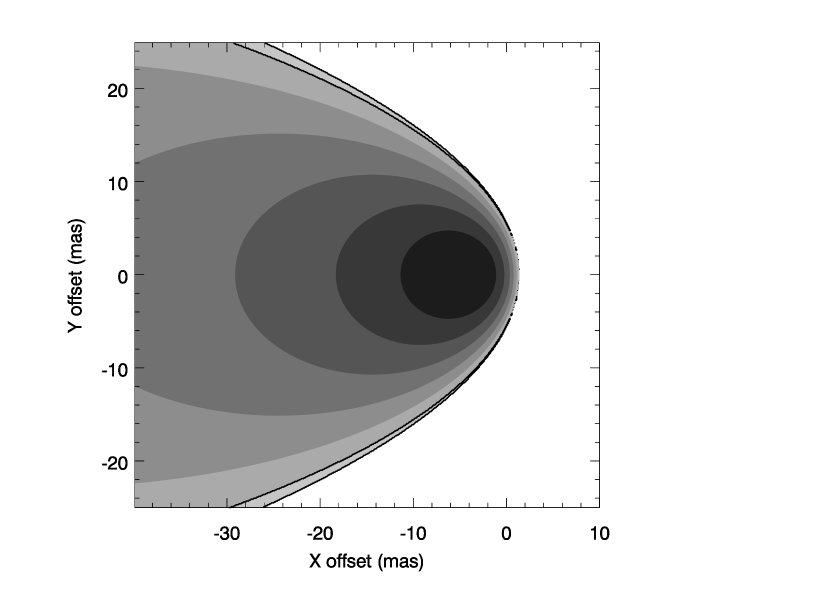
We applied Equation 3 and the constraints on and to a set of models in an effort to mimic the properties of the R4-A maser arc; the results are shown in Figure 5. In these models, the only free parameter is the inclination of the outflow axis with respect to the line of sight. We assumed that masers would arise only within the Mach angle (i.e., where the perpendicular speed of the shock front is supersonic). We further assumed that the masers occupy a thin shell, appropriate for the short cooling time. The masers are preferentially amplified when the velocity difference between the near and far sides of the thin maser shell is small.
The model maser regions plotted in Figure 5 are appropriate for a maximum velocity difference of 2 km s-1, chosen to provide a reasonable match to the spread of maser spots around the R4-A arc. Relaxing either the thin shell assumption or the velocity difference criterion broadens the projected shape of the maser region, but the resulting maser spot velocity gradient along the outflow axis would be unaffected. From inspection of Figure 5, it is clear that coherence effects naturally lead to edge-brightening and therefore can explain the U-shape of the R4 maser distribution. The model reasonably reproduces the extent of the R4-A arc. On the other hand, this simple bow shock model cannot reproduce the radial velocities of the maser spots. It seems that edge-brightening preferentially amplifies regions with radial velocities near the systemic velocity. In contrast, the maser spots show a systematic gradient of km s-1 along the inferred outflow axis with the maximum velocities near the apex of the U-shaped distribution. The kinematics of the maser spots are not well-described by this simple model of a bow shock propagating into a static medium, and it seems clear that the pre-shock gas must be undergoing some systematic bulk motion to explain the velocity gradient of the post-shock gas (i.e., the masers).
It is worth pointing out that changing the details of the shock model do not significantly affect the results. In any model involving a bow shock, the post-shock gas expands along and away from the outflow axis. Sight-lines nearer the outflow axis intercept gas approaching the observer on the near side and gas receding from the observer on the far side. Velocity coherence is therefore poor near the outflow axis. Sight-lines nearer the projected edge of the bow shock intercept gas moving more nearly in the plane of the sky whether on the near or far side. Radial velocities are therefore more coherent nearer the projected edges of a bow shock and lie close to the systemic velocity.
4.2 Model 2: Expansion into a Rotating Medium (Disk)
This model expands on the previous one and assumes that the pre-shock gas rotates around the source of an outflow or blastwave, presumably a protostar or a newly formed star. Whether the outflow is collimated or spherical, the rotational motion would be tangential to the strongest part of the shock front. The post-shock gas therefore largely retains the rotational component of motion and picks up an additional expansion component. There remains, however, the issue of the arcuate structure. Coherence effects only come into play if we observe the gas very near the equatorial plane of rotation, but an arbitrary geometry would not produce arcuate structure in this case. It seems likely, then, that the masers arise from dense, post-shock clumps of gas, without regard to larger-scale velocity coherence.
The simplest geometry that can produce the arcs is a spherical shockwave expanding into an inclined, rotating disk. (Supposing an asymmetric shockwave adds orientation parameters that we would be unable to constrain.) The blastwave shock-heats molecular material in the disk, leaving behind a temporary, patchy ring of maser emission (Elitzur, et al. 1989). To estimate the properties of the maser geometry subject to this blastwave and disk interpretation, we applied a tilted-ring model akin to that used for HI galactic velocity fields (Begeman 1989). To simplify the model and reduce the number of free parameters, we made the following constraints or assumptions. (1) The mass of the disk is much less than the mass of the central protostar, and therefore the rotation curve is Keplerian. (2) The position angle and inclination of the disk does not change significantly with radius and time (that is, there is little warping or precession between the 1996 and 2000). (3) The ring expansion velocities may have changed between epochs, perhaps as a result of mass-loading as disk material is swept up. (4) The central protostar has not significantly accelerated between epochs such that the systemic velocity of the disk has not changed. To accommodate these assumptions in practice, the model comprises four inclined rings, one for each epoch (three for the 1996 VLBA observations). Each ring is constrained to have the same inclination and position angle, a common central mass to determine the rotation speed of each ring, and two expansion velocities, one for the 1996 epochs and the other for the 2000 epoch. To be clear, the expansion velocities are based on a purely kinematical fit to the radial velocities of the masers. In the context of this model, the expansion velocities measure post-shock velocities in the disk gas rather than the motion of the blastwave proper.
Because the VLBA astrometry is referenced to a different sky position, we also separately fit the center positions of the VLBA and MERLIN data. Ultimately, we aligned the VLBA data to the MERLIN data assuming a common center for the R4 ring. This latter assumption, equivalent to an assumption of zero proper motion of the central protostar, does not affect the model per se, but it does provide an astrometric alignment between the data sets that can be checked for self-consistency. We will return to this astrometry check below.


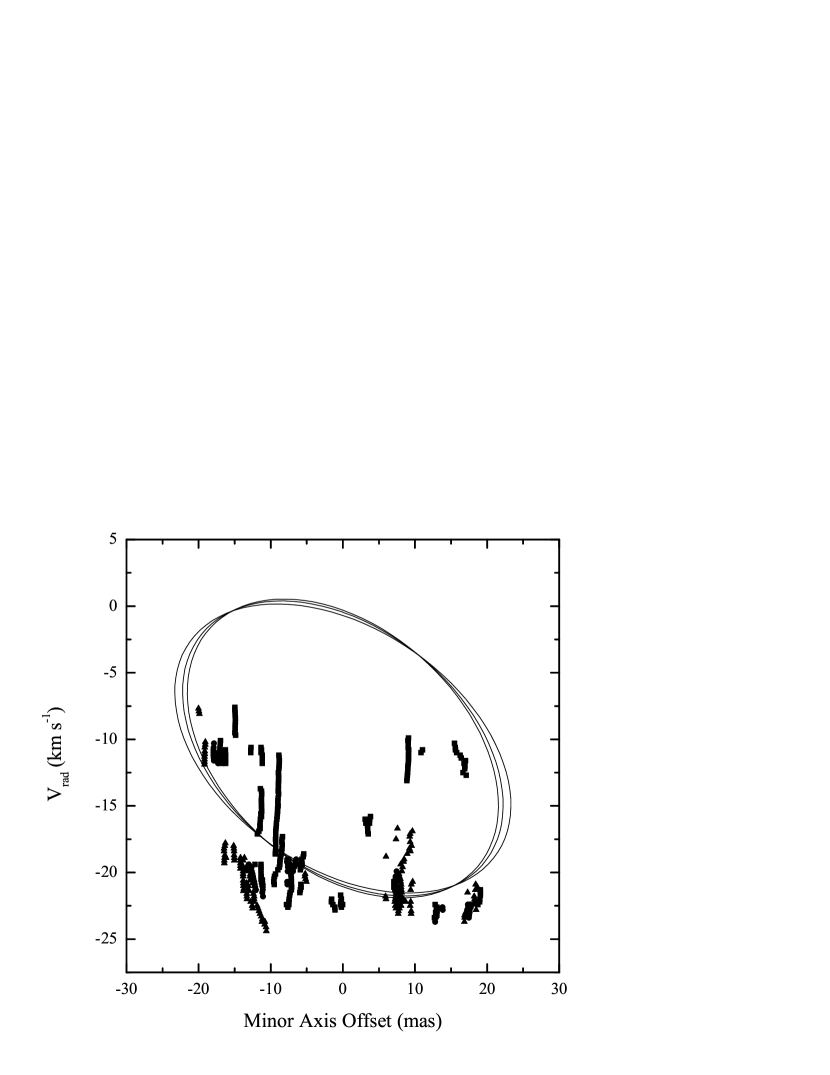
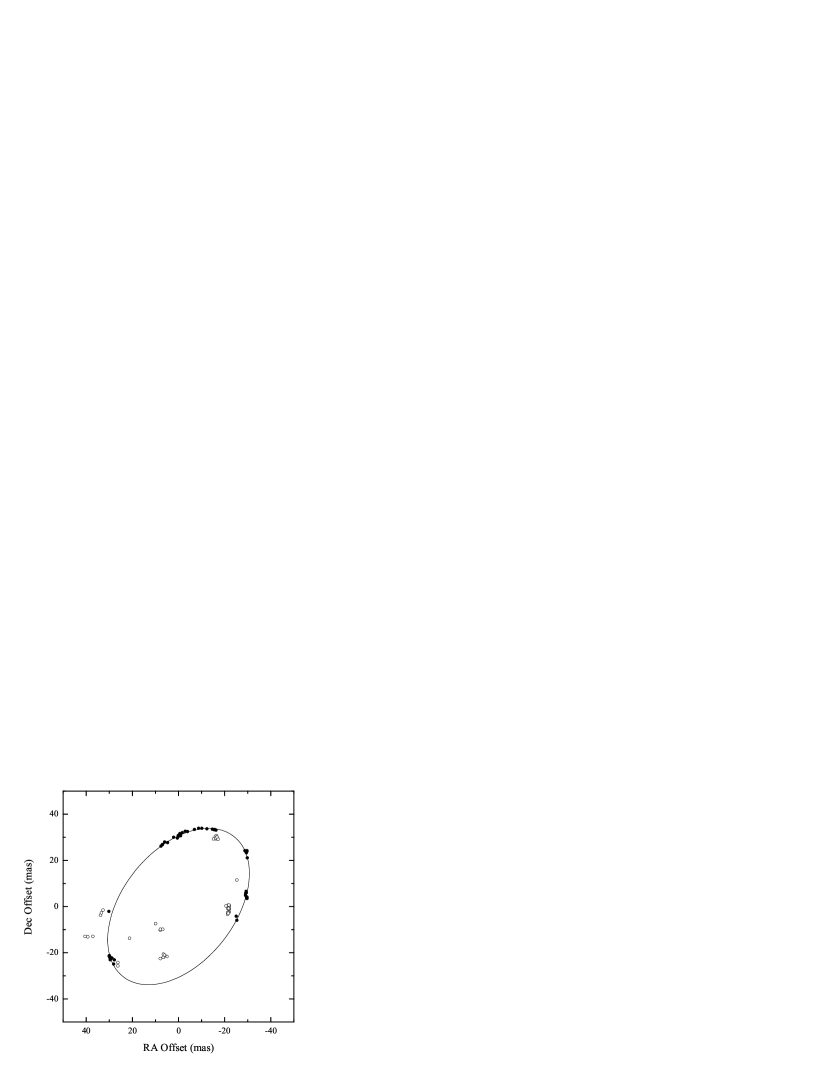
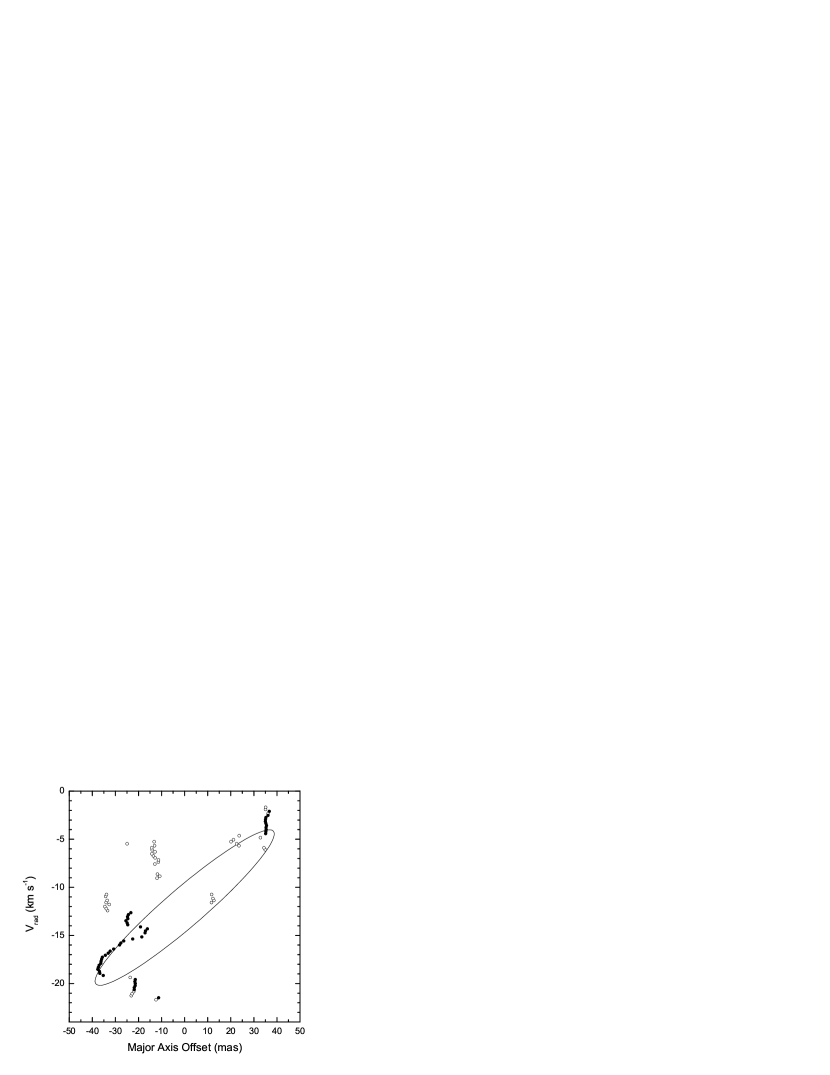
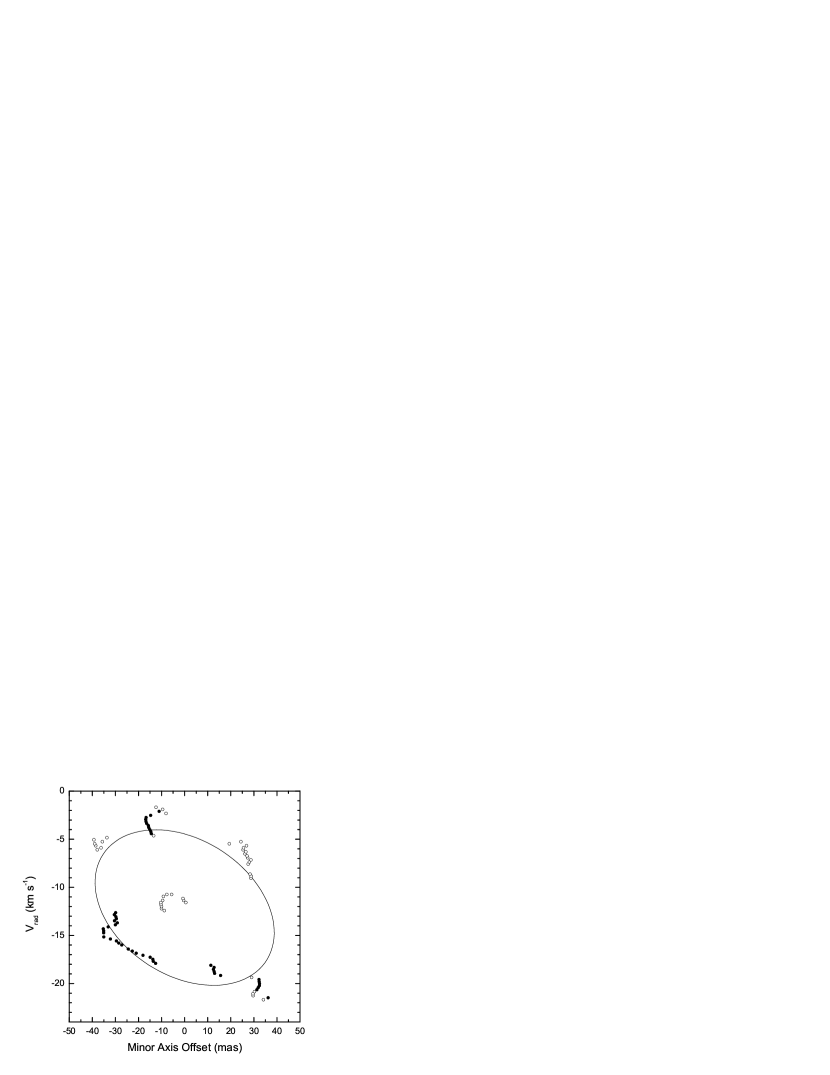
Fitting involved a non-linear least squares technique minimizing the difference between the model and data positions and velocities. Among the MERLIN data, many fainter maser spots clearly do not associate with the arcuate structure traced so clearly by the R4 masers. To remove these unassociated masers objectively, we repeated the fitting procedure after clipping data for which the deprojected radius disagreed with the best-fit ring radius by more than 3 , where was calculated by a quadratic sum of the model radius uncertainty and the data positional uncertainty. The results of this modeling for all free parameters are listed in Tables 7 and 7, and the sky and kinematical projections are presented in Figures 6 and 7 for the 1996 VLBA and 2000 MERLIN observations, respectively. The enclosed mass is 3.2 M ☉; a ZAMS star of this mass would be of spectral type A0 / B9 (de Jager & Nieuwenhuijzen 1987; Palla & Stahler 1993; Drilling & Landolt 2000).
Results of the rotating ring model fit to the R4 maser data.
| Parameter | Value | Units | ||
|---|---|---|---|---|
| RA offset | 0.1 | mas | ||
| Dec offset | 0.2 | mas | ||
| Inclination | 50 | 1 | degrees | |
| PA | 142 | 2 | degrees | |
| Sys. velocity | 0.5 | km s-1 | ||
| (1996) | 5.5 | 0.5 | km s-1 | |
| (2000) | 5.3 | 0.5 | km s-1 | |
| Central mass | 3.2 | 0.2 | M ☉ | |
Table 1 Comments: Position offsets refer to the location of the center of the ring and are referenced to the position of the brightest maser: (2000) = 22h 56m 179807, (2000) = +62°01′49429 (accurate to about 12 mas). The best fit radii are listed in Table 7.
Best fit radii for the rotating ring model fits to the R4 maser data.
| Epoch | Radius (mas) | Radius (AU) | ||||
|---|---|---|---|---|---|---|
| 1996.12 | 21.6 | 0.2 | 15.7 | 0.1 | ||
| 1996.19 | 22.2 | 0.2 | 16.1 | 0.1 | ||
| 1996.28 | 23.3 | 0.2 | 16.9 | 0.1 | ||
| 2000.27 | 38.7 | 0.1 | 28.1 | 0.1 | ||
Figures 6 and 7 show that the expanding, rotating ring models describe well the velocity gradient and spot distribution; certainly, this disk interpretation provides a better match to the maser spot kinematics than does the bow shock model. The positions of most of the maser spots agree to within a few mas of the model ring positions. The average proper motion of the R4 arc, based on the increasing radius of curvature between 1996 and 2000 (Table 7), is mas yr-1 ( km s-1). The radial velocities generally agree to within 5 km s-1. The scatter of the velocity residuals might be attributed to substructure in the shockwave and turbulence in the post-shock gas; such scatter is observed in masers associated with outflows (e.g., Elitzur 1992).
There remain, however, significant outliers in both position and velocity. It is difficult to account for large positional outliers in the context of this shockwave model. Masers lying within the ring radius for a given epoch may arise in clumps with longer post-shock relaxation times; masers outside the ring might be produced in a radiatively heated shock precursor region (Tarter & Welch 1986). Either explanation is unfortunately speculative and difficult to test owing to the small angular scale and high extinction of the region. On the other hand, the outliers may arise from clumps not physically associated with R4-A. Cepheus A is an active star forming region with many radio sources (Sargent 1977; Hughes & Wouterloot 1984b; Hughes, Cohen, & Garrington 1995); sight-lines to the R4 region may well intercept more than one system of maser spots.
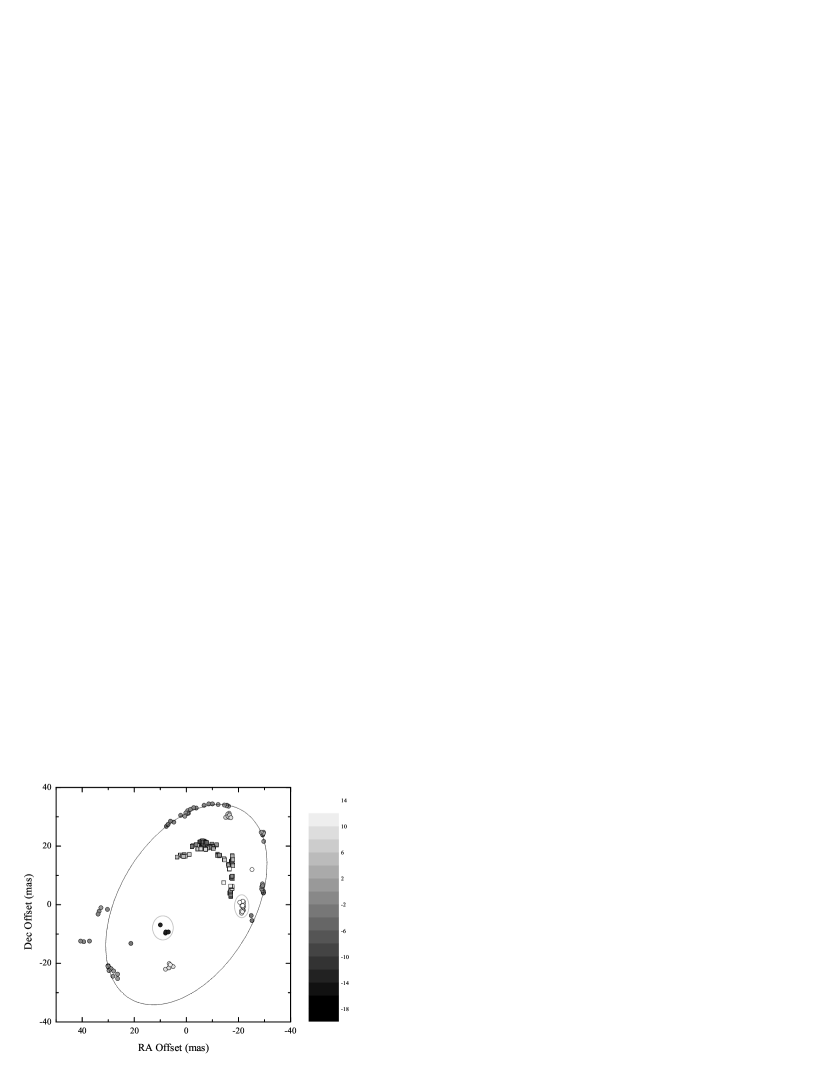
We investigated whether the MERLIN positional outliers might yet arise from the putative disk but at radii different from the shock ring. If the outliers are part of the disk, then their radial velocities should be compatible with the Keplerian rotation curve used to model the rings. We calculated the theoretical radial velocities at the positions of each of the R4 maser spots and subtracted the model velocities from the observed velocities. The resulting residual field is plotted in Figure 8. The velocity residuals of maser spots located on the rings are small, as would be expected from inspection of Figures 6 and 7. More interestingly, the velocity residuals of the maser spots not associated with rings are substantially reduced, a result arguing that most of the maser spots, whether on the ring for a given epoch or not, appear to be kinematically associated with R4.
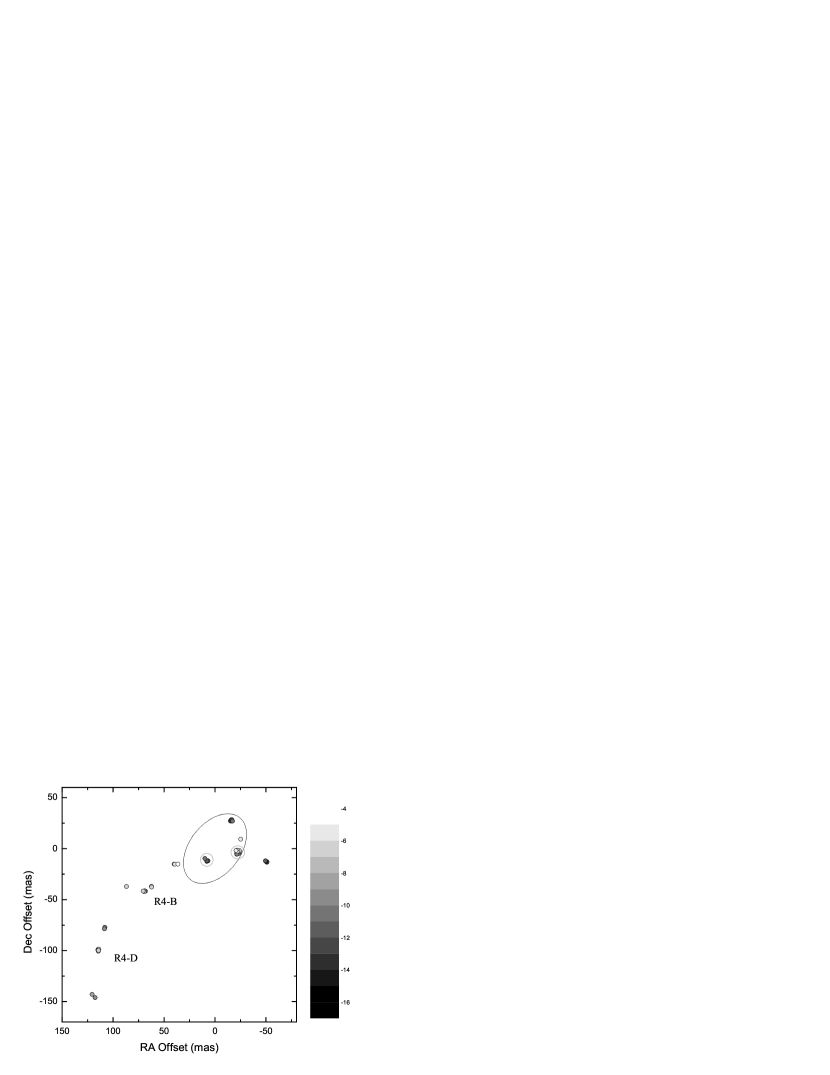
Two groups of R4 masers are glaring exceptions; these groups have been circled on Figure 8. Both groups have velocities that are too near systemic for their projected position onto the model disk, and, as such, show the largest velocity discrepancies with respect to the disk model. Their velocities are in better agreement with the range of velocities among the R4-B and R4-D masers, located southeast of the R4 rings and forming an apparent “tail” extending away from the R4 arc (see Figure 3). Figure 9 shows the kinematical distribution of the outlier maser spots with radial velocities in the range , i.e., the range of velocities spanned by the R4-B and R4-D masers. It is interesting to see that, with the ring masers removed, the outlier groups appear to align with a larger arc traced by the R4-B and R4-D masers and extending through the R4 ring. We can only speculate whether or not this arc is somehow associated with the R4 ring; it seems more likely that it is a separate maser arc that happens to lie near the same sight-line to the R4-A arc. Further observations may reveal whether these outlier groups, if they persist, participate in a systematic proper motion with the R4-B and R4-D masers.
4.3 Discussion of the Disk Model
The models described above are necessarily simplifications, but they provide the basic measurements of the expansion of the R4 masers needed to deduce some properties of the shockwave and the pre-shock gas. The disk model is somewhat limited by the assumption of spherical symmetry of the shockwave and cylindrical symmetry of the disk. Lacking additional data for the source of the shockwave, one might relax the condition of spherical symmetry and find a better fit to the data. For example, a more collimated outflow inclined into the plane of the disk might explain the lack of masers along the minor axis of the R4 maser distribution. The R4 maser spots sample the local kinematics unfortunately too sparsely to justify a more sophisticated model. It seems nevertheless likely that the shockwave must at least propagate directly along the projected major axis, and the properties of the spherical model apply to the shockwave along that axis.
Referring to Table 7, the length of the semi-major axis expanded by 11 AU between 1996 and 2000, corresponding to an average ring expansion speed of 13 km s-1. The expansion speed over the two months of VLBA observations is somewhat larger, roughly 30 – 40 km s-1 based on the proper motion between the 1996.12 and 1996.28 epochs, and so it seems the ring expansion has been decelerating. The cause of the deceleration may simply be mass-loading, analogous to the snowplow phase of a supernova shell, although scaled down in energy and momentum.
There are unfortunately insufficent data to fit even a uniform deceleration model believably; the simplest models (uniform deceleration and snowplow deceleration) have two free parameters, but there are only four data points. Nevertheless, to get an estimate of how much the expansion speed may differ from the 1996 – 2000 average speed, we fit a snowplow model (after Dyson & Williams 1997), appropriate for expansion into a dense medium, to the data in Table 7. We anchored the initial radius to 15.7 AU (the best-ring radius at epoch 1996.12) and allowed the initial velocity to vary. The best-fit initial velocity is km s-1, predicting an epoch 2000.27 velocity of km s-1. These values should be viewed with caution, of course, because the present data do not sufficiently sample the ring expansion well enough to support the snowplow model in particular. The snowplow model does however show that the expansion speed at epoch 2000.27 may differ from the average by nearly a factor of two.
Following the arguments of § 4.1, the ring expansion speed should be identically the shock speed. In the discussion to follow, we scale the shock speed to the average ring expansion speed, 13 km s-1, accepting that the instantaneous shock speed may be somewhat lower in the later epochs. Otherwise, equating the ring expansion speed and the shock speed is valid provided the cooling time does not significantly vary with distance from the source of the shockwave. It has been proposed that the conditions necessary for H2O maser emission may be caused either by fast, dissociative shocks (Elitzur, et al. 1989) or slow, non-dissociative hydromagnetic shocks (Kaufman & Neufeld 1996). We can rule out dissociative shocks for R4, which require . Our concern now is whether slower shocks through a protostellar disk could produce the observed high brightness temperatures.
Kaufman & Neufeld (1996) generated an array of shock models to calculate the efficiency of slow, C-type hydromagnetic shocks. They defined the efficiency as the ratio of the maser luminosity output divided by the total mechanical energy provided by the shock: , where is the luminosity of the (saturated) water maser, is the surface area of the maser source, is the pre-shock hydrogen density, and is the mean mass per hydrogen atom. The maximum maser luminosity occurs where the product is a maximum. Using and interpolating Figure 6 of Kaufman & Neufeld, the maximum luminosity occurs for , at which . The predicted luminosity is then where is the size of the maser cloud. The masers are probably beamed; we will make the simplifying assumption that the maser arises from a cylinder of cross-sectional diameter . Taking into account the correction for cylindrical beaming, an observer in the path of the beam would infer an isotropic luminosity:
| (4) |
VLBA measurements limit (Torrelles, et al. 2001a), giving
| (5) |
The flux density of the brightest R4 maser spot is 650 Jy in a 0.2 km s-1 channel. Assuming isotropic emission, the luminosity of any of the maser spots is therefore . The size of the maser cloud required by the Kaufman & Neufeld (1996) model is found by equating the observed and predicted maser luminosities: . It seems that the slow shocks model could plausibly produce the observed maser luminosities insofar as the inferred path length is less than 7% the radius of the disk. For comparison, the gas scale height derived assuming hydrostatic equilibrium (and neglecting self-gravity) is , where (Frank, King, & Raine 1992). Optical and infrared imaging of circumstellar disks in a variety of environments measure scale heights ranging from a few AU to tens of AU at comparable distances from the central star (e.g., Beckwith & Birk 1995; Stapelfeldt et al. 1998; Heap et al. 2000; Stapelfeldt 2000; Stapelfeldt et al. 2000).
The parameters of the shock model, taking into account the properties inferred from the Kaufman & Neufeld (1996) model, are sufficient to allow us to estimate the mass of the circumstellar disk. Assuming constant scale height, uniform density, and cylindrical symmetry, the disk mass is:
| (6) |
where we have normalized to the radius of curvature based on the MERLIN observations (Table 7). Note that the pre-shock density is optimized for the most luminous maser emission, as discussed above. Such a low disk mass is reminiscent of Vega-like debris disks, whose masses are in the few range (e.g., Sylvester & Skinner 1996). The disks surrounding young stars and protostars are measured to be (e.g., Hillenbrand et al. 1992; Chandler & Richer 1999 & references therein). Whereas it is tempting to infer that the R4 system might be more evolved than the surrounding protostars of the Ceph A region, it seems just as likely that the gas associated with R4 is very clumpy. Masers might then arise from relatively low density gas but are quenched in higher density regions. Nevertheless, the mass estimate is at least self-consistent with our original assumption of negligible disk mass. As the ring expands and traces out the rotation curve, future epochs of maser observations may place better dynamical constraints on the disk mass.
Based on the kinematic model fitting, the expansion velocity of the R4 maser spots is roughly 5 km s-1 (Table 7), which we interpret as the post-shock velocity. The difference between the shock velocity and post-shock velocity is somewhat surprising: a strong shock should produce post-shock velocities (McKee & Hollenbach 1980; Dyson & Williams 1997). Even allowing for deceleration, the velocity difference remains an issue for the 1996 epochs, during which the expansion speed is of order 40 km s-1, eight times the post-shock speed. Weakening the shock to , referenced to the average shock velocity, would drop the post-shock velocity to 5 km s-1 but implies pre-shock temperatures in order to raise the sound speed sufficiently. The pre-shock gas should be molecular to produce post-shock masers (Elitzur, et al. 1989; Kaufman & Neufeld 1996), and so we can rule this option out.
Another explanation of the low post-shock velocity is that the magnetic pressure of the post-shock gas may dominate the gas pressure (see Liljeström & Gwinn 2000 for an identical analysis of W49N). Magnetic field pressure inhibits compression of the post-shock gas, which, by conservation of momentum, increases the speed of the gas leaving the shock. To the observer, then, the effect is to reduce the post-shock velocity. In the limit where magnetic field pressure dominates gas pressure, the magnetic pressure balances the ram pressure of the pre-shock gas (Elitzur, et al. 1989; Kaufman & Neufeld 1996). The solution for the post-shock magnetic field strength in terms of the pre-shock gas density and shock velocity is:
| (7) |
In the frame of the shock, the pre-shock magnetic field is given by (Hollenbach & McKee 1979; Liljeström & Gwinn 2000):
| (8) | |||||
where parallel-line subscripts indicate components parallel to the shock front. A magnetic field strength of mG is plausible in comparison with more direct measurements of magnetic field strengths in similar astrophysical environments. For example, the magnetic field strengths associated with the OH masers of Cepheus A are a few mG (Wouterloot, Habing, & Herman 1980; Cohen, Brebner, & Potter 1990). Magnetic field strengths of 20 – 100 mG have been measured by observations of Zeeman splitting of H2O masers found in other star-forming regions (Fiebig & Guesten 1989; Sarma, Troland, & Romney 2001). Measuring Zeeman splitting of the H30 recombination line, Thum & Morris (1999) measured a field strength of 22 mG in the corona of the circumstellar disk of MWC 349.
5 Proper Motions of the R2, R3, and R5 Maser Regions
The four-year separation between the VLBA and MERLIN observations affords an opportunity to study proper motions over the entire HW2 region. Unfortunately, the 1996 VLBA observations and the present, 2000 MERLIN observations are referenced to different maser spots, and furthermore the 1996 VLBA data are not phase-referenced to a fixed calibrator position. We can use, however, the proper motions of the R4 masers to calculate a bootstrapped astrometry between the data sets. Based on the increasing radius of curvature of the R4-A masers (and irrespective of the actual nature of the R4 masers, whether disk or outflow or other), it seems clear that the R4-A region is expanding away from some common center.
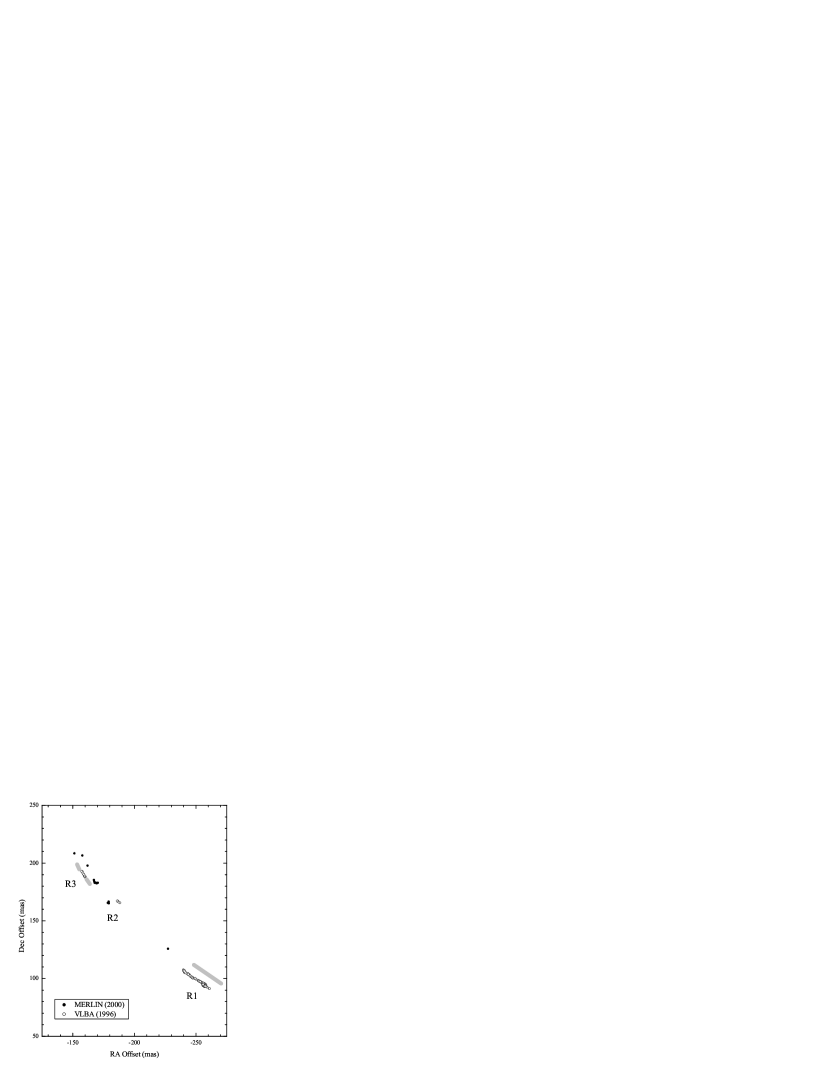
As a first guess, we assume that proper motion of the R4 expansion center is negligible. Figures 10–12 plot the relative positions of the MERLIN and VLBA data for the regions R1–R5. The MERLIN positions of the R2 and R3 maser spots are displaced by roughly 5 mas to the west of the positions predicted by the proper motions measured by Torrelles et al. (2001a), but the declination alignment is somewhat better. From inspection of Figures 4 and 8 of Torrelles et al., the proper motion uncertainties are probably of order 1 mas yr-1, which propagates to 4 mas between the MERLIN and VLBA data sets. It is therefore unclear whether the displacement might owe to proper motion of the R2 and R3 spots, proper motion of the R4 spots, which were used as the astrometric reference, or both. Follow-up, phase-referenced MERLIN observations should answer this question.
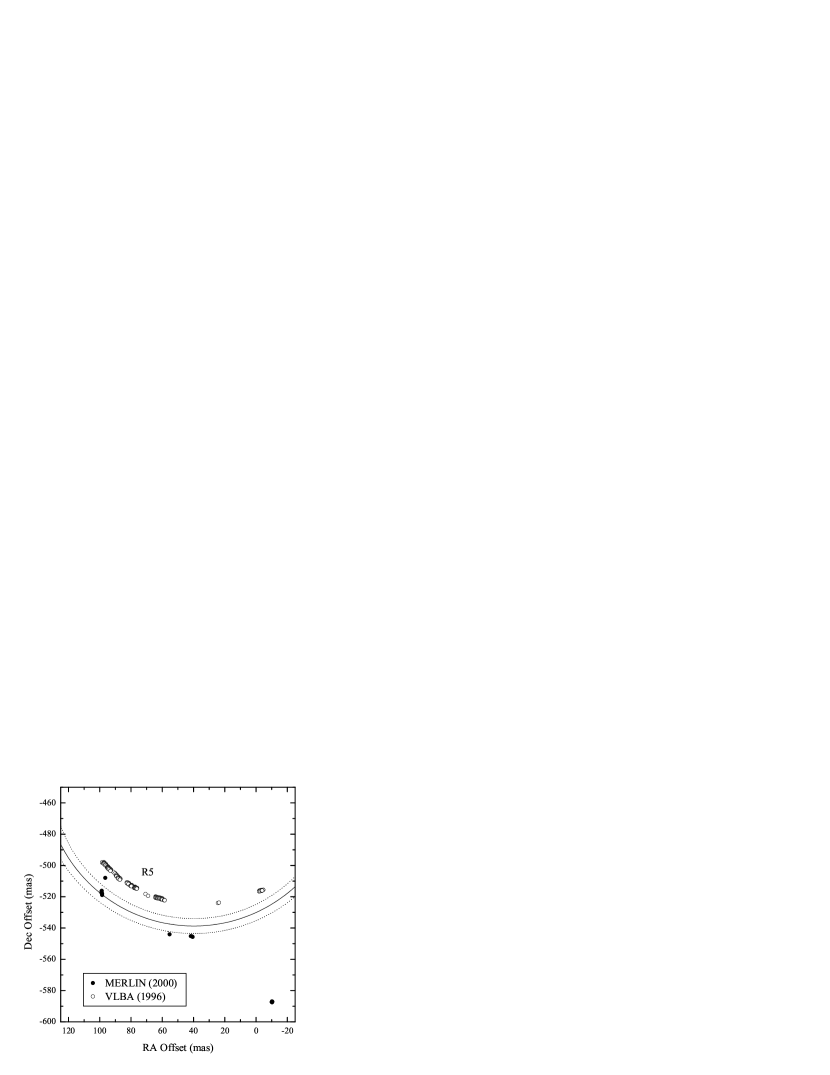
Torrelles et al. (2001b) emphasized the circular symmetry of the R5 region and its apparent radial expansion over the 2 months spanned by the VLBA observations. We re-measured the proper motion of the R5 structure by fitting circles separately to each VLBA epoch. The R5 ring expands at a rate of 2.5 0.1 mas yr-1 (8.6 0.3 km s, and the expansion center moves at 1.4 0.1 mas yr-1 (4.8 0.3 km s towards P.A. . For comparison, Torrelles et al. reported an expansion speed of 9 km s-1 and center motion of 6 km s-1 into PA .
We calculated the location and geometry of the R5 arc as it should have appeared for the (2000) MERLIN observations based on the expansion measured by the (1996) VLBA observations; the results are plotted in Figure 12. Six out of the ten R5 maser spots detected by MERLIN fall within the predicted range of sky offsets, and four are displaced south of the prediction band by mas. We judge this agreement to be very good, considering the uncertainty in predicting four years of proper motion on the basis of two months of monitoring. Based on the acceptable agreement for the R2, R3, and R5 masers, the original assumption for the astrometry bootstrap, namely, negligible proper motion of the R4-A curvature center, seems reasonable.
The argument can be reversed to constrain the proper motion of the R4 masers. Based on the 5 mas western displacement of the R2 and R3 masers, . The southern displacement of the R5 masers gives . Taking these values as a limit on the motion of the astrometric reference, the proper motion of the R4 expansion center must be less than 1.4 mas yr-1 (5 km s.
6 Summary and Discussion
The simplest explanation for the expansion of the R4 maser arcs appears to be a “slow,” C-type hydromagnetic shockwave propagating through a rotating, circumstellar disk surrounding a forming or young A0 / B9 star. Owing, in part, to the high extinction towards this region, the central star has yet to be identified at any waveband (HW2 itself has only been identified in radio continuum). It is therefore difficult to measure or constrain any other properties of the young star and its associated shock except for what we have learned from the maser kinematics.
The YSO IRAS 21391+5802 shows a similar, but smaller ( AU diameter) ring of masers, which presumably surround the young star (Patel et al. 2000). In that source, the masers seem to occur at the dust condensation radius of a radial outflow from the YSO. As the molecular gas flows outward from the dust condensation front, the gas cools, and the masers associated with that material fade out. The maser ring persists as fresh material enters the dust condensation front. This model predicts that the diameter of the maser spot distribution should not change, however, in contrast to the appearance of the R4 maser arcs, and furthermore the model predicts no strong velocity gradient around the ring. The R4 maser arcs are furthermore non-circular and much larger, extending well outside the dust condensation radius (the masses of the two YSOs are similar). It seems that, in contrast to IRAS 21391+5802, the R4 arcs cannot be explained as a standing feature of a steady outflow; the maser properties are better described by gas responding to a shockwave radially propagating through a rotating medium.
The origin of the shockwave is unclear. One possibility might be colliding spiral shocks, or other arcuate structure, forming as the result of disk instabilities; for example, Durisen et al. (2001) proposed this scenario to explain the occurrence of methanol masers in protostellar disks. Disk and pattern rotation would alter the shape of the maser arc over time, but it does not seem likely that spiral shocks would produce the observed, outward propagation of the R4 maser arcs, nor should they produce the increasing radius of curvature. Spiral shock models also require that the disk is viewed nearly edge-on for significant amplification (Maoz & McKee 1998), but it seems that the R4 arcs are viewed at an intermediate inclination.
A more promising explanation is provided by the work of Tscharnuter, Boss, & collaborators (Morfill, Tscharnuter, & Völk 1985; Tscharnuter 1987; Boss 1989). Using hydrodynamical simulations, they have demonstrated that a collapsing cloud core can become unstable to large oscillations owing to the thermodynamics of molecular hydrogen dissociation and reassociation. As the protostar core forms, this “hiccup” instability can drive AU-scale, radial outflows of order 10 km s-1 (Boss 1989), comparable to the outward proper motion of the R4 maser arcs. The hiccups recur as infalling material drives the protostar again to instability. Balluch (1988) argued that this cycle of instability proceeds for at least hundreds of years (i.e., at least as long as the simulated duration of the numerical models). We speculate that perhaps the disk associated with the R4 masers may be responding to this sort of instability of the protostar. It is difficult to evaluate the energetics involved based on the simulations that have been published to date, and we are unaware of any work modeling the impact of the hiccup instability on a surrounding protostellar disk; such analysis is beyond the scope of the present work. In addition, the hiccup models require fairly high infall rates, which we do not have the data to justify in the case of the R4-A masers. As was pointed out by Torrelles et al. (2001a; 2001b) in their discussion of the neighboring maser source R5, the origin of disk masers is yet poorly understood. Our shock interpretation argues for more work towards understanding instabilities in protostars and the impact of such instabilities on circumstellar disks.
References
- (1)
- (2) Balluch, M. 1988, A&A, 30, 423
- (3)
- (4) Beckwith, S. V. W., & Birk, C. C. 1995, ApJ, 449, L59
- (5)
- (6) Begeman, K. G. 1989, A&A, 223, 47
- (7)
- (8) Berulis, I. I., Lekht, E. E., & Mendoza-Torres, E. J. 1998, Astronomy Reports, 42, 465
- (9)
- (10) Boss, A. 1989, ApJ, 346, 336
- (11)
- (12) Cesaroni, R. 1990, A&A, 233, 513
- (13)
- (14) Chandler, C. J., & Richer, J. S. 1999, in Astrophysical Disks, ed. J. A. Sellwood & J. Goodman (ASP Conf. Series: San Francisco), 91
- (15)
- (16) Clark, B. G. 1980, A&A, 89, 377
- (17)
- (18) Claussen, M. J. 2001. in Cosmic Masers: from Protostars to Black Holes, IAU Symp. 206, Water Masers and the Near-Stellar Environment, ed. V. Migenes & E. Luedke (San Franscisco: ASP Conference Series)
- (19)
- (20) Claussen, M. J., Marvel, K. B., Wootten, A., & Wilking, B. A. 1998, ApJ, 507, L79
- (21)
- (22) Cohen, R. J., Brebner, G. C., & Potter, M. M. 1990, MNRAS, 246, 3P
- (23)
- (24) Curiel, S., et al. 2002, ApJ, 564, L35
- (25)
- (26) de Jager, C., & Nieuwenhuijzen, H. 1987, A&A, 177, 217
- (27)
- (28) Drilling, J. S., & Landolt, A. U. 2000, in Allen’s Astrophysical Quantities, ed. A. N. Cox (New York: AIP Press, Springer), 381
- (29)
- (30) Durisen, R. H., Mejia, A. C., Pickett, B. K., & Hartquist, T. W. 2001, ApJ, 563, L157
- (31)
- (32) Dyson, J. E., & Williams, D. A. 1997, The Physics of the Interstellar Medium (2nd ed.; London: Institute of Physics Publishing)
- (33)
- (34) Elitzur, M. 1992, ARA&A, 30, 75
- (35)
- (36) Elitzur, M., Hollenbach, D. J., & McKee, C. F. 1989, ApJ, 346, 983
- (37)
- (38) Fiebig, D., Duschl, W. J., Menten, K. M., & Tscharnuter, W. M. 1996, A&A, 310, 199
- (39)
- (40) Fiebig, D., & Guesten, R. 1989, A&A, 214, 333
- (41)
- (42) Frank, J., King, A., & Raine, D. 1992, Accretion Power in Astrophysics (Cambridge: CUP)
- (43)
- (44) Furuya, R. S., Kitamura, Y., Wootten, H. A., Claussen, M. J., Saito, M., Marvel, K. B., & Kawabe, R. 2000, ApJ, 542, L135
- (45)
- (46) Genzel, R., & Downes, D. 1977, A&AS, 30, 145
- (47)
- (48) Genzel, R., et al. 1981a, ApJ, 247, 1039
- (49)
- (50) Genzel, R., Reid, M. J., Moran, J. M., & Downes, D. 1981b, ApJ, 244, 884
- (51)
- (52) Gómez, J. F., Sargent, A. I., Torrelles, J. M., Ho, P. T. P., Rodríguez, L. F., Cantó, J., & Garay, G. 1999, ApJ, 514, 287
- (53)
- (54) Gwinn, C. R., Moran, J. M., & Reid, M. J. 1992, ApJ, 393, 149
- (55)
- (56) Hartigan, P., Raymond, J., & Hartmann, L. 1987, ApJ, 316, 323
- (57)
- (58) Hartigan, P., Raymond, J., & Meaburn, J. 1990, ApJ, 362, 624
- (59)
- (60) Heap, S. R., Lindler, D. J., Lanz, T. M., Cornett, R. H., Hubeny, I., Maran, S. P., & Woodgate, B. 2000, ApJ, 539, 435
- (61)
- (62) Hillenbrand, L. A., Strom, S. E., Vrba, F. J., & Keene, J. 1992, ApJ, 397, 613
- (63)
- (64) Högbom, J. A. 1974, A&AS, 15, 417
- (65)
- (66) Hollenbach, D., & McKee, C. F. 1979, ApJS, 41, 555
- (67)
- (68) Hughes, V. A., Cohen, R. J., & Garrington, S. 1995, MNRAS, 272, 469
- (69)
- (70) Hughes, V. A., & Wouterloot, J. G. A. 1984a, ApJ, 276, 204
- (71)
- (72) —. 1984b, ApJ, 276, 204
- (73)
- (74) Hunter, T. R., Testi, L., Zhang, Q., & Sridharan, T. K. 1999, AJ, 118, 477
- (75)
- (76) Johnson, H. L. 1957, ApJ, 126, 121
- (77)
- (78) Kaufman, M. J., & Neufeld, D. A. 1996, ApJ, 456, 250
- (79)
- (80) Lekht, E. E., & Sorochenko, R. L. 2001, Astronomy Reports, 45, 113
- (81)
- (82) Liljeström, T., & Gwinn, C. R. 2000, ApJ, 534, 781
- (83)
- (84) McCaughrean, M. 1997. in Planets Beyond the Solar System and the Next Generation of Space Missions, Protostars, Circumstellar Disks, and the Environments of Proto-Planetary Evolution, ed. D. Soderblom (San Francisco: ASP Conference Series), 53
- (85)
- (86) McKee, C. F., & Hollenbach, D. J. 1980, ARA&A, 18, 219
- (87)
- (88) Maoz, E., & McKee, C. F. 1998, ApJ, 494, 218
- (89)
- (90) Matveenko, L. I. 1987, Astronomicheskii Vestnik, 21, 308
- (91)
- (92) Matveenko, L. I., & Diamond, P. J. 2000, Astronomy Reports, 44, 592
- (93)
- (94) Morfill, G. E., Tscharnuter, W., & Völk, H. J. 1985, in Protostars and Planets II, ed. D. C. Black and M. S. Matthews (Tucson: University of Arizona Press), p. 493
- (95)
- (96) Muxlow, T. W. B., Pedlar, A., Holloway, A. J., Gallimore, J. F., & Antonucci, R. R. J. 1995, MNRAS, 278, 854
- (97)
- (98) Palla, F., & Stahler, S. W. 1993, ApJ, 418, 414
- (99)
- (100) Patel, N. A., Greenhill, L. J., Herrnstein, J., Zhang, Q., Moran, J. M., Ho, P. T. P., & Goldsmith, P. F. 2000, ApJ, 538, 268
- (101)
- (102) Patnaik, A. R., Browne, I. W. A., Wilkinson, P. N., & Wrobel, J. M. 1992, MNRAS, 254, 655
- (103)
- (104) Raga, A. C. 1986, AJ, 92, 637
- (105)
- (106) Raga, A. C., & Böhm, K.-H. 1985, ApJS, 58, 201
- (107)
- (108) Reid, M. J., & Moran, J. M. 1988, in Galactic and Extragalactic Radio Astronomy, eds. G. L. Verschuur, & K. I. Kellermann (New York: Springer-Verlag), 255
- (109)
- (110) Rodríguez, L. F., Anglada, G., Torrelles, J. M., Mendoza-Torres, J. E., Haschick, A. D., & Ho, P. T. P. 2002, A&A, 389, 572
- (111)
- (112) Rodriguez, L. F., Garay, G., Curiel, S., Ramirez, S., Torrelles, J. M., Gomez, Y., & Velazquez, A. 1994, ApJ, 430, L65
- (113)
- (114) Rowland, P. R., & Cohen, R. J. 1986, MNRAS, 220, 233
- (115)
- (116) Sargent, A. I. 1977, ApJ, 218, 736
- (117)
- (118) Sarma, A. P., Troland, T. H., & Romney, J. D. 2001, ApJ, 554, L217
- (119)
- (120) Schneps, M. H., Moran, J. M., Genzel, R., Reid, M. J., Lane, A. P., & Downes, D. 1981, ApJ, 249, 124
- (121)
- (122) Shepherd, D. S., & Kurtz, S. E. 1999, ApJ, 523, 690
- (123)
- (124) Shu, F. H., Adams, F. C., & Lizano, S. 1987, ARA&A, 25, 23
- (125)
- (126) Stapelfeldt, K. 2000. in IAU Symposium, Visions of Nature’s Planet Foundry: Imaging of Circumstellar Disks, 23
- (127)
- (128) Stapelfeldt, K. R., Krist, J. E., Menard, F., Bouvier, J., Padgett, D. L., & Burrows, C. J. 1998, ApJ, 502, L65
- (129)
- (130) Stapelfeldt, K. R., Menard, F., Brandner, W., Padgett, D. L., Krist, J. E., & Watson, A. M. 2000, BAAS, 197
- (131)
- (132) Sylvester, R. J., & Skinner, C. J. 1996, MNRAS, 28, 457
- (133)
- (134) Tarter, T. C., & Welch, W. J. 1986, ApJ, 305, 467
- (135)
- (136) Thum, C., & Morris, D. 1999, A&A, 344, 923
- (137)
- (138) Torrelles, J. M., Gómez, J. F., Garay, G., Rodríguez, L. F., Curiel, S., Cohen, R. J., & Ho, P. T. P. 1998a, ApJ, 509, 262
- (139)
- (140) Torrelles, J. M., Gómez, J. F., Rodríguez, L. F., Curiel, S., Anglada, G., & Ho, P. T. P. 1998b, ApJ, 505, 756
- (141)
- (142) Torrelles, J. M., Gomez, J. F., Rodriguez, L. F., Curiel, S., Ho, P. T. P., & Garay, G. 1996, ApJ, 457, L107
- (143)
- (144) Torrelles, J. M., et al. 2001a, ApJ, 560, 853
- (145)
- (146) —. 2001b, Nature, 411, 277
- (147)
- (148) Tscharnuter, W. M. 1987, in Physical Processes in Comets, Stars, and Active Galaxies (Lecture Notes in Physics), ed. E. Meyer-Hofmeister, H. C. Thomas, and W. Hillebrandt (Berlin: Springer-Verlag), 96
- (149)
- (150) Wouterloot, J. G. A., Habing, H. J., & Herman, J. 1980, A&A, 81, L11
- (151)