ROSAT-HRI investigation of the NGC 507 X-ray halo
Abstract
We present an X-ray investigation of the elliptical galaxy NGC 507 in the Pisces cluster. We make use of archival Rosat HRI and Chandra data, and of previously published PSPC data, to connect the large-scale structure of the halo to the core morphology. Our analysis, based on a bidimensional double Beta model of the halo surface brightness, shows that the halo core () and the external halo () are characterised by different dynamical properties and suggests a different origin of the two components. The halo core has a complex morphology with a main X-ray emission peak, coincident with the center of the optical galaxy, and several secondary peaks. The spatial and spectral analysis of the central peak shows that this feature is produced by denser hot gas in the galaxy core. While both homogeneous and inhomogeneous cooling flow models predict a deposited mass exceeding the observed amount, our data support the scenario where the gas is kinetically heated by stellar mass losses. Comparison with previously published studies suggest that the core of X-ray extended galaxies is associated to the stellar distribution and has similar properties to the X-ray halo of compact galaxies. The secondary peaks are due instead to interactions between the radio-emitting plasma and the surrounding ISM, producing density fluctuations in the hot gas. We found that the energy input by the central radio source in the ISM is large enough to prevent gas cooling and may explain the failure of the cooling flow models.
The total mass profile derived from the bidimensional model shows that a significant amount of dark matter is present at large radii. The dark halo extends on cluster scales and is likely associated with the whole cluster rather than with NGC 507. This structure is typical of many X-ray bright Early-Type galaxies and may explain the spatial and spectral differences with X-ray compact galaxies largely debated in literature. The large-scale surface brightness distribution is irregular and more extended in the North-East direction. The displacement of the cluster halo from the optical galaxy and the filamentary structures observed in the halo core further suggest that the galaxy may be slowly moving within the group potential.
Finally we found that of the sources detected by Kim & Fabbiano (1995) in the NGC 507 halo are due to point sources while the nature of the remaining population is not clear. If associated with NGC 507, they can be either accreting binaries hosting a massive black hole or density clumps of the X-ray halo.
1 INTRODUCTION
NGC 507 is the brightest member of a group of galaxies belonging to a poor system: the Pisces cluster. The latter in turn is part of the Perseus-Pisces supercluster (e.g. Wegner, Haynes & Giovanelli, 1993; Sakai, Giovanelli & Wegner, 1994), located at Mpc 111Assuming H km s-1 Mpc-1 from our galaxy (Huchra, Vogeley & Geller, 1999). NGC 507 is classified as E/S0 galaxy (de Vaucouleurs et al., 1991). González-Serrano & Carballo (2000) showed that, while the surface brightness profile follows a de Vaucouleur law out to from the galaxy center, at larger radii there is significant excess emission over the profile. Barton, de Carvalho & Geller (1998) studied the galaxy distribution in the surrounding of NGC 507 finding that it is part of a group including members.
The first studies in the X-ray band based on Einstein data (Kim, Fabbiano & Trinchieri, 1992a, b) measured a luminosity comparable to those of poor clusters ( ergs s-1) with a temperature keV at the 90% level, and suggested the presence of a cooler core. These findings where confirmed by the Position Sensitive Proportional Counter (PSPC) on the ROSAT satellite which revealed extended X-ray emission out to a radius of at least 16 arcmin. Kim & Fabbiano (1995) were able to resolve the cooler region within the central 150”, thus supporting the presence of a massive cooling flow, and suggested that cooling clumps may be distributed at large radii. They estimated a hot gas temperature keV with no sign of excess absorption over the galactic value. The data constrained the metallicity to be not higher than the solar one. Matsumoto et al. (1997) exploited the higher spectral resolution and larger energy range of the ASCA satellite to separate two distinct components in the NGC 507 X-ray spectrum: a soft thermal emission with keV and a harder component with keV probably due to unresolved discrete sources. The ASCA data seem to favour a subsolar metallicity of . The different metal abundance obtained by ROSAT and ASCA is explained in part by the new analysis performed by Buote (2000a) on the ROSAT PSPC data, which found a steep gradient in the metallicity profile of the hot halo.
NGC 507 is a radio galaxy with a steep radio spectrum and weak core (Colla, 1975; de Ruiter et al., 1986; Parma et al., 1986). It may be a source with particularly weak jets, or possibly a remnant of a radio galaxy whose nuclear engine is almost inactive and whose luminosity has decreased due to synchrotron or adiabatic losses (Fanti et al., 1987). Canosa et al. (1999) used the ROSAT HRI data to study the correlation between the radio and X-ray emission of a possible nuclear source, obtaining an upper limit for the nuclear X-ray flux which exceeds the expectation based on the radio data by more than two orders of magnitude.
In this work we use data collected by the ROSAT HRI to study the structure
of the NGC 507 hot halo. Our aim is to relate the large scale properties of
the gaseous halo to the small scale structure of the nuclear region. To this
end the HRI is an ideal instrument since it combines a large field of view
with a good angular resolution. We complete our analysis using the recent
Chandra ACIS-S observation to confirm the ROSAT results and to perform a
spectral analysis of the halo core. Our results are compared to those
obtained by other authors on several X-ray bright galaxies in the attempt to
explain the different properties of X-ray extended and compact galaxies.
Throughout this work we adopt km s-1 Mpc-1.
2 OBSERVATIONS AND DATA ANALYSIS
2.1 The Data
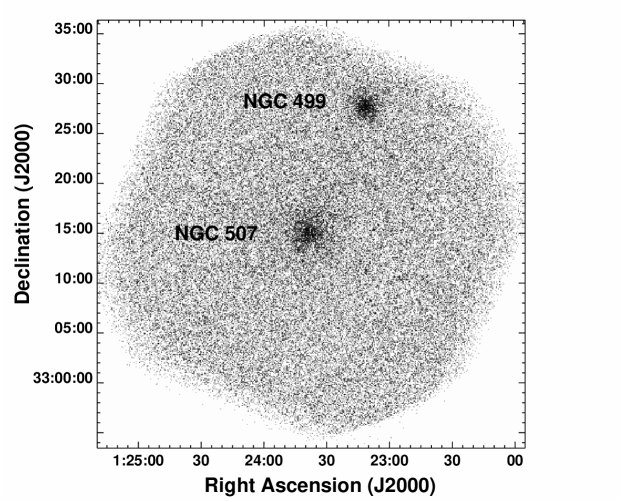
The NGC 507 field, including NGC 499, was observed on January 1995 with the ROSAT HRI (David et al., 1996) for a total time of ks (Table 1). The data, consisting of 2 Observing Intervals (OBI), were reduced with the SASS7_5 versions of the ROSAT standard analysis software (SASS). For our data analysis, we used the IRAF/XRAY and CIAO packages developed at the Smithsonian Astrophysical Observatory and at the Chandra X-ray Center (CXC), and other specific software as mentioned in the text.
To correct for the errors in the aspect time behaviour (Harris, 1999), which affects the HRI data processed with the SASS versions prior to SASS7_B of March 1999 (as it happens for our data), we run the correction routine ASPTIME (F. Primini 2000, private communication).
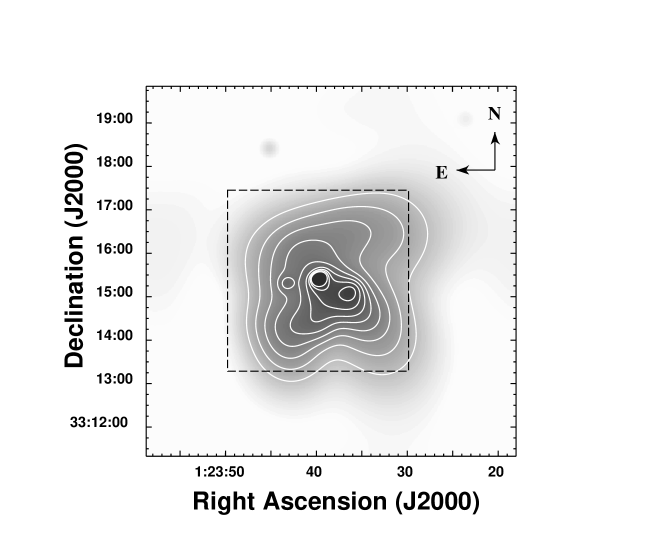
We further tried to correct for problems related to the spacecraft wobble (Harris et al., 1998); however the pointlike sources detected in our field ( 2.7) are not bright enough to allow an accurate determination of the X-ray centroid (crucial for the correction), when divided in time bins. Since the global PRF is FWHM we decided to use the uncorrected data. The HRI field of view (FOV) is shown in Figure 1.
We have run the software developed by Snowden et al. (1994, hereafter SMB), to produce an exposure map and a background map for our observation. We then corrected for exposure time and quantum efficiency variations across the detector by dividing the raw data by this exposure map.
2.2 Surface Brightness Distribution
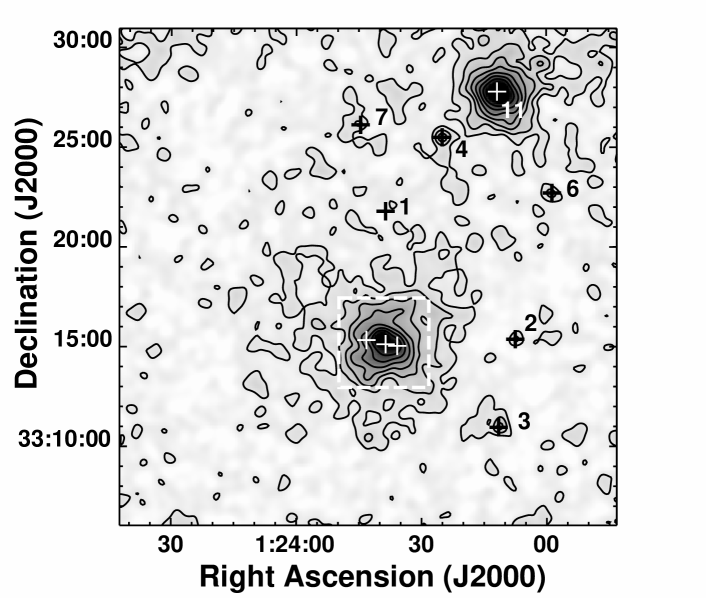
To study the surface brightness distribution of NGC 507 the exposure corrected data were rebinned in arcsec pixels and then convolved with a gaussian filter of (Figure 2). The resulting image shows the presence of an extended X-ray halo surrounding the galaxy. The central part of the halo (the one enclosed in the dashed box) is relatively symmetric but elongated in the NE-SW direction. Two filamentary structures seem to depart from the galactic center toward NW and SE respectively. The morphology of the outer halo () is very irregular due to the low S/N ratio of the HRI image. However there appears to be more emission on the North and East sides with respect to the South and West ones. This is confirmed by the radial profiles discussed in 2.5. In contrast with NGC 507, the NGC 499 halo is less extended and much more symmetric. The positions of the sources detected by the wavelets algorithm ( 2.7) and discussed in 2.7, are marked with crosses.
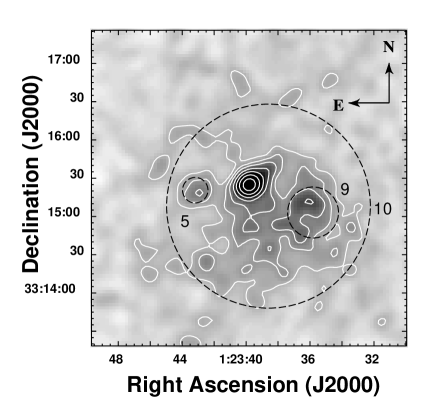
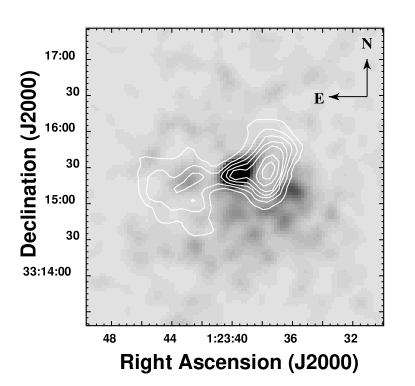
The detection of three distinct emission peaks (white crosses) in the core of the X-ray halo (dashed box in Figure 2) suggests a complex structure of the nuclear region. Examining this area in more detail (left panel of Figure 3), a number of interesting features can be detected: 1) a strong emission peak can be observed in the center of the X-ray halo; this peak is slightly elongated due to the presence of two ‘tails’ extending in the NW and the SE direction; 2) a secondary peak is visible West of the primary peak (source No.9); 3) a region of low X-ray brightness is interposed between the primary and secondary peak; 4) a third peak is visible East of the galaxy center (source No.5); 5) additional diffuse emission is present on the Southern side of the nucleus, making the surface brightness gradient flatter than on the Northern side.
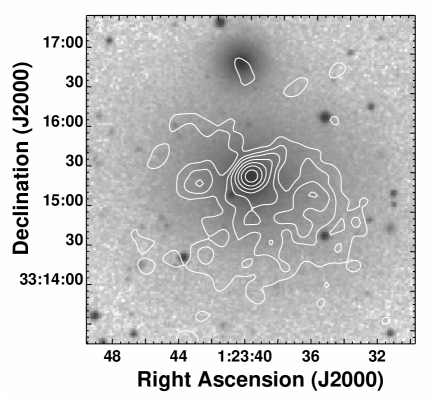
The main peak is almost coincident with the center of the optical galaxy (Figure 3, right panel). The second and third peak, instead, are not related to any optical feature, although being within the stellar body of the galaxy. There is also some faint emission coincident with the position of the elliptical galaxy NGC 508, located 1.5 arcmin North of NGC 507: this detection has a low statistical significance () but it is confirmed by the Chandra data analysis performed in 2.8.
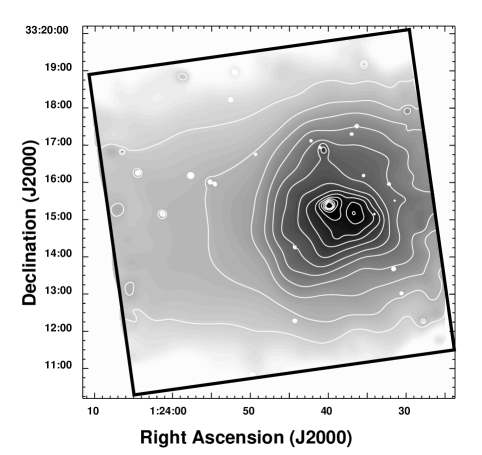
To reveal the presence of extended low S/N features we adaptively smoothed the HRI image with the csmooth algorithm, contained in the CIAO CXC package, which convolves the data with a gaussian of variable width (depending on the local signal to noise range of the image) so to enhance both small and large scale structures. In the resulting image (Figure 4), in addition to the three emission peaks mentioned before, we can distinguish an elongated tail extending on the North and bending Westwards out to (63 kpc 222At the the assumed distance of NGC 507, 1’=19.1 kpc), and an X-ray tongue protruding by (51 kpc) on the South-East side. These two features correspond to the filamentary structures visible also within the dashed box in Figure 2.
2.3 X-ray/Radio Comparison
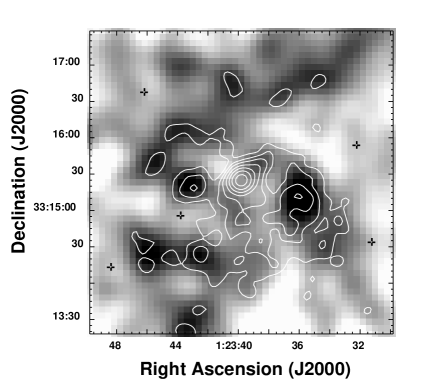
NGC 507 is known to be a weak radio source. In Figure 5 we superimpose the radio contours at 20 cm (Parma et al., 1986; de Ruiter et al., 1986) on the smoothed X-ray image.
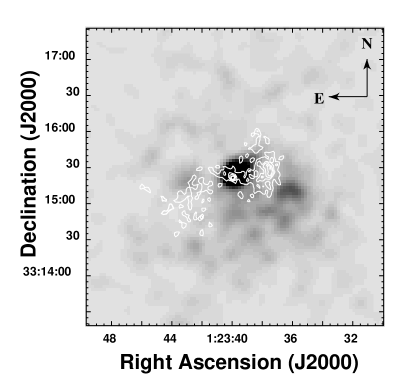
The nuclear radio source, visible in the high resolution map (right panel of Figure 5) is coincident with the position of the central X-ray peak. However it seems to be slightly displaced () toward the South-East edge of the peak. The radio jets/lobes appear aligned with the direction of the secondary X-ray peaks. The western jet appears to be collimated up to 10-15 arcsec ( kpc) and then expands in a large lobe. The latter is coincident with the region of low surface brightness described in 2.2. The higher resolution radio contours (Figure 5, right panel) reveal a very good agreement between the morphology of the Western lobe and the shape of the ‘cavity’. The secondary X-ray peak lies at the end of the radio lobe.
The correlation between the X-ray and radio surface brightness for the Eastern lobe, which is fainter than the Western one (27 mJy compared to 40 mJy at 1.4 GHz; de Ruiter et al., 1986) is only visible when we look at the high resolution map: the radio emission seems displaced South of the X-ray peak and falls in a region of low X-ray emission.
2.4 Bidimensional Halo Model
To study the complex structure of the inner halo of NGC 507 we built a bidimensional model using the Sherpa fitting software contained in the CIAO CXC package. The model was composed by adding together two bidimensional Beta components of the form:
| (1) |
where
| (2) |
and
| (3) |
| (4) |
where are the coordinates of the X-ray centroid, is the slope of the surface brightness profile, is the core radius, is the ellipticity and is the position angle (P.A.). The two components represent respectively the central X-ray peak and the extended X-ray halo. The 2D model was convolved with the HRI PRF (David et al., 1996) and then fitted on the exposure corrected HRI image. To model simultaneously small and large scale components, we fitted the extended component on a arcsec pixel image and the central component on a higher resolution arcsec pixel image.
Table 2 shows the best-fit parameters of the bidimensional model. For the large scale, fit the ellipticity and the P.A. of the two components were fixed to 0 because of the poor S/N ratio of the HRI image at large radii. For the central component fit leaving these two parameters free to vary yields , , and results in minor changes on the slope () and the core radius (). The central component is thus elongated in the NW-SE direction, as expected from the presence of the nuclear ‘tails’ ( 2.2). The centroid of the extended component is displaced by (7 kpc) South-West of the central emission peak (Figure 6, left panel); this is in agreement with the position of source No.10 detected by the wavelets algorithm (left panel of Figure 3) which corresponds to the centroid of the large-scale X-ray distribution. The best-values and of the extended component are consistent within 1 with those found by Kim & Fabbiano (1995); however our core radius is slightly larger due to the fact that we have separated the contribution of the central peak.
In the right panel of Figure 6 we show the residuals of the bidimensional model. Most of the structure already discussed in 2.2 is clearly visible, in particular we can distinguish the secondary peaks and the X-ray excess, located on the NW side of the central peak, corresponding to the nuclear ‘tail’. On the Northern side of the halo there is an elongated X-ray feature corresponding to the Northern tail already seen in the adaptively smoothed image of Figure 4.
2.5 Radial Brightness Profiles
To study quantitatively the hot halo of NGC 507 we derived radial profiles of the X-ray surface brightness. We binned the X-ray counts in 2 arcsec annuli, centered on the main X-ray peak, up to 20 arcsec and in 10 arcsec annuli at larger radii. This allows to both exploit the HRI resolution in the inner regions, where the X-ray emission is stronger, and to have a good S/N ratio in the outer regions. The brightness profile is shown in Figure 7 as a thin continuous line.
To derive the instrumental background level we used the background map produced by the SMB software (dot-dashed line in Figure 7). Since the latter may be a poor representation of the actual background when an extended source is present in the field (see for instance Paolillo et al., 2002), we compared the HRI data with the PSPC profile obtained by Kim & Fabbiano (1995). The HRI profile was rebinned in 30 arcsec annuli to match the PSPC resolution and the SMB background was then rescaled to obtain the best agreement between the two profiles in the 100-500 arcsec range. The final adopted background (dashed line) is in close agreement with the flattening level of the HRI profile (i.e. the brightness level measured at radii arcsec), thus indicating that the measured background is dominated by the instrumental contribution expected when no source is present. Using this background determination we derived the background-subtracted profile shown as filled circles.
The inner 10 arcsec are dominated by the emission due to the central X-ray peak shown in left panel of Figure 3. Even though a comparison with the HRI PRF suggests that the peak is extended, taking into account the PRF uncertainties due to residual aspect problems (shaded region in Figure 7; David et al., 1996) and the asymmetries discussed below, we find that the central peak is marginally consistent with the presence of a pointlike nuclear source. However the analysis of the Chandra data ( 2.8) performed by Forman et al. (2001a) unambiguously show that the central component is extended.
Past 20 arcsec ( kpc) the X-ray profile flattens due to the presence of the extended component, and then decreases with a power-law profile for .
Figure 8 shows the model profile ( 2.4) – convolved with the HRI PRF – superimposed on the HRI data. The contribution of the two components are shown by the dashed and the dot-dashed line for the central and extended component respectively. The PSPC profile measured by Kim & Fabbiano (1995) is in very good agreement with the HRI data and shows that the halo brightness decreases as a power-law even outside the range covered by the HRI points. For comparison we also show the optical V band surface brightness profile measured by González-Serrano & Carballo (2000). We can see that in two regions, for and , the HRI counts are in slight excess with respect to those predicted by the bidimensional model. These excesses are due respectively to the presence of the nuclear tails discussed 2.2 and to the X-ray emission at the edge of the SW radio lobe.
We have shown in previous sections that the cluster component is perturbed by the radio emitting plasma and is displaced from the central peak. To evaluate the effect of these asymmetries on the extracted profile we compare, in Figure 9, the average () profile with the one extracted in the NE () quadrant, i.e. in the opposite direction of the cluster component centroid and where the influence of radio lobes is smaller. The comparison shows that the cluster component offset is responsible for the flattening of the X-ray profile in the range . For the X-ray profile is almost unchanged since the displacement is not relevant on large scales. We notice that this displacement affects the total profile but not those of the individual components. The consequences of this result will be discussed further in 2.6.
In 2.2 we noticed that at large radii () there seems to be more X-ray emission on the North and East side of NGC 507 than on the South and West ones. To verify this fact we derived X-ray surface brightness profiles in 2 regions: a North-East sector (P.A.) and a South-West one (P.A.), and extracted counts in 30” annuli centered on the X-ray centroid. The resulting profiles are shown in Figure 10. Past 200” the count rate in the North-East pie is systematically higher than the one in the SW pie, out to . This excess is significant at the level. For instead, the counts in the two pies are consistent within the errors.
To check if the observed excess in the NE sector is preferentially located within NGC 507 and NGC 499 we further divided the NE sector in two pies. We found that the behaviour of the radial profiles is essentially the same in the two subsections in which the NE pie was divided, thus indicating that the excess emission is distributed through all the NE region.
2.6 Density, Cooling Time and Mass Profiles
To derive the properties of the X-ray emitting gas we followed the method described by Kriss et al. (1983), deprojecting the measured emission in concentric shells. We use the model profile shown in Figure 8 , since the bidimensional model provides a satisfactory representation of the mean X-ray emission, as shown in 2.5. This approach does not account for the fluctuations in the X-ray surface brightness due to the interaction with the radio-emitting plasma, which are perturbing the X-ray halo within 1 arcmin and for the displacement of the central and extended components. However, since we are mainly interested in obtaining the average gas properties, we will use this approximation and point-out, in the following discussion, the effects due to the lack of smoothness and spherical symmetry.
We assume an isothermal temperature profile with keV and the cooling function given by Sarazin & White (1987). Moreover, since the temperature profile measured by Kim & Fabbiano (1995) shows the presence of a central temperature drop, we also used a lower temperature for the central component, obtaining an almost identical result. The deprojected electron density is shown in Figure 11.
Using this density profile we calculated the cooling time as a function of radius shown in Figure 12, where is the electron density, (Sarazin, 1988) and are the hydrogen and total density and is the cooling function. Our result is in good agreement with the Kim & Fabbiano (1995) estimate at large galactocentric distances () with minor differences due to their use of a non-isothermal temperature profile. At smaller radii our HRI data are able to sample the characteristics of the central component, whose cooling time is more than one order of magnitude smaller than that of the extended component. Both components, however, have cooling times smaller than the Hubble time ( yr) within the cooling radius (80 kpc). Figure 13 (left panel) shows the integrated gaseous mass as a function of radius. The gaseous mass, calculated from the gas density profile assuming cosmic abundances (Sarazin, 1988), yields M⊙ within 1000” (320 kpc). The contribution of the central component, which dominates the inner 15” (5 kpc), is estimated to be M⊙ at , representing of the total gaseous mass. In Figure 13 (left panel) we also plot the amount of mass expected to be injected by stellar mass losses in yrs using a mass-loss rate of M⊙/L⊙,B (Athey et al., 2002) and the optical profile shown in Figure 8.
The dependence of these results on the assumption of spherical symmetry was evaluated comparing the average gas properties to those derived using only the NE quadrant profile shown in Figure 9. The main differences (see crosses in Figures 11, 12 and 13, left panel) are seen in the 20-100 arcsec region where, using the NE profile, the ‘shoulder’ corresponding to the core radius of the extended component is smoother, thus decreasing the gas density and increasing the cooling time by . At larger radii the gas properties are almost unchanged since the displacement is not relevant on large scales.
The total mass profile, shown in Figure 13 (right panel), was calculated using the equation (Fabricant, Lecar & Gorenstein, 1980):
| (5) |
where is the mass contained within , is the gas temperature, and and are respectively the logarithmic gradients of the gas density and temperature.
We assumed three different temperature profiles: an isothermal profile at 1.1 keV, a linear fit keV ( is expressed in arcsec) to account for the temperature decline after , and a power law keV to fit the central temperature drop. Figure 13 (right panel) shows that the total mass profiles are weakly dependent on the assumed temperature profile, except in the inner 100” (32 kpc) where the central mass obtained accounting for the low central temperature is smaller. The shaded region represents the total stellar mass calculated from the surface brightness profile measured by González-Serrano & Carballo (2000) and assuming a M/L ratio ranging from 6 to 8 M⊙/L⊙.
For our mass profile is in good agreement with Kim & Fabbiano (1995) and suggests the presence of dark matter, since it exceeds the stellar mass estimate extrapolated from the optical profile measured by González-Serrano & Carballo (2000). For r the X-ray cumulative mass estimate yields an unphysical result: the total mass estimate is smaller than the stellar mass and the profile has a negative gradient for reaching a minimum at . This behaviour is due to the flattening of the density profile which produces a drop in the density derivative contained in equation (5). In fact, using the profile extracted in the NE quadrant (dashed line in Figure 13, right panel), the mass profile is almost in agreement with the stellar profile. Thus the lack of azimuthal symmetry around the central X-ray peak, produced by the offset between the central and extended components and by the perturbed gas distribution, suggest that equation (5) is no longer valid on scales smaller than 50” because the gas is not in hydrostatic equilibrium. The difficulties involved in deriving accurate mass profiles in the halo core from X-ray measurements have been already noticed in previous works (see for instance Brighenti & Mathews, 1997) and can be explained by the presence of non-gravitational effects such as those discussed in 3.3333 Within a few arcsec from the main emission peak we must also consider the influence of the PRF. Even if the bidimensional model accounts for instrumental effects, an accurate deconvolution is very difficult..
2.7 Discrete Sources
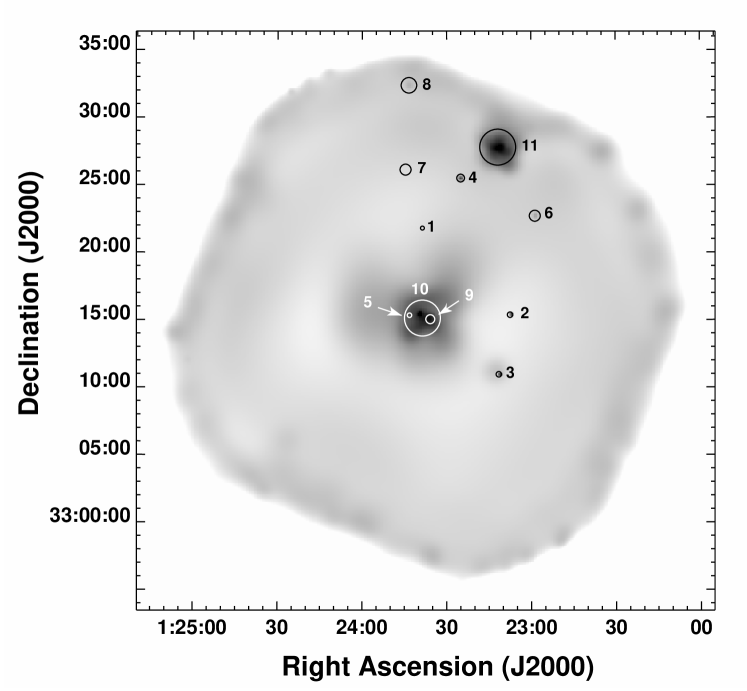
To study the population of discrete sources in the HRI field we used the wavelets algorithm developed by Damiani et al. (1997a, b). Using a S/N threshold of 4.2 (corresponding to a contamination of 1 spurious source per field; F.Damiani, private communication) the algorithm detected 11 sources shown in Figure 14. The properties of these sources, as measured by the wavelets algorithm, are reported in Table 3. Sources No.10 and 11 are missing from the table since they are NGC 507 and NGC 499. We also notice that sources No.5 and 9 correspond to the secondary central peaks discussed in 2.2.
To derive the X-ray fluxes we used the PIMMS software to calculate a conversion factor between the HRI count rate and the incident flux. We assumed a power law spectral model with photon index ( in Table 3) following the results of Hasinger et al. (1993) for faint sources, and a thermal spectrum with and abundance ( in Table 3) as found by Kim & Fabbiano (1995). Assuming a galactic absorption of cm-2 we obtain a conversion factor of 1 cps= ergs s-1 and 1 cps= ergs s-1 respectively in the 0.1-2.4 keV energy range.
In Table 4 we cross-correlate the sources detected in the HRI field with those found by Kim & Fabbiano (1995). The fluxes that they derive from PSPC data are reported in column . We searched for long-term variability of the matching sources comparing these fluxes with those measured by the wavelets algorithm (Table 3). We mark as variable those sources whose flux varied by more than between the PSPC and HRI observations, i.e. between 1993 and 1995. We found that only source No.3 show significant variability in this interval. To check if the different procedures, extraction radii and background subtraction, significantly affect the PSPC count rate determination, we extracted from the GALPIPE database (Mackie et al., 1996, and references therein), which has produced a list of all sources present in the ROSAT PSPC archive444An online version of the GALPIPE database and documentation can be found at the D.I.A.N.A. homepage at the Palermo Observatory: http://dbms.astropa.unipa.it/, the count rates measured by the wavelets algorithm on the second of the PSPC observations (RP600254a01) used by Kim & Fabbiano (1995). The results are in good agreement with the Kim & Fabbiano (1995) determinations, except for source No.4. In this case however the proximity to the NGC 499 halo and the large PSPC PRF may compromise the wavelets accuracy. We must notice that sources No.5 and 9, which are likely to be produced by the interaction of the radio lobes with the surrounding ISM (see 3.3), have no PSPC counterpart since they are undetected due to the lower spatial resolution of this instrument.
The optical DSS image of the NGC 507/499 region was visually inspected to find optical counterparts of the X-ray sources within a radius (Table 3) from the X-ray centroid. The results are summarised in column “Opt.id.” of Table 4. We also cross-correlated our source list with the catalogs contained in the NED database, finding that source No.7 is likely to be the X-ray counterpart of the radio source NVSS J012345+332554.
Many of the sources detected in the PSPC data by Kim & Fabbiano (1995) are not detected in the HRI field. We derived upper limits on the HRI flux to find whether this result is due to the lower HRI S/N ratio or by the temporal variability of the sources. For all PSPC sources not detected in the HRI field, we extracted count rates using the radii reported in Table 2 of Kim & Fabbiano (1995) rescaled by a factor 1/3 to take into account the difference between the HRI and PSPC PRF. The background was measured locally in an annulus of radius twice the one used for the source. The resulting fluxes (obtained with the same conversion factors discussed above) and upper limits, are shown in Table 5. The comparison with the PSPC fluxes shows that all sources except one are below the HRI sensitivity. Source No.6 is the only one which must be significantly variable since the expected flux is higher than the upper limit indicated by the HRI data.
The implications of these results on the nature of the discrete sources found in the NGC 507/499 field will be discussed in 3.4.
2.8 The Chandra data
Chandra observed NGC 507 on 2000 October 11 (ObsID 317) with the ACIS-S detector for ks. The Chandra field of view is smaller than the one of the Rosat HRI and is not azimuthally symmetric due to the position of the ACIS ccd’s on the focal plane. Thus the Chandra data are not as good as the Rosat one’s to relate the core region to the large scale structure of the X-ray halo; however the higher angular resolution allows a more detailed study of the NGC 507 core. In this work we use the Chandra data to confirm our HRI results and to study the properties of the central peak; a complete analysis of the Chandra data is already in progress (Forman et al., 2001a, b).
The adaptively smoothed and exposure corrected image of the ACIS-S3 chip is shown in Figure 15. The Chandra data confirm the complex morphology shown by the Rosat HRI: the galaxy has an extended halo with two X-ray peaks and a small gas tongue extending in the South-East direction, as discussed in 2.2. The presence of the Northern ‘tail’ seen in Figure 4 is less evident; however the surface brightness on the Northern side extends in the North-West direction and its gradient is shallower than toward the South. This is also in agreement with the presence of sharp Southern and Eastern edges in the gas distribution reported by Forman et al. (2001b), even though in the adaptively smoothed image they are not as evident as in the raw data. As discussed in 2.5, the surface brightness profile of the central component (see Forman et al., 2001a) demonstrates that the central X-ray peak is extended and not due to the presence of a nuclear source, thus solving any ambiguity present in the HRI data.
Figure 15 confirms the presence of a clump of hot gas in the core of the companion galaxy NGC 508. The count rate measured with Chandra ( cnts s-1) is consistent with the HRI detection and yields an X-ray luminosity555The error includes the uncertainty on the assumed spectral model, ranging from a thermal plasma with variable metallicity to a 5 keV Bremsstrahlung spectrum erg s-1. In the LX-LB diagram this places NGC 508 (optical luminosity (de Vaucouleurs et al., 1991)) in the range occupied by compact early-type galaxies, whose emission includes a large contribution from X-ray binaries.
The preliminary spectral analysis performed by Forman et al. (2001b) shows that the mean halo temperature is close to 1 keV, in agreement with the previously published ROSAT PSPC (Kim & Fabbiano, 1995) and ASCA data (Matsumoto et al., 1997). Taking advantage of the Chandra angular resolution, we further analysed the spectral properties of the central component. We extracted the 0.3-10 keV spectrum from a 10 arcsec circle centered on the central peak, using the surrounding 10-20 arcsec annulus to extract the background. The resulting counts were rebinned so to have at least 15 counts per bin and fitted with the CIAO Sherpa package. We tried both a single temperature Raymond-Smith (Raymond & Smith, 1977, and additions) and a MekaL (Mewe, Gronenschild & van den Oord, 1985; Mewe, Lemen & van den Oord, 1986; Kaastra, 1992; Liedahl, Osterheld & Goldstein, 1995) spectral model obtaining the results reported in Table 6. The mean gas temperature is keV for the Raymond-Smith model and keV for the MekaL one (Figure 16), with the MekaL model yielding slightly better fits than the Raymond-Smith one. The metal abundances are subsolar but compatible with solar within . The absorbing columns (nH) are 2-3 times higher than the galactic one ( cm-2, ) even though with large uncertainties. Fixing the abundance to the solar one yields slightly higher temperatures and lower absorbing columns, while fixing the nH to galactic values produces metal abundances higher than solar. However, even though the small statistics produces large errors, the plasma temperature is quite well constrained as shown by the confidence contours in Figure 16 (right panel).
We further tried to reduce the extraction region to a 5 arcsec circle, to find out if there are gradients in the spectral parameters of the central component. The results of these fits are shown in the right section of Table 6. The plasma temperatures are slightly lower than those extracted within 10 arcsec for all models while the value of the other parameters are very uncertain due to the small statistics. However the results of the fits suggest that the metallicity may be higher in the galaxy center.
We are aware that to correctly estimate the hot plasma properties we should perform a more complex analysis, e.g. a full spectral deprojection of the different halo components, since there is a temperature gradient in the NGC 507 halo. Several authors have shown that an incorrect modelling of the X-ray emission (e.g. single instead of multi-temperature models) leads to systematic errors in the gas parameter estimates (Buote, 1999; Matsushita, Ohashi & Makishima, 2000). However in our case the small number of events does not allow a more complex analysis of the nuclear region. We tried to add the contribution of unresolved discrete sources in the form of a 5 keV Bremsstrahlung or a power-law component but the fit yields a negligible contribution and, however, does not significantly affect the best fit temperature. The best-fit temperature does not change even if we restrict the fit to the 0.3-4 keV range, where the plasma emission is the dominant contribution. In conclusion we believe that the central component temperature is well constrained to be keV.
3 DISCUSSION
3.1 Origin of the Central Component
The surface brightness distribution shown in Figure 3 revealed the presence of a bright X-ray emission peak centered on the optical galaxy. The surface brightness profiles (Figure 7 and 8) show that the peak dominates the X-ray emission within the central 10 arcsec (3 kpc). The HRI data alone do not allow to distinguish between a pointlike or extended nature of the central peak, since the comparison of the X-ray profile with the HRI PRF (Figure 7) and the small core radius of the central component obtained from the bidimensional fit (Table 2) are marginally consistent with the presence of a nuclear X-ray source. However the Chandra surface brightness profile obtained by Forman et al. (2001a) demonstrates the extended nature of this component.
The comparison between the optical and X-ray profile (Figure 8) seems to rule out the possibility that the central peak is due to the unresolved emission of galactic X-ray binaries. In this case the X-ray profile of the central component would be close to the optical one, since the X-ray source population should follow the stellar distribution. The higher Chandra angular resolution and the spectral fit of the central component ( 2.8) further showed that the emission is mainly due to hot plasma and that the contribution of unresolved point sources is small, supporting the gaseous nature of the central peak.
The presence of a central X-ray excess in galaxies and clusters has been usually associated to the presence of a cooling-flow. Kim & Fabbiano (1995) noticed that significant mass deposition should be present within the cooling radius since the cooling times of the gaseous halo are smaller than the Hubble time (Figure 12). Their estimate, rescaled to our adopted distance, yields a mass inflow rate of M⊙ yr-1. If the central X-ray peak was due to the gas deposited by the cooling flow, we would expect to find M⊙ within 250 arcsec from the galaxy center while the gaseous mass of the central component is only (Figure 13, left panel) within the same radius. This suggests that the cooling flow is inhomogeneous (Kim & Fabbiano, 1995) so that a large amount of cooling gas is deposited at large radii and does not reach the halo center. However, if we assume an inhomogeneous flow where (Fabian, 1994) and extrapolate the mass deposition down to , where the contribution of the central component dominates, we still obtain a deposited mass of M⊙ while we observe less than M⊙. This result holds also if we take into account all the uncertainties included in the calculation such as the gas filling factor and the age of the cooling flow. Moreover we must consider that stellar mass losses are expected to have injected an additional M⊙ of gas in the central 10” (see Figure 13, left panel), further increasing the disagreement.
Thus, if the cooling flow model is correct, most of the deposited gas must have cooled out of the X-ray emitting phase. The fate of the cooling gas has been largely debated in literature (see for instance Fabbiano, 1989; Fabian, 1994; Rangarajan et al., 1995; Fabian, 2001) and is not clear yet. In NGC 507 the column density profile derived by Kim & Fabbiano (1995) is consistent with the galactic value and shows that this mass is not in the form of cold absorbing gas. One possibility is suggested by Buote (2000b), who found that a large amount of warm ( keV) ionised gas may be present in the halo of NGC 507, consistent with the one expected to be deposited by the cooling flow. In this case we must address the question of what prevents this gas to rapidly cool to lower temperatures. Alternatively a significant amount of gas may have been removed by star formation. This hypothesis however, is challenged by the recent failure to observe the cooling gas in the center of galaxies and clusters supposed to host large cooling flows (Matsushita et al., 2002; Peterson et al., 2001; Kaastra et al., 2001; Tamura et al., 2001).
The problems mentioned above have led many authors to stress the failure of the standard cooling flow models and the need to re-analyse the nature of the central X-ray excess (e.g. Ikebe et al., 1999; Makishima et al., 2001). The multi-component bidimensional fit of the X-ray surface brightness distribution performed in the present work for NGC 507 and by Paolillo et al. (2002) for NGC 1399 has shown that the central component is centered on the optical galaxy even though the outer halo is usually asymmetric and displaced several kpc (7 kpc for NGC 507, 5 kpc for NGC 1399) from the optical centroid. This suggests that the distribution of the denser central gas is related to the underlying stellar distribution.
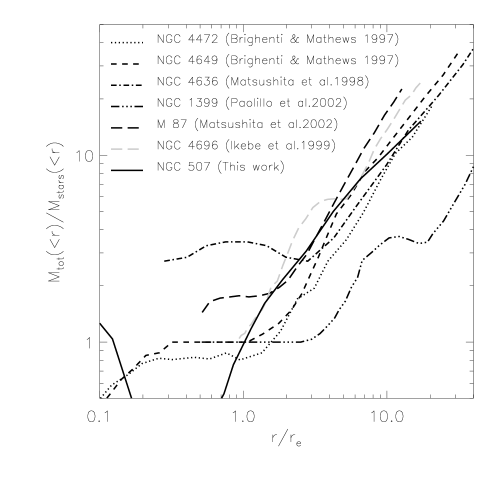
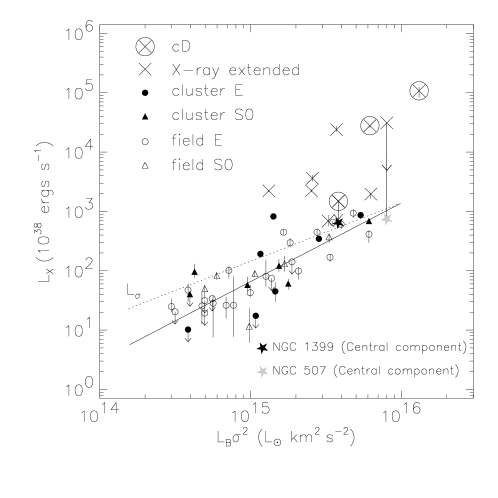
Following Makishima et al. (2001) and Matsushita et al. (2002) we compared the total over stellar mass profiles of several X-ray bright Early-Type galaxies extracted from literature. Figure 17 shows that the X-ray halos are characterised by two different dynamical ranges: a central region, within 2-3 , where the total over stellar mass is almost constant with , and an outer region where the ratio increases steeply indicating the presence of massive dark halos. The flat central region correspond to the one dominated by the X-ray excess. The ratio close to 1 indicate that the dark matter contribution in the galaxy core is usually small; however even when is higher, the constant value for suggests that the total mass is still related to the underlying stellar distribution. The correlation of the ‘knee’ in the curves with the effective radius further supports the association of the central X-ray peak with the optical galaxy. In the case of NGC 507 this trend is not as evident as for the other galaxies of the sample for the lack of hydrostatic equilibrium in the halo core discussed in 2.6. However we notice that for , where is reported in Table 1) the ratio is very similar to those of the other galaxies.
A second point which was usually invoked as a proof of the cooling flow scenario was the temperature drop in the halo center. However Brighenti & Mathews (1997) argue that the temperature drop within 4 effective radii () observed in many galaxies, including NGC 507 and NGC 1399, is not a natural result of cooling flow models. In a recent study of a sample of early-type galaxies, Matsushita (2001) explained the properties of X-ray compact galaxies as due to the gas injected into the ISM by stellar mass losses. The X-ray luminosities and temperatures are compatible with the expectations obtained considering stellar motions as the main source of heat, leading to a mean value of . X-ray extended galaxies, instead, have a mean halo temperature which exceeds the value expected if the gaseous component is in equilibrium with the stellar population (. This difference between compact and extended galaxies is reduced if we restrict the analysis to the region within from the galaxy center, due to the temperature gradient observed in most X-ray extended galaxies of the sample. NGC 1399 has the value closest to unity () among those included in the Matsushita (2001) sample. This fact is easily explained considering the analysis performed by Paolillo et al. (2002) which shows that the central component dominates the X-ray emission within .
In the case of NGC 507 (which is not in the Matsushita (2001) sample), if the gas is in equilibrium with the stellar component, we expect to find a central temperature close to 0.7 keV (assuming km s-1, Prugniel & Simien (1996)), which is in excellent agreement with the spectral determinations based on the Chandra data ( 2.8). The lower central temperatures would thus be explained by kinematical heating from stellar mass losses rather than by the cooling flow model. In this scenario it is easy to explain why X-ray extended galaxies have since to correctly sample the galaxy core we need an angular resolution high enough to isolate the temperature of the central component from the one of the outer halo, which is usually higher.
To further confirm the association of the central component with the stellar population we computed the X-ray luminosity, within , from the central component of NGC 507 and NGC 1399 and plotted the result (Figure 18) on the vs diagram shown in Figure 4 of Matsushita (2001). The Figure shows that, removing the contribution of the external halo, the luminosity of the central component falls in the range occupied by X-ray compact galaxies whose properties, according to Matsushita (2001), are well explained by kinematical heating of the gas supplied by stellar mass loss.
In conclusion the characteristics of the central X-ray peak analysed in this work for NGC 507 and in Paolillo et al. (2002) for NGC 1399 are compatible with the scenario where the ISM in the galaxy core is produced by stellar mass losses and is in equilibrium with the stellar component. Both gas and stars feel the same potential, mainly due to stellar mass, since the amount of dark matter is small. The stellar origin of the gas is further supported by the solar metallicity found by Buote (2000a) in the center of several galaxies and groups.
The scenario that is emerging about the nature of the X-ray excess in galaxies solves several problems (origin of the central excess, lower central temperatures, subsolar abundances) largely debated in literature in the last 10 years; however it also reveals our still poor understanding of the cooling mechanism: if we assume that the gas remains in the hot phase, the X-ray data are inconsistent with the deposition rates predicted not only by homogeneous models (a well established fact) but by the inhomogeneous scenario as well. Thus either the hot gas must cool out of the X-ray emitting phase, in which case Chandra and XMM observations are showing that we are still far from understanding the details of the cooling process and the fate of the cooling gas, or there must be some mechanism which prevents the hot gas to flow inward. The latter explanation may hold for NGC 507 as we will discuss in 3.3.
3.2 Large-scale Halo structure
The large-scale properties of the X-ray halo are very different from those of the halo core discussed in the previous section. We have shown that the HRI data reveal ( 2.2) the presence of X-ray emission out to 500” (160 kpc) from the galaxy center (Figure 10) and more extended toward NGC 499. The mass profiles (Figure 13) show that for (25 kpc) the total mass greatly exceeds the visible one. While for some galaxies (e.g. Paolillo et al., 2002) it can be argued that the hydrostatic equilibrium assumption (on which the total mass estimates are based) is not valid due to interactions with the surrounding environment, the good agreement of the NGC 507 ratio with those derived from literature (Figure 17) shows that the prevalence of dark matter outside a few effective radii is a common feature of many early-type galaxies.
If the hot gas distribution traces the gravitational potential this dark matter is distributed preferentially on group scales rather than being associated with the dominant galaxy of the cluster. In fact the study of the X-ray surface brightness distribution showed that the optical galaxy is displaced with respect to the gaseous halo. This result is confirmed independently by the bidimensional fit, which shows that the extended component centroid is located (7 kpc) South-West of the optical galaxy (Figure 6, left panel), and by the wavelets algorithm, which centered source No.10 (associated with the NGC 507 halo) South-West of source No.9 (coincident with the central peak, see left panel of Figure 3). A very similar situation, where the central X-ray peak is centered on the optical galaxy while the external halo is displaced from the optical distribution, was found by Paolillo et al. (2002) for NGC 1399, thus supporting the idea that the large-scale distribution traces the gravitational potential of the galaxy group. In the case of NGC 507 the displacement toward NGC 499 seems compatible with the distribution of galaxies within the NGC 507 group studied by Barton, de Carvalho & Geller (1998).
The comparison of the halo temperature outside a few effective radii and the stellar velocity dispersion in several early-type galaxies yields values of (Matsumoto et al., 1997; Brown & Bregman, 1998, 2000; Matsushita, 2001) thus supporting the need for additional heat to the one provided by stellar mass losses alone. Sources of heat such as a central active nucleus or supernovae explosions, seem not enough to account for the observational data (e.g. Matsumoto et al., 1997) and would however affect in first place the halo center. The alternative explanation proposed by Makishima et al. (2001) and Matsushita (2001) is that X-ray extended galaxies are at the bottom of large potential structures corresponding to galaxy groups, which provide the additional heat by gravitational infall. This scenario is consistent with our analysis which shows that NGC 507 and most X-ray bright early-type galaxies, lies at the center of extended dark halos.
The displacement of NGC 507 with respect to the large-scale gas distribution may be produced by the motion of the stellar body within the extended gaseous halo. The central component would then be centered on the optical galaxy since it is due to gas of stellar origin in equilibrium with the stellar component ( 3.1). The tails seen in the adaptively smoothed images (Figure 4 and Figure 15) may represent cooling wakes produced by such motion, similar those found by David et al. (1994) or Merrifield (1998). Forman et al. (2001b) suggested a similar origin for the sharp Southern and Eastern edges in the gas distribution. The smaller North-Western tail departing from the central component found in the surface brightness map (Figure 3) may be produced by such motion as well, even though we can not exclude that it simply represents a layer of gas compressed by the radio plasma on the edge of the Western radio lobe.
Alternatively tidal interactions between NGC 507 and NGC 499 may be responsible for the asymmetries in the hot gas distribution. Such interactions may produce large density fluctuations and the formation of filamentary structures (D’Ercole, Recchi & Ciotti, 2000). The presence of ‘clumps’ of cooler gas in the halo, suggested by Kim & Fabbiano (1995) (see 3.4) may support such scenario.
These considerations do not necessarily exclude each other since a combination of different effects is likely to be present in high density environments.
3.3 X-ray/Radio Correlations
We showed in 2.2 that the central NGC 507 halo has a very complex morphology. Figure 3 revealed the presence of secondary emission peaks and cavities in the X-ray emission. The weak dependence of the HRI spectral response on the temperature near 1 keV (Clarke, Harris & Carilli, 1997), suggests a correlation between surface brightness and density fluctuations of the hot gas. The comparison of these X-ray features with the radio maps of Figure 5 supports the scenario where the hot gas has been displaced by the pressure of the radio-emitting plasma. In fact the very good agreement between the shape of the Western radio lobe and the X-ray cavity indicates that the lobe may have produced a low-density zone in the gaseous medium, compressing the gas at the edge of the lobe (see Clarke, Harris & Carilli, 1997). This interaction is also likely to be responsible for the N-S elongation of the lobe since the radio plasma expanded avoiding the denser Western and Southern regions.
The presence of such interactions is not so evident in the Eastern lobe. This may be due to projection effects and/or to the fact that the Eastern lobe seems to expand in a less dense environment (the X-ray centroid of the extended component is displaced by =6 kpc South-West of the nuclear radio source). The Radio/X-ray comparison in left panel of Figure 5 shows that a secondary emission peak lies in the center of the Eastern radio lobe. We followed Feigelson et al. (1995) to calculate the expected X-ray emission due to Inverse Compton scattering of Cosmic Background photons into the X-ray band, comparing the minimum energy field strength with the magnetic field required to produce a measured ratio of radio to X-ray flux. We used the radio flux for the Eastern lobe measured by de Ruiter et al. (1986) and we measured the X-ray flux density extracting counts from a 25” circle centered on the secondary emission peak. We found that the expected X-ray emission falls an order of magnitude below the measured excess for any choice of the involved parameters, and thus Inverse Compton scattering is unlikely to produce the emission peak. Conversely, the higher resolution radio contours shown in right panel of Figure 5 suggest that the bulk of the radio emission may fall south of the peak, in a low emitting region. In this case both the secondary emission peak and the SE ‘tongue’ found in the adaptively smoothed image (Figure 4) may be produced by hot gas compressed by the radio-emitting plasma, similarly to what seen for the Western lobe.
The thermal confinement of the radio lobes is supported by the interactions between the radio and X-ray emitting plasma discussed above. Morganti et al. (1988) studied the pressure balance between the radio lobes and the surrounding ISM, finding that the thermal pressure greatly exceeded the radio one (). However their estimate was based on Einstein data, which resulted in a temperature twice the ROSAT PSPC value. Taking into account the ROSAT temperature reduces the disagreement by more than 50%; the remaining excess may be explained by the departures from the minimum pressure conditions discussed in their work.
If the secondary peaks are due to hot gas compressed by the radio emitting plasma we can estimate the mass and energy contained in such overdensities. Assuming that the excess emission is due to spherical bubbles with radii of 25” (8 kpc) and 17” (5 kpc) for the western and eastern lobe respectively we calculate a mean density of cm-3 and a total mass of a few M⊙. The lack of energy resolution of the HRI data does not allow us to estimate the temperatures of the overdensities; however the Chandra temperature map obtained by (Forman et al., 2001b) suggests that the bubble temperature is not significantly different from the one of the surrounding medium. Assuming keV we obtain a mean pressure erg cm-3. Thus the density and pressure of the ISM contained in the bubbles are approximately twice those of the surrounding gas. An estimate of the energy required to produce such peaks can be obtained from the excess of thermal energy contained in the bubbles with respect to the ambient medium. We obtain ergs summing both bubbles. This estimate is consistent within a factor of with the energy required to produce the western cavity , which is a good agreement considering the uncertainties involved in the calculation. Since the bubbles are overpressurised they will expand in the surrounding ISM, releasing part of their internal energy as mechanical work. Assuming that the expansion is adiabatic all the excess internal energy will be transferred to the ISM. The energy injected by the central radio source offers a possible explanation to the inconsistencies of the cooling flow scenario discussed in 3.1: in fact if radio sources are intermittent phenomena with evolutionary timescales of yr we obtain an energy input in the ISM of erg/s, which is comparable with the energy radiated by the X-ray emitting gas within the central 1.5 arcmin of the NGC 507 halo. This energy input should significantly affect the gas cooling time preventing the hot gas to inflow and deposit in the halo core. This result is in excellent agreement with the simulations performed by Rizza et al. (2000). In their models the interaction of the radio lobe with the ISM produces X-ray excess emission around the radio lobes of such as those observed in NGC 507. Moreover they estimate that the kinetic energy of the radio jets is comparable or higher than the energy lost by the cooling flow via thermal emission.
Finally we notice that Canosa et al. (1999), using the ROSAT HRI data, found an upper limit on the X-ray flux of a possible nuclear source that exceeds, by more than two orders of magnitude, the emission expected from the Radio data. The extended nature of the central peak implies that the flux of the nuclear source is much smaller than thought before (Forman et al., 2001a), thus reducing the disagreement between the radio and X-ray data.
3.4 Discrete Sources
Kim & Fabbiano (1995) revealed the presence of many additional pointlike sources in the NGC 507 halo. The co-added spectrum of these sources was found to be well fitted by a soft thermal model (kT=0.52) with low abundance (0.0-0.2), leading the authors to speculate that they could be cooling clumps in the gaseous halo. As discussed in 2.7 we used the wavelets algorithm to investigate the nature of discrete sources in the HRI field (Figure 14). After excluding NGC 507 (source No.10), NGC 499 (No.11), we cross-correlated the HRI sources (Table 3) with those detected in the PSPC data (Table 2 of Kim & Fabbiano (1995)). Only 5 out of the 17 PSPC sources sources falling within the HRI field666Sources No.1,2,19,21 of Kim & Fabbiano (1995) fall outside or on the edge of the HRI FOV. are detected in the HRI data. We compared the fluxes measured by the two instruments, since any temporal variability would exclude the extended nature of these sources. As shown in Tables 4 and 5 two sources varied significantly between 1993 and 1995. One more object (Source No.7) is likely to be associated with a background radio source.
In conclusion of the sources detected by Kim & Fabbiano (1995) are likely to be compact objects; this number must be considered as a lower limit since 4 additional HRI sources possess an optical counterpart candidate. This result is not necessarily in disagreement with the soft spectrum reported by Kim & Fabbiano (1995) since Sarazin, Irwin & Bregman (2001) claimed the discovery of supersoft sources in NGC 4697 (even though their sources are preferentially located near the galaxy center). The nature of the remaining sources is still uncertain. If the emission is due to accreting binaries associated with NGC 507 these systems must host massive black holes since their luminosity would exceed, by at least an order of magnitude, the Eddinghton luminosity for a 1.4 Neutron Star. In such case they may be placed in globular clusters, given the large distances from the galaxy center (see for instance Angelini, Loewenstein & Mushotzky, 2001). However, we can not exclude the diffuse origin of many sources since the irregular structure of the gaseous halo and the filamentary features seen in the halo core suggest that significant density fluctuations may be present in the hot gas distribution, similar those found for NGC 1399 (Paolillo et al., 2002).
4 Conclusions
The ROSAT HRI data showed, in agreement with previous studies, a bright X-ray halo surrounding NGC 507. The large-scale surface brightness distribution is irregular and more extended in the North direction. The halo core revealed a complex morphology: there is a main X-ray peak, coincident with the position of the optical galaxy, and several secondary peaks, due to the interaction between the radio lobes and the surrounding ISM.
Modelling the halo surface brightness with a bidimensional double Beta model, we found that the extended halo centroid is displaced (7 kpc) South-West of the optical galaxy. This result suggests a different origin for the central and the extended components. The ROSAT and Chandra data show that the central X-ray peak is produced by dense hot gas in the galaxy core. Even though the cooling time of the halo within 250” (80 kpc) is shorter than the Hubble time, the mass of the gas present in the central component falls two orders of magnitude below the amount expected to be deposited by both homogeneous or inhomogeneous cooling-flow models. The core luminosity and temperature are instead in good agreement with the scenario where the central X-ray peak is due to gas of stellar origin kinetically heated by stellar mass losses. This result is supported by the solar metallicity found by Buote (2000a) and suggests that the core of bright galaxies is similar to the halo of X-ray compact early-types studied by Matsushita (2001).
The displacement of the cluster halo from the optical galaxy and the filamentary structures observed in the halo core suggest that the galaxy may be slowly moving within the group potential. The total mass profile derived from the bidimensional model shows that a significant amount of dark matter is required at large radii, if the gas is in hydrostatic equilibrium. The dark halo extends on group scales and is likely associated with the whole cluster rather than with the optical galaxy.
Comparing with data in the literature, we find that the separation of the gaseous halo in two different dynamical ranges (core associated to the stellar distribution; external halo tracing the larger potential structures corresponding to galaxy groups and clusters) is a common feature of many X-ray extended galaxies. While this result may solve the problem of the different X-ray properties among X-ray extended and compact galaxies, since the latters are missing the large-scale component (Ikebe et al., 1999; Makishima et al., 2001; Matsushita, 2001), it makes more difficult to explain the missing deposited mass expected from the short cooling times.
In NGC 507 we found that, if radio sources are intermittent phenomena with timescales of yrs, the amount of energy injected in the ISM is large enough to prevent the gas from cooling in the halo core and may explain the failure of the cooling flow scenario.
Finally we found that of the sources detected by Kim & Fabbiano (1995) in the NGC 507 halo are due to discrete sources. The nature of the remaining population is unclear. If associated with NGC 507, they can be either accreting binaries hosting a massive black hole or density clumps of the X-ray halo.
We acknowledge partial support from the CXC contract NAS8-39073 and NASA
grant NAG5-3584 (ADP), from the MURST PRIN-COFIN 1998-1999 and 2000-2002
(resp. G. Peres) and from the European Social Fund (F.S.E.).
This work is part of the PhD thesis of M. Paolillo at the Palermo University.
This research has made use of the NASA/IPAC Extragalactic Database (NED)
which is operated by the Jet Propulsion Laboratory, California Institute of
Technology, under contract with the National Aeronautics and Space
Administration.
References
- Angelini, Loewenstein & Mushotzky (2001) Angelini, L., Loewenstein, M., & Mushotzky, R. F. 2001, ApJ, 557, L35
- Athey et al. (2002) Athey, A., Bregman, J., Bregman, J., Temi, P., & Sauvage, M. 2002, ApJ, 571, 272
- Barton, de Carvalho & Geller (1998) Barton, E. J., de Carvalho, R. R., & Geller, M. J. 1998, AJ, 116, 1573
- Brighenti & Mathews (1997) Brighenti, F., & Mathews, W. G. 1997, ApJ, 486L, 83
- Brown & Bregman (1998) Brown, B. A., & Bregman, J. N. 1998, ApJ, 495L, 75
- Brown & Bregman (2000) Brown, B. A., & Bregman, J. N. 2000, ApJ, 539, 592
- Buote (1999) Buote, D. A. 1999, MNRAS, 309, 685
- Buote (2000a) Buote, D. A. 2000a, ApJ, 539, 172
- Buote (2000b) Buote, D. A. 2000b, ApJ, 544, 242
- Caon, Capaccioli & D’Onofrio (1994) Caon, N., Capaccioli, M., & D’Onofrio, M. 1994, A&AS, 106, 199
- Canosa et al. (1999) Canosa, C. M., Worrall, D. M., Hardcastle, M. J., & Birkinshaw, M. 1999, MNRAS, 310, 30
- Clarke, Harris & Carilli (1997) Clarke, D.A., Harris, D.E., & Carilli, C.L. 1997, MNRAS, 284, 981
- Colla (1975) Colla, G., Fanti, C., Fanti, R., Gioia, I., Lari, C., Lequeux, J., Lucas, R., & Ulrich, M. H. 1975, A&AS, 20, 1
- Damiani et al. (1997a) Damiani, F., Maggio, A., Micela, G., Sciortino, S. 1997a, ApJ, 483, 350
- Damiani et al. (1997b) Damiani, F., Maggio, A., Micela, G., Sciortino, S. 1997b, ApJ, 483, 370
- David et al. (1996) David, L. P., Harden, Jr., F. R., Kearns, K. E., & Zombeck, M. V. 1996, The ROSAT High Resolution Imager (HRI), Calibration Report 1996 February, revised, U.S. ROSAT Science Data Center, SAO, Cambridge, MA
- David et al. (1994) David, L. P., Jones, C., Forman, W., & Daines, S. 1994, ApJ, 428, 544
- D’Ercole, Recchi & Ciotti (2000) D’Ercole, A., Recchi, S., & Ciotti, L. 2000, ApJ, 533, 799 (DRC)
- de Ruiter et al. (1986) de Ruiter, H. R., Parma, P., Fanti, C., & Fanti, R. 1986, ApJS, 65, 111
- de Vaucouleurs et al. (1991) de Vaucouleurs, G., de Vaucouleurs, A., Corwin, H. G. Jr., Buta, R. J., Paturel, G., & Fouqué, P. 1991, Third Reference Catalogue of Bright Galaxies (New York: Springer) (RC3)
- Fabbiano (1989) Fabbiano, G. 1989, ARA&A, 27, 87
- Fabian (1994) Fabian, A. C. 1994, ARA&A, 32, 277
- Fabian (2001) Fabian, A. C., Mushotzky, R. F., Nulsen, P. E. J., & Peterson, J. R. 2001, MNRAS, 321, L20
- Fabricant, Lecar & Gorenstein (1980) Fabricant, D., Lecar, M., & Gorenstein, P. 1980, ApJ, 241, 552
- Fanti et al. (1987) Fanti, C., Fanti, R., De Ruiter, H. R., Parma, P. 1987, A&AS, 69, 57
- Feigelson et al. (1995) Feigelson, E. D., Laurent-Muehleisen, S. A., Kollgaard, R. I., Fomalont, E. B. 1995, ApJ, 449L, 149
- Forman et al. (2001a) Forman, W., Markevitch, M., Jones, C., Vikhlinin, A., & Churazov, E. 2000, astro-ph/0110087
- Forman et al. (2001b) Forman, W., Jones, C., Markevitch, M., Vikhlinin, A., & Churazov, E., contribution to the ”Lighthouses of the Universe Conference”, 6-10 August 2001, Garching bei Munchen, Germany, astro-ph/0111526
- González-Serrano & Carballo (2000) González-Serrano, J. I., & Carballo, R. 2000, A&AS, 142, 353
- Harris (1999) Harris, D. E. 1999, in Proceedings of the colloquium “The Most Distant Radio Galaxies”, Amsterdam, Royal Netherlands; eds: H. J. A. Röttgering, P. N. Best and Lehnert
- Harris et al. (1998) Harris, D. E., Silverman, J. D., Hasinger, G., & Lehmann, I. 1998, A&AS, 133, 431
- Hasinger et al. (1993) Hasinger, G., Burg, R., Giacconi, R., Hartner, G., Schmidt, M., Trumper, J., Zamorani, G., 1993, A&A, 275, 1
- Huchra, Vogeley & Geller (1999) Huchra, J. P., Vogeley, M, S., & Geller, M. J. 1999, ApJS, 121, 287
- Ikebe et al. (1999) Ikebe, Y., Makishima, K., Fukazawa, Y., Tamura, T., Xu, H., Ohashi, T., & Matsushita, K. 1999, ApJ, 525, 58
- Kaastra (1992) Kaastra, J.S. 1992, ”An X-Ray Spectral Code for Optically Thin Plasmas”, Internal SRON-Leiden Report, updated version 2.0
- Kaastra et al. (2001) Kaastra, J. S., Ferrigno, C., Tamura, T., Paerels, F. B. S., Peterson, J. R., & Mittaz, J. P. D. 2001, A&A, 365L, 99
- Kim & Fabbiano (1995) Kim, D. W., & Fabbiano, G. 1995, ApJ, 441, 182
- Kim, Fabbiano & Trinchieri (1992a) Kim, D.-W., Fabbiano, G., & Trinchieri, G. 1992a, ApJS, 80, 645
- Kim, Fabbiano & Trinchieri (1992b) Kim, D.-W., Fabbiano, G., & Trinchieri, G. 1992b, ApJ, 393, 134
- Kriss et al. (1983) Kriss, G. A., Cioffi, D. F., & Canizares, C. R. 1983, ApJ, 272, 439
- Liedahl, Osterheld & Goldstein (1995) Liedahl, D.A., Osterheld, A.L., and Goldstein, W.H. 1995, ApJ, 438L, 115
- Mackie et al. (1996) Mackie, G., et al. 1996, in ASP Conference Series, Vol. 101, “Astronomical Data Analysis Software and Systems V”, G. H. Jacoby and J. Barnes eds.
- Makishima et al. (2001) Makishima, K., et al. 2001, PASJ, 53, 401
- Matsumoto et al. (1997) Matsumoto, H., Koyama, K., Awaki, H., Tsuru, T., Loewenstein, M., & Matsushita, K. 1997, ApJ, 482, 133
- Matsushita (2001) Matsushita, K. 2001, ApJ, 547, 693
- Matsushita et al. (2002) Matsushita, K., Belsole, E., Finoguenov, A., & Böhringer, H. 2002, A&A, 381,21
- Matsushita et al. (1998) Matsushita, K., Makishima, K., Ikebe, Y., Rokutanda, E., Yamasaki, N., Ohashi, T. 1998, ApJ, 499L, 13
- Matsushita, Ohashi & Makishima (2000) Matsushita, K., Ohashi, T., & Makishima, K. 2000, PASJ, 52, 685
- Merrifield (1998) Merrifield, M. R. 1998, MNRAS, 294, 347
- Mewe, Gronenschild & van den Oord (1985) Mewe, R., Gronenschild, E. H. B. M., & van den Oord, G. H. J. 1985, A&AS, 62, 197
- Mewe, Lemen & van den Oord (1986) Mewe, R., Lemen, J. R., & van den Oord, G. H. J. 1986, A&AS, 65, 511
- Morganti et al. (1988) Morganti, R, Fanti, R., Gioia, I. M., Harris, D. E., Parma, P., & de Ruiter, H. 1988, A&A, 189, 11
- Paolillo et al. (2002) Paolillo, M., Fabbiano, G., Peres, G., Kim, D.-W. 2002, ApJ, 565, 883
- Parma et al. (1986) Parma, P., de Ruiter, H. R., Fanti, C., & Fanti, R. 1986, ApJS, 64, 135
- Peterson et al. (2001) Peterson, J. R., et al. 2001, A&A, 365L, 104
- Prugniel & Simien (1996) Prugniel, P., & Simien, F. 1996, A&A, 309, 749
- Rangarajan et al. (1995) Rangarajan, F. V. N., Fabian, A. C., Forman, W. R., & Jones, C. 1995, MNRAS, 272, 665 (RFFJ)
- Raymond & Smith (1977) Raymond, J. C., & Smith, B. W. 1977, ApJS, 35, 419
- Rizza et al. (2000) Rizza, E., Loken, C., Bliton, M., Roettiger, K., Burns, O., & Owen, F.N. 2000, AJ, 119, 21
- Sakai, Giovanelli & Wegner (1994) Sakai, S., Giovanelli, R., & Wegner, G. 1994, AJ, 108, 33
- Sarazin (1988) Sarazin, C. L. 1988, X-ray Emission from Clusters of Galaxies, ed. Cambridge University Press
- Sarazin, Irwin & Bregman (2001) Sarazin, C. L., Irwin, J. A., & Bregman, J. N. 2001, ApJ, 556, 533
- Sarazin & White (1987) Sarazin, C. L., & White, R. E. 1987, ApJ, 320, 32
- Snowden et al. (1994) Snowden, S. L., McCammon, D., Burrows, D. N., & Mendenhall, J. A. 1994, ApJ, 424, 714 (SMB)
- Stark et al. (1992) Stark, A. A., Gammie, C. F., Wilson, R. W., Bally, J., Linke, R. A., Heiles, C., & Hurwitz, M. 1992, ApJS, 79, 77
- Tamura et al. (2001) Tamura, T., et al. 2001, A&A 365L, 87
- Wegner, Haynes & Giovanelli (1993) Wegner, G., Haynes, M. P., Giovanelli, R. 1993, AJ, 105, 1251
- de Vaucouleurs et al. (1991) de Vaucouleurs, G., de Vaucouleurs, A., Corwin, H. G., Buta, R. J., Paturel, G., Fouque, P., ”Third Reference Catalogue of Bright Galaxies (RC3)”, Springer-Verlag, New-York (1991)
| name | NGC 507 |
|---|---|
| Field center | |
| (R.A., Dec) | 01h23m39s 33∘15’36” |
| sequence id. | RH600680n00 |
| Exp. time | 28310 s |
| obs. date | 1995 Jan 14 |
| P.I. | D.-W. Kim |
| No. OBI | 2 |
| Distance (a) (a)footnotemark: | 65.8 Mpc |
| (b)(b)effective radius (de Vaucouleurs et al., 1991) | 53 arcsec |
| (c)(c)Galactic line-of-sight column density (Stark et al., 1992) | cm-2 |
| Component | Center Position | |||||||
|---|---|---|---|---|---|---|---|---|
| R.A. | Dec | (arcsec) | (rad) | (d.o.f.) | ||||
| Central | 01h23m39.8s | 33∘15’26” | 0.220.02 | 0.580.01 | 0.0(a)(a)Estimated assuming km s-1 Mpc-1 and a velocity of 4934 km s-1 (Huchra, Vogeley & Geller, 1999) | 0.0(a)(a) The parameters and have no error because they were held fixed during the fit (see discussion in text). | 0.5 | 73 |
| Extended | 01h23m38.7s | 33∘15’07” | 49 9 | 0.48 | 0.0(a)(a) The parameters and have no error because they were held fixed during the fit (see discussion in text). | 0.0(a)(a) The parameters and have no error because they were held fixed during the fit (see discussion in text). | 0.9 | 776 |
| Source | R.A. | Dec. | 3 Radius | Counts | Max S/N | Count Rate | (a)(a) Flux in the 0.1-2.4 KeV band in units of erg s-1 cm-2. | (a)(a) Flux in the 0.1-2.4 KeV band in units of erg s-1 cm-2. |
|---|---|---|---|---|---|---|---|---|
| No. | (J2000) | (arcsec) | ( Cnts sec-1) | |||||
| 1 | 1:23:38.6 | +33:21:48 | 8.7 | 136 | 4.3 | 52 | 35 | 20 |
| 2 | 1:23:07.5 | +33:15:23 | 12.2 | 319 | 7.0 | 113 | 76 | 45 |
| 3 | 1:23:11.5 | +33:10:58 | 12.2 | 3710 | 8.0 | 134 | 90 | 53 |
| 4 | 1:23:25.0 | +33:25:31 | 17.3 | 4713 | 7.6 | 174 | 118 | 69 |
| 5 | 1:23:43.2 | +33:15:21 | 17.3 | 3311 | 4.8 | 124 | 83 | 49 |
| 6 | 1:22:58.7 | +33:22:43 | 24.5 | 3912 | 5.2 | 144 | 97 | 57 |
| 7 | 1:23:44.6 | +33:26:08 | 24.5 | 3311 | 4.6 | 134 | 90 | 49 |
| 8 | 1:23:43.4 | +33:32:23 | 34.6 | 4614 | 4.9 | 216 | 145 | 65 |
| 9 | 1:23:35.8 | +33:15:03 | 34.6 | 10428 | 6.1 | 3710 | 256 | 151 |
| Source | PSPC(a)(a) As reported in Table 2 of Kim & Fabbiano (1995) | (a,b)(a,b)footnotemark: | (b)(b) Flux in the 0.1-2.4 KeV band in units of erg s-1 cm-2. | Time Var. | Opt.id. | NED obj. |
|---|---|---|---|---|---|---|
| No. | No. | long-term(c)(c) Difference between PSPC and HRI fluxes: ‘y’ means variable source (), ‘n’ means no variability detected. | ||||
| 1 | - | - | 20 | - | n | - |
| 2 | 8 | 45 | n | y | - | |
| 3 | 10 | 53 | y | y | - | |
| 4 | 12 | 69 | n | y | - | |
| 5 | - | - | 49 | - | n | - |
| 6 | 7 | 57 | n | y | - | |
| 7 | 13 | 49 | n | y | NVSS J012345+332554 | |
| 8 | - | - | 65 | - | n | - |
| 9 | - | - | 151 | - | n | - |
| PSPC(a)(a)As reported in Table 2 of Kim & Fabbiano (1995) | (a,b)(a,b)footnotemark: | Time Var. | ||
|---|---|---|---|---|
| No. | upper limit | long-term(c)(c)Difference between PSPC flux and HRI upper limit: ‘y’ means variable source (), ‘-’ means no variability detected. | ||
| 3 | 90 | - | ||
| 4 | 93 | - | ||
| 5 | 111 | - | ||
| 6 | 243 | y | ||
| 9 | 77 | - | ||
| 11 | 86 | - | ||
| 14 | 108 | - | ||
| 15 | 72 | - | ||
| 16 | 75 | - | ||
| 17 | 78 | - | ||
| 18 | 135 | - | ||
| 20 | 83 | - |
Model ( arcsec) ( arcsec) kT Abundance nH kT Abundance nH (keV) () ( cm-2) (keV) () ( cm-2) Raymond-Smith 0.89/60 Raymond-Smith 0.91/61 Raymond-Smith 0.96/61 MekaL 0.78/60 MekaL 0.83/61 MekaL 0.94/61 ††footnotetext: Note - Errors are for all interesting parameters.


.