Abstract
In eight years, during the blazar monitoring program performed with the Perugia automatic telescope, we were able to collect about 20000 photometric points, contributing to get knowledge on the optical flux history of many sources brighter than magnitude . This intensive and constant optical monitoring is essential to perform studies and multiwavelength campains about this class of AGN. We illustrate our program and some examples of data and preliminary results.
1 Introduction
Blazars are Active Galactic Nuclei (AGNs), having a variable
non-thermal continuum emission extending from radio to gamma-rays.
EGRET discovered that blazars are the most powerful extragalactic
-ray sources up to GeV energies. This emission is
interpreted as due to a high energy radiating plasma region
propagate downstream with shocks in an underlying jet, which
itself moves at relativistic speed and points almost directly
toward the observer (e.g. Blandford & Rees 1978; Dondi &
Ghisellini 1995; Kollgaard et al. 1996). Detailed studies of
blazars flux variations may provide considerable information on
the emitting region dynamics. The blazar monitoring in optical
bands permit to discriminate among the proposed emission models
and represent, together with multiwavelength observations, an
indispensable tool to investigate physical mechanism and
conditions in this objects. Moreover it’s important to reach
sufficient quality, density and continuity of observations to
permit significant statistical data analysis and to establish
possible correlation with the X-ray and -ray emission. In
order to achieve the optical coverage necessary for this goal,
ground-bases small telescope equipped with CCD camera, can play an
important role thank to their large availability. The Automatic
Imaging Telescope (AIT) of the Perugia University is one of the
first robotic telescope in the world, and it’s dedicated to blazar
observation since 1992. General information about our telescope
and blazar sample list can be found at
http://wwwospg.pg.infn.it.
2 The Perugia Monitoring Program and Blazar Sample
The AIT is based on an equatorially mounted 0.4-m Newtonian reflector having a 0.15-m refractor. A CCD camera and Johnson-Cousins filters are utilized for photometry. The system, become full operative in October 1994. It is equipped with an autoguider (based on a CCD camera) that is mounted at the focus of the refractor. The autoguider is also used to verify the correctness of each pointing and to monitor sky conditions.
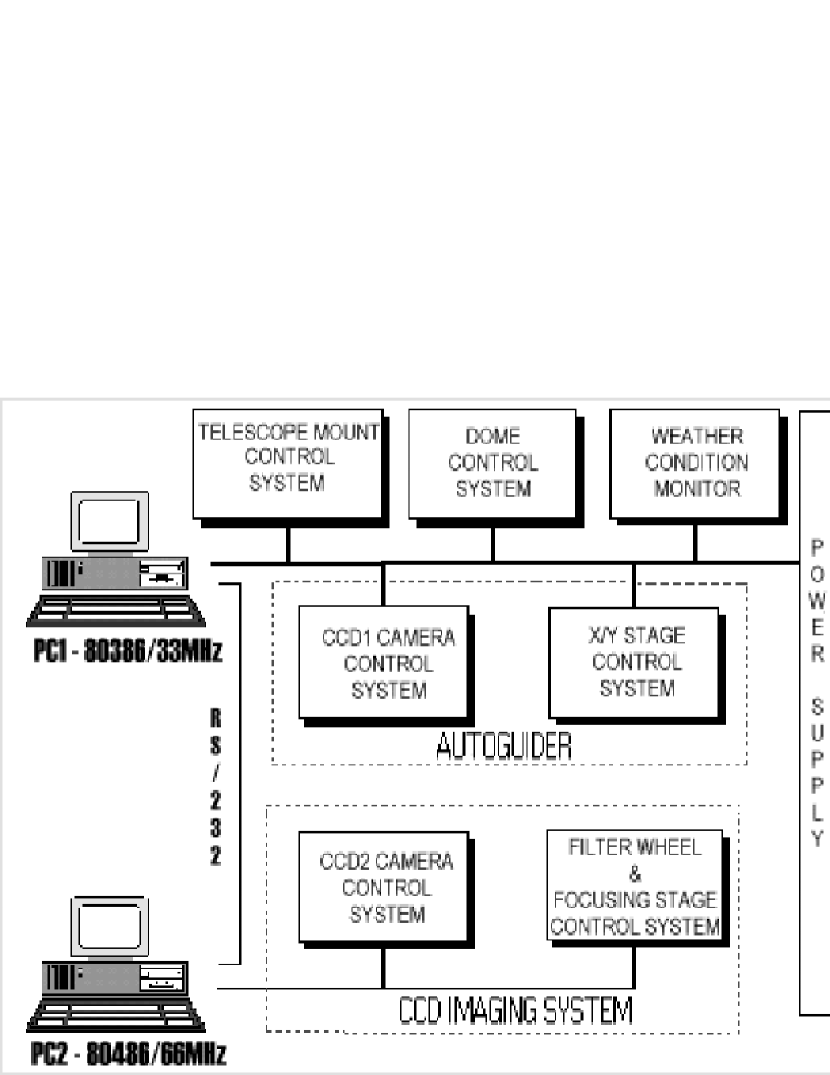
The control of the observatory during the night is now completely automated with the computers deciding the opening or the closing of the dome shutter, selecting the object from the observing list, setting and centering the telescope on the field, taking the desired CCD exposures, and reducing the data after the end of the night (Tosti, Pascolini & Fiorucci 1996).

3 Results and conclusions
The relevant amount of data from the best monitored sources, allow us to perform a first statistical analysis to investigate the time variability characteristics and the light curves. We used the Structure Function (SF) defined as , where is the time lag and the flux, in a versus plot. It’s similar to a sort of power spectrum suitable for nonperiodic data (see, e. g., Hufnagel & Bregman 1992).


The SF slope is an interesting parameter because it highlights some basic properties of the light curves (variability like shot noise, like flickering noise etc…). In our sample the optical variability was generally characterized by an intermediate state between shot and flickering noise (). Shot noise has an infinite memory of all the preceding events (), on the other hand flickering noise depends especially from the last events () (Fiorucci et al. 1999). Our result may suggest that the optical flares are produced in small-scale structures within the jet, such us shocks or plasma turbulence.
To optimize the blazar optical monitoring, important for developing a statistical data analysis and for correlation multiwavelength analysis, we need a stable collaboration among observers, an automatization of the telescopes and data reduction, a standard photometric and database systems (e.g. Villata & Raiteri 2001, Mattox 1999).
References
- 1 Blandford, R. D., Rees, M. J.: 1978, in Pittsburgh Conference on BL Lac Objects, A. M. Wolfe ed., University of Pittsburgh, p. 328
- 2 Dondi, L., Ghisellini, G., 1995, Mon. Not. R. Astr. Soc. 273,, 583
- 3 Edelson, R. A., Krolik, J. H.: 1988, Astrophys. J. 333, 646
- 4 Fiorucci, M., Tosti, G., Luciani, M.: 1999, Mem. Soc. Astron. It. 70, 223
- 5 Hufnagel, B. R., Bregman, J. N.: 1992, Astrophys. J. 386, 473
- 6 Kollgaard, R. I., Palma, C., Laurent-Muehleisen, S. A., Feigelson, E. D.: 1996, Astrophys. J. 465, 115
- 7 Mattox, J. R.: 1999, in Blazar Monitoring towards the Third Millennium. C.M. Raiteri, M. Villata, and L.O. Takalo eds., OAT pub., p. 44
- 8 Tosti, G., Pascolini, S., Fiorucci, M.: 1996, Publ. Astr. Soc. Pacific 108, 706
- 9 Villata, M., Raiteri, C. M., 2001, this proceedings.
- 10
DISCUSSION
J. BECKMAN: I am very impressed with the quality and quantity of the observation made with a relatively small telecope. There must be many potential observers who could collaborate in such programm. What would you estimate to be the smallest telescope which could usefully take part in this kind of monitoring?
G. TOSTI: The smallest configuration useful to the blazar optical monitoring is a telescope with diameter of 25-30 cm equipped with a CCD camera and only a (Cousins) filter.
N. SMITH: How frequently do you observe “single” data points which are significantly above the surrounding data points and how real do you believe them to be? Do you see such data points in the lightcurves of your comparision stars?
G. TOSTI: Sparse photometric points depend on the sampling condition (weather and other) but logs of observations and the CCD images are controlled one by one. Moreover we can compare them with the observation in four-three filter and relevant peaks are confronted with data of other observatories.