XMM-Newton spectral analysis of the Pulsar Wind Nebula within the composite SNR G0.9+0.1
We present a study of the composite supernova remnant G0.9+0.1 based on observations by XMM-Newton. The EPIC spectrum shows diffuse X-ray emission from the region corresponding to the radio shell. The X–ray spectrum of the whole Pulsar Wind Nebula is well fitted by an absorbed power–law model with a photon index 1.9 and a 2–10 keV luminosity of about erg s-1 (d10 is the distance in units of 10 kpc). However, there is a clear softening of the X-ray spectrum with distance from the core, which is most probably related to the finite lifetime of the synchrotron emitting electrons. This is fully consistent with the plerionic interpretation of the Pulsar Wind Nebula, in which an embedded pulsar injects energetic electrons into its surrounding region. At smaller scales, the eastern part of the arc-like feature, which was first revealed by Chandra observations, shows indications of a hard X-ray spectrum with a corresponding small photon index (=1.00.7), while the western part presents a significantly softer spectrum (=3.20.7). A possible explanation for this feature is fast rotation and subsequent Doppler boosting of electrons: the eastern part of the torus has a velocity component pointing towards the observer, while the western part has a velocity component in the opposite direction pointing away from the observer.
Key Words.:
ISM: supernova remnants – individual: G0.9+0.1 – X–rays: ISM1 Introduction
The radio source G0.9+0.1 is the only composite SNR, listed in the Green catalog (Green 2001), which lies in the general direction of the Galactic Center. According to Helfand & Becker (Helfand87 (1987)), the radio morphology of G0.9+0.1 is characterized by a bright centrally condensed synchrotron nebula with relatively flat energy spectral index ( diameter, =+0.12 with F) and a radio shell with a steeper radio spectrum ( diameter; =+0.77). The synchrotron core is powered by the loss of rotational energy from a central pulsar; hereafter we refer to this core as the Pulsar Wind Nebula (PWN) in G0.9+0.1.
Owing to the high interstellar absorption
( cm-2), G0.9+0.1 was barely detected by the
Einstein Observatory (Helfand & Becker Helfand87 (1987)). However, a
much more convincing detection was obtained at higher energies with the
BeppoSAX satellite (Mereghetti et al. Mereghetti98 (1998)).
Later on, Sidoli et al. (Sidoli2000 (2000)) interpreted this hard X-ray
emission as non-thermal in origin. The small angular extent of the X-ray
source (radius 1 ′), combined with an estimated age of the
remnant of a few thousand years, is further evidence that the central radio
core is powered by a young pulsar ( 2,700 yr;
Sidoli et al. Sidoli2000 (2000)). The SNR shell remains unobserved in X-rays,
probably due to the suppression of its soft X-ray flux by the
line-of-sight absorption.
Recently, G0.9+0.1 was observed with Chandra (Gaensler et al.
Gaensler2001 (2001)). The high angular resolution of Chandra provided
an unprecedented view of the X-ray morphology of this SNR and identified
a semi-circular arc-like feature, a jet-like feature and a very bright and
small central emission region close to a very faint unresolved source
(CXOU J174722.8-280915). The latter is inferred to be the pulsar
itself (Gaensler et al. Gaensler2001 (2001)).
This X-ray morphology is similar to other PWNe
powered by young pulsars, which display jets combined with a torus structure
(Crab: Brinkmann et al. Brinkmann85 (1985),
Weisskopf et al. Weisskopf2000 (2000);
Vela: Pavlov et al. Pavlov2000 (2000)).
As mentioned by Gaensler et al. (Gaensler2001 (2001)),
the limited counting statistics of the 35 ks
Chandra observation did not allow them to carry out
a detailed spectral study of the various structures of the PWN,
as ideally is required for the testing of current models.
Here we present the results from an observation of the composite SNR G0.9+0.1 made with XMM-Newton. We focus on the spectral analysis of different regions of the remnant on both relatively large and small spatial scales.
2 Observations and data analysis
G0.9+0.1 was observed by XMM-Newton on-axis on September 23–24, 2000 (17.2 ks and 12 ks for the MOS and PN cameras, respectively). The EPIC-MOS cameras were operated in the standard full-frame mode and the EPIC-PN camera in the extended full frame mode. Each camera was operated with the medium filter deployed.
Using the XMM Science Analysis Software (SAS version 5.2),
the recorded events were screened by rejecting the high background periods
which occasionally arise due to an intense incident flux of soft protons.
After this data cleaning, the useful observing times are
respectively for MOS1 and MOS2 about 15.5 ks and 15.4 ks,
and 10 ks for PN. X-ray events corresponding to pattern 0–12 for the two
MOS cameras were used, whereas for the PN only pattern 0–4
(single and double pixel events) were accepted.
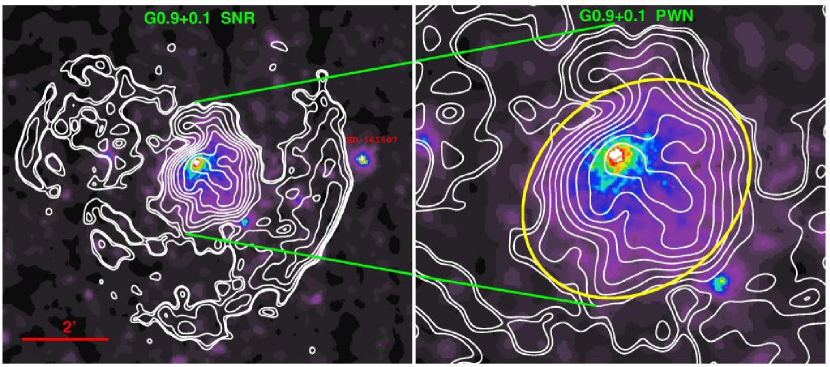
The astrometry of this observation was substantially improved using as
reference the bright foreground F3V star HD 161507,
which is an eclipsing binary of Algol type, detected
at the western side of G0.9+0.1 (see Fig. 1:
left panel).
For the imaging analysis we have summed up the MOS and PN data.
We have used for the adaptative smoothing the tool asmooth
from the SAS.
Our spectral analysis combines fits of the MOS and PN data (except in 3.3)
employing the following camera response matrices:
m1medv9q20t5r6all15.rsp,
m2medv9q20t5r6all15.rsp,
epnef20sdY9medium.rsp.
We subtract from the source and the local background in our pointing,
complementary data from a blank-field observation (kindly provided by
David Lumb) in order to take into account the particle background
(Majerowicz et al. Maj2002 (2002)).
The normalization between our pointing and the blank-field files
is determined by their count ratios at [10–12] keV
for the MOS and at [12–14] keV for the PN.
For the vignetting, we applied the weighting method
described by Arnaud et al. (Arnaud2001 (2001)).
Our spectra were binned to 3 before background subtraction,
except in 3.1.
xspec v11.1.0 was used for the spectral analysis.
All subsequent errors are quoted at 90 confidence.
Abundances are those of Anders & Grevesse (Anders89 (1989)).
3 The composite SNR
The radio data of SNR G0.9+0.1 clearly show a radio shell and
a very bright centrally condensed synchrotron nebula
(Helfand & Becker Helfand87 (1987)).
Within the PWN, two central (west and east) peaks
are present at 20 cm, while at 6 cm only the west peak is visible
(Fig.1 a,b in Helfand & Becker Helfand87 (1987)).
Up to now, there is no known X-ray counterpart to the radio shell,
while the PWN is clearly detected above about 2–3 keV
(Mereghetti et al. Mereghetti98 (1998), Gaensler et al.
Gaensler2001 (2001)).
Figure 1 shows the XMM-Newton EPIC images of the composite
SNR G0.9+0.1 in the energy band 1.5–12 keV with the radio contours overlaid.
We use the radio data initially from Helfand & Becker (Helfand87 (1987))
which have been re-analyzed by Gaensler et al. (Gaensler2001 (2001)).
The spatial resolutions are respectively 8′′ for XMM-Newton
and 40′′ for the VLA data.
Several X-ray bright point sources are observed
within the field such as HD 161507 (a F3V star)
and a bright X-ray source located to the south-west of G0.9+0.1 which
appears to correspond to the 2MASS source
2MASS1747178-281025 (according to the cross-correlation results
from XMM-Newton EPIC pipeline processing).
A more focused spectral study of the radio shell region brings for the first time
an indication of diffuse X-ray emission, which will be addressed in more detail
below. Furthermore, the large scale X-ray morphology of the PWN (R1’)
is in good agreement with the VLA radio contours
at 20 cm (Fig 1: right panel).
3.1 The SNR shell

We extracted spectra of the region corresponding to the radio shell (R 4’), excluding the PWN (see ellipse in Fig. 1: right panel). We adopt a 3 binning above background. Since the spectrum is strongly absorbed below 2 keV, due to the interstellar medium in the Galactic Center region, we focus on the energy band 2–10 keV. The background taken for the shell analysis is an annulus centered on the PWN within radii 4.4′ and 8.8′, excluding the bright sources. The background subtracted spectra shown in Figure 2, clearly reveal a signal above zero level which can be interpreted as the first detection of X-ray emission in this region. We fitted the combined MOS and PN spectra with both a non-thermal model (power-law) and a thermal model (mekal) with fixed at 1.391023 cm-2 as determined for the PWN (see 3.2). We find for the mekal model kT=3.4 keV (/d.o.f.= 17.3/15), and for the power-law model = 2.6 (/d.o.f.= 17.4/15). The inferred temperature is relatively high for a several thousand year old SNR.
Both models give respectively an unabsorbed flux (2–10 keV),
of 2.210-12 erg cm-2 s-1,
and 2.310-12 erg cm-2 s-1.
The inferred fluxes are in good agreement with the upper limit
quoted by Sidoli et al. (Sidoli2000 (2000)),
i.e. 310-12 erg cm-2 s-1.
We also carried out a spectral analysis
(fixing at 1.391023 cm-2)
of the brightest western region of the radio shell
(the statistic of the eastern part is too poor to allow
a spectral analysis).
Again, this region is dominated by the local diffuse emission
of the GC region and thus requires appropriate background subtraction,
which we extract from an adjacent field.
The corresponding fit results for the temperature
is kT2.7 keV (/d.o.f.= 3.5/5),
and is thus not well constrained.
A power law model yields =2.9
(/d.o.f.= 3.3/5).
We extracted an image in the energy band 3.9–5.8 keV,
i.e. in the spectral interval with maximum emission.
However, no distinct borderline is detected between the X-ray shell
and the diffuse medium located in the GC region.
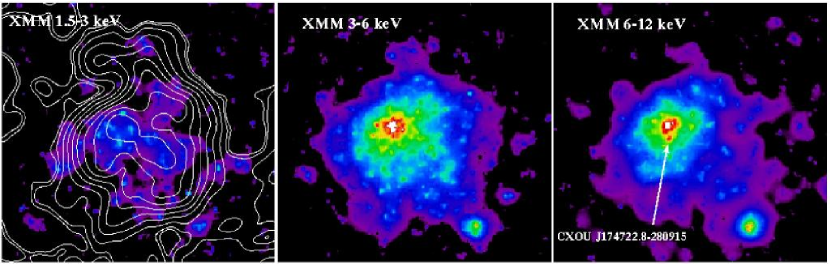
3.2 The PWN
We observe that the core
of the PWN is surrounded by extended diffuse emission
(Fig. 1: right panel).
The position of the X-ray core matches the eastern radio peak
while there is no bright X-ray counterpart to the western radio peak.
Figure 3 displays the PWN in different energy bands,
namely 1.5–3 keV, 3–6 keV, and 6–12 keV.
In the energy band 1.5–3 keV, there is little evidence
for a dominant core and the radio and X-ray morphologies are similar
(see Fig. 3: left panel).
The core of the PWN is only observable above
keV (Fig 3: middle and right panels).
At high energy (6–12 keV) the symmetry axis is analogous
to the one of Chandra data, the western radio lobe is very toned down,
and the faint X-ray source CXOU J174722.8-280915 is apparent
(Fig 3: right panel).
For comparison with previous studies, we fit the spectrum of the overall
PWN. The region considered is defined by the ellipse displayed
in Figure 1 (right panel).
Our spectra were binned to 3 before background subtraction.
We defined a local background corresponding
to the central MOS 1 CCD region,
excluding the bright point sources and the central part
within a radius of .
As shown in Figure 4,
the corresponding spectra extend up to almost 12 keV for the
PN data, and to about 9 keV in the MOS data, allowing strong constraints
to be placed on the slope of the continuum.
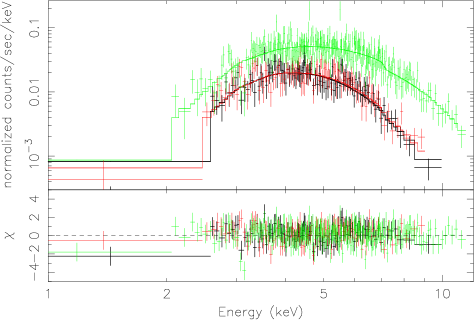
The data are well fitted by either an absorbed power-law or a thermal bremsstrahlung model. For the photo-electric absorption (), we use first the cross-sections of Morrison & McCammon (Morrison83 (1983), wabs). The best-fit parameters are reported in Table 1. We also applied the same spectral fitting to spectra with larger binsizes (higher signal to noise) and obtained fit results, which were in very good agreement with the values quoted here. The best-fit parameters relating to the power-law are compatible, within the error bars, with the BeppoSAX and Chandra values (Sidoli et al. Sidoli2000 (2000): =1.091023 cm-2, =1.95; Gaensler et al. Gaensler2001 (2001): =1.61023 cm-2, =2.4), though more tightly constrained.
| Model | or | F | ||
|---|---|---|---|---|
| ( cm-2) | (keV) | (446 d.o.f.) | ||
| wabs*pow | 1.47 | 1.99 | 379.6 | 5.78 |
| wabs*brems | 1.33 | 10.7 | 379.1 | 5.16 |
| tbabs*pow | 1.39 | 1.93 | 378.5 | 5.73 |
| tbabs*brems | 1.27 | 11.7 | 378.0 | 5.17 |
In the following, we use the updated cross-sections for X-ray absorption by the interstellar medium (tbabs in xspec) from Wilms et al. (Wilms2000 (2000)). The best-fit parameters although in good agreement with the previous ones (see Table 1), give systematically slightly lower values using tbabs absorption model than wabs absorption model. We obtain for the power-law model a luminosity in the 2–10 keV energy band of erg s-1 (d10 is the distance in units of 10 kpc).
3.3 CXOU J174722.8-280915
CXOU J174722.8-280915
is a point source located about 8′′ below the X-ray bright
core of the PWN in the Chandra observations and has
been identified as the pulsar itself by Gaensler et al. (Gaensler2001 (2001)).
In our XMM-Newton data, we are able to pick out this point
source only above 6 keV (Fig 3: right panel).
We extracted a spectrum from a circular region (R=5′′) centred on the position of the point source (Fig 3: right panel). For the background we took a region near the source avoiding any strong contamination from the core emission (due to the point spread function of the EPIC cameras). We used only the spectra from the MOS cameras which benefit from the best mirrors and pixel sampling. As in Gaensler et al. (Gaensler2001 (2001)), we explore the possibility that CXOU J174722.8-280915 corresponds to a young central pulsar. Its X-ray emission is then expected to be due to either modified black-body emission from the neutron star surface or non-thermal emission from the neutron star magnetosphere (e.g. Becker & Trümper Becker97 (1997)). As calculated by van Ripert, Link & Epstein (vanRiper95 (1995)), a neutron star with an age between 103 and 104 years should have a surface temperature of kT0.1 keV. Fixing at 1.391023 cm-2 and the temperature at 0.1 keV, we obtain a very bad fit with =2.4 (5 d.o.f.). Letting kT or free does not improve the fit. In contrast when we assume a non-thermal model (as in Gaensler et al. Gaensler2001 (2001)), with a photon index of =1.5 (typical for magnetospheric emission, Becker & Trümper Becker97 (1997)) and =1.391023 cm-2, we obtain a much better fit with =0.8 (5 d.o.f.). As for the black-body model, letting or free does not lead to an improvement in the fits. The corresponding absorption corrected flux in the 2–10 keV range is about 9.2 10-14 erg s-1, implying a luminosity of about 1033 d erg s-1.
|
 |
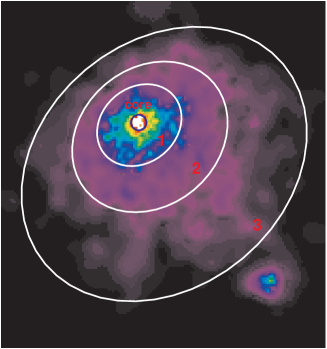
4 Large-scale structure in the PWN: tests of the plerionic interpretation
On large-scales the X-ray morphology of the PWN determined from the XMM-Newton observations is in relatively good agreement with the overall radio emission. The XMM-Newton data enable us for the first time to study the variation of the spectral index within the PWN. In other plerions, a softening of the spectrum with increasing radius has been observed; for example in 3C 58 (Torii et al. Torii2000 (2000), Bocchino et al. Bocchino2001 (2001)), G21.5-0.9 (Slane et al. Slane2000 (2000), Warwick et al. Warwick2001 (2001)) and IC 443 (Bocchino & Bykov BocchinoBykov2001 (2001)). This spectral softening can be explained by the shorter lifetime of high energy electrons compared to lower energy electrons. To look for this effect, we extract the spectra in four regions, which are displayed in Figure 5 (left panel). The outer ellipse corresponds to the region taken for the spectral analysis of the overall PWN (see 3.2). The observed spectra and best-fit models for regions 1 and 3 are shown, as examples, in Figure 2 in Porquet, Decourchelle & Warwick (Porquet2002a (2002)).
| /d.o.f. | F | |||
|---|---|---|---|---|
| ( cm-2) | ||||
| core | 1.39 | 1.16 | 18.2/18 | 0.24 |
| region 1 | 1.39 | 1.45 | 105.7/146 | 1.80 |
| region 2 | 1.39 | 2.00 | 121.2/136 | 1.66 |
| region 3 | 1.39 | 2.40 | 162.2/173 | 2.02 |
| core | 1.36 | 1.12 | 18.2/17 | 0.24 |
| region 1 | 1.54 | 1.61 | 104.5/145 | 1.95 |
| region 2 | 1.53 | 2.18 | 120.2/135 | 1.83 |
| region 3 | 1.35 | 2.35 | 162.1/172 | 1.96 |
We fit the spectra of these regions with an absorbed power-law model (tbabs*po), fixing to the value obtained for the overall PWN, i.e. 1.41023 cm-2 (see Table 1). The corresponding best-fit parameters are reported in Table 2. The value of the photon index shows a clear steepening of the spectrum from the inner part toward the outer part of the PWN (Fig. 5: right panel). Freeing the absorption column density does not result in significant better fits. There is no evidence for any absorption variation across the PWN, as the column densities are compatible to within 12 for the different regions of the nebula.
The spectral softening observed from the core to the outskirts of the PWN is consistent with synchrotron radiation losses of high energy electrons as they diffuse through the nebula. For comparison we show in Figure 5 (right panel) the radial variation of the spectral index measured for IC 443 (Bocchino & Bykov BocchinoBykov2001 (2001)). Our data show indication of a harder core and a stronger softening from the core towards the outer part of the G0.9+0.1 nebula, than is seen in IC 443, and also in other PWNe such as 3C 58 and G21.5-0.9 (see Fig. 5 in Bocchino & Bykov BocchinoBykov2001 (2001)). This suggests the possibility of a relatively strong magnetic field existing in the G0.9+0.1 pulsar and/or its SNR environment. The variation in the spectral index between the core and the PWN is roughly consistent with the empirical linear relationship derived by Gotthelf & Olbert (Gotthelf2001 (2001)) for 6 pulsars and their respective PWNe, i.e. =0.8+0.8. SNR G54.1+0.3 shows a similar spectral index, =1.09, for its pulsar region (Lu et al. Lu2002 (2002)), and =1.90.2 for the overall PWN (Lu et al. Lu2001 (2001)).
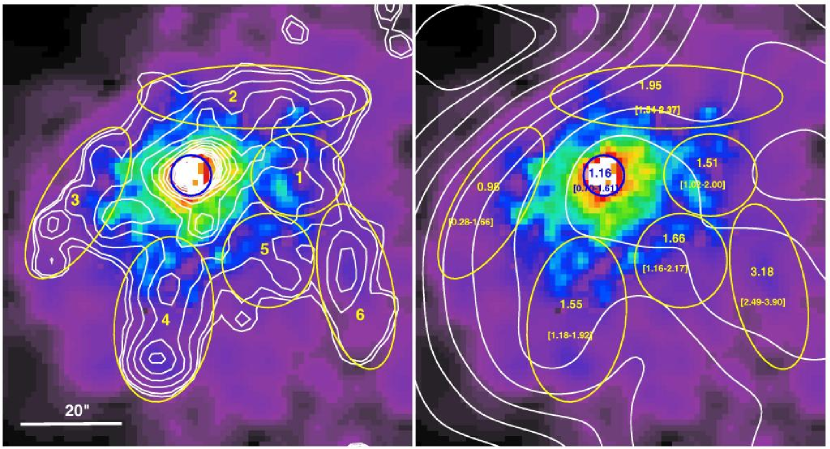
5 Small-scale structures in the PWN
The high angular resolution of Chandra has provided an unprecedented view of the X-ray morphology of this PWN. Relatively small-scale features identified in the Chandra observations (Gaensler et al. Gaensler2001 (2001)) include a semi-circular arc-like feature, a jet-like feature, and a bright clump close to a very faint unresolved source (CXOU J174722.8-280915, which as noted earlier is inferred to be the pulsar itself). This X-ray morphology is similar to other PWNe powered by young pulsars which display jets combined with a torus structure (e.g. Crab: Brinkmann et al. Brinkmann85 (1985), Weisskopf et al. Weisskopf2000 (2000); Vela: Pavlov et al. Pavlov2000 (2000)). The X-ray brightest region matches the eastern radio peak while the western side of the X-ray arc-like feature (structure 6 in Fig. 6) corresponds to the western radio peak.
In the radio band, as displayed in Figure 1 in
Helfand & Becker (Helfand87 (1987)),
there is a spectral index change between 20 cm and 6 cm, i.e.
the eastern peak present at 20 cm disappears at 6 cm.
The jet-like feature (structure 4 in Fig. 6)
corresponds to a distortion in the radio contours.
| structure | /d.o.f. | F | Chandra | |
|---|---|---|---|---|
| (2–10 keV) | identification | |||
| core | 1.16 | 18.2/18 | 0.24 | |
| 1 | 1.51 | 13.5/16 | 0.22 | |
| 2 | 1.95 | 21.8/25 | 0.32 | |
| 3 | 0.98 | 15.9/14 | 0.20 | “East arc”? |
| 4 | 1.77 | 13.6/21 | 0.28 | “jet” ? |
| 5 | 1.66 | 19.1/18 | 0.23 | |
| 6 | 3.18 | 13.8/12 | 0.22 | “West arc”? |
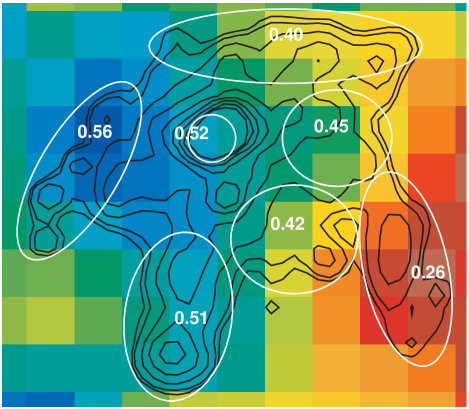
In our XMM-Newton close-up view, these small-scale features are not as clearly detected as in the Chandra data. However, the extent of this emission is about a factor 2 larger than observed with Chandra, thanks to the high sensitivity of XMM-Newton. Using as guide the locations defined by Chandra, we are able for the first time to derive the spectra of the various small-scale structures seen in the G0.9+0.1 PWN. Determining the spectral variations in these small-scale structures can give an indication of the geometry and orientation of the nebula. The best-fit parameters of the combined fits (MOS and PN) of the six regions identified in Figure 6 are given in Table 3. Figure 6 (right panel) also displays the spectral index measured for each region. The region corresponding to the eastern part of the arc-like feature, which was first revealed by Chandra, shows apart from the core region (=1.2 0.5) the hardest spectrum with a spectral index of (=1.00.7) among all the structures of the PWN. The former region encloses some unresolved bright knots which may be point-like sources, however if we exclude these bright sources we still obtain a very flat power-law form with 1.10.8 (=1.2, 12 d.o.f). In contrast the region corresponding to the western side of the arc-like feature, appears to have the steepest photon index (3.20.7) of any region within the PWN. In order to investigate spectral variations of the small scale structures, we constructed a subtracted background hardness ratio image ([6–10]keV/[3–6]keV) of the central region (see Fig. 7). It can be clearly seen that the eastern part of the arc-like feature shows harder X-ray emission than the western part. A possible explanation is that the east arc-like feature is pointing towards the observer, and that its spectral hardness is due to the relativistic beaming or Doppler boosting of the electrons, while the western arc corresponds to the opposite part of the torus suggested in the Chandra data. The region associated with the jet-like feature in Gaensler et al. (Gaensler2001 (2001)) does not exhibit a harder spectrum as suggested by their inferred hardness ratio. Splitting this structure into two parts, north and south, and fitting the spectra separately gives respectively as spectral spectral indexes 1.40.9, and 2.10.5. The possible observed curvature of this putative jet from small-scale to large-scale may be the result of an interaction with the high magnetic fields of the Galactic Center region.
6 Summary
We present first results of an XMM-Newton observation of the
composite supernova remnant G0.9+0.1 located in the Galactic Center
region.
The high sensitivity of the XMM-Newton
observatory allows for the first time
to detect diffuse X-ray emission in the region of the radio shell. We find an
unabsorbed flux of about 210-12 erg cm-2 s-1 (2–10 keV).
The XMM-Newton X-ray morphology is in relatively
good agreement with published (VLA) radio maps of the PWN.
We have carried out the first detailed X-ray spectral analysis of the
PWN inside G0.9+0.1. On large scales, there is a clear
softening of the spectrum with radial distance from the core,
a phenomenon which has been observed previously in a number
of X-ray plerions (e.g., 3C58, G21.5-0.9, IC443).
Detailed spectral analysis is also presented of the small-scale
structures evident in the PWN.
The eastern part of the arc-like
feature (revealed by Chandra) presents a reliable indication
for a very hard photon index (1.00.7),
while the western part presents a very soft spectrum (3.20.7).
A possible explanation is that the east arc-like feature is
pointing towards the observer, and that its spectral hardness is due to the
relativistic beaming or Doppler boosting of the electrons, while the
western arc corresponds to the opposite part of the torus suggested
in the Chandra data.
G0.9+0.1 provides further clues concerning the processes by which pulsars connect with their environment and is also important to illustrate a possible impact of the strong external magnetic field that pervades the Galactic Center region.
Acknowledgements.
This work is based on observations obtained with XMM-Newton, an ESA science mission with instruments and contributions directly funded by ESA Member States and the USA (NASA). The authors would like to acknowledge B.M. Gaensler for providing the radio VLA image. We would like to thank Jean Ballet for a careful reading of the manuscript, as well as the anonymous referee for valuable comments and suggestions. D.P. would like to thank the X-ray team at Saclay for developing much of the software used in the present analysis. D.P. thanks D.M. Neumann for fruitful discussions about data reductions and statistics. D.P. acknowledges grant support from the “Institut National des Sciences de l’Univers” and from the “Centre National d’Etudes Spatial”.References
- (1) Anders E., Grevesse N., 1989, Geochimica et Cosmochimica Acta, 53, 197
- (2) Arnaud M., Neumann D. M., Aghanim N., Gastaud R., Majerowicz S., Hughes J. P., 2001, A&A, 365, L80
- (3) Becker W., Truemper J., 1997, A&A, 326, 682.
- (4) Bocchino F., Bykov A. M., 2001, A&A, 376, 248
- (5) Bocchino F., Warwick R. S., Marty P., Lumb D., Becker W., Pigot C. 2001, A&A, 369, 1078
- (6) Brinkmann W., Aschenbach B., Langmeier A. 1985, Nature, 313, 662
- (7) Gaensler B.M., Pivovaroff M.J., Garmire G.P. 2001, ApJ, 556, L107
- (8) Gotthelf E.V. & Olbert C.M., 2001, in “Neutron Stars in Supernova Remnants” (ASP Conference Proceedings), eds P. O. Slane and B. M. Gaensler, in press [astro-ph/0112017]
- (9) Green D.A., 2001, “A Catalogue of Galactic Supernova Remnants”, Mullard Radio Astronomy Observatory, Cavendish Laboratory, Cambridge, United Kingdom (http://www.mrao.cam.ac.uk/surveys/snrs/).
- (10) Helfand D.J. & Becker R.H. 1987, ApJ 314, 203
- (11) Lu F. J., Aschenbach B., Song L. M., 2001, A&A, 370, 570
- (12) Lu F.J., Wang Q.D., Aschenbach B., Durouchoux Ph., Song L.M. 2002, ApJ, 568, L49
- (13) Majerowicz S., Neumann D. M., Reiprich T. H., 2002, A&A, 394, 77
- (14) Mereghetti S., Sidoli L., Israel G. L. 1998, A&A, 331, L77
- (15) Morrison R. & McCammon D., 1983, ApJ, 270, 119
- (16) Pavlov G. G. et al. 2000, AAS, 196, 3704
- (17) Porquet D., Decourchelle A., Warwick R.S. 2002, proceedings of the symposium ’New Visions of the X-ray Universe in the XMM-Newton and Chandra Era’, Ed. F. Jansen, in press [astro-ph/0204261]
- (18) Sidoli L., Mereghetti S., Israel G. L., Bocchino F. 2000, A&A, 361, 719
- (19) Slane P., Chen Y., Schulz N. S., Seward F. D., Hughes J. P., Gaensler B. M 2000, ApJ, 533, L29
- (20) Torii K., Slane P. O., Kinugasa K., Hashimotodani K., Tsunemi H. 2000, PASJ, 52, 875
- (21) van Riper K. A., Link B., Epstein R. I., 1995, ApJ, 448, 294.
- (22) Warwick R. S., Bernard J.-P., Bocchino F., et al. 2001, A&A, 365, L248
- (23) Weisskopf M. C., Hester J. J., Tennant A. F., et al., 2000, ApJ, 536, L81
- (24) Wilms J., Allen A., McCray R., 2000, ApJ, 542, 914