OPTICAL FeII EMISSION IN AGN
Abstract
We investigated the optical FeII emission in a sample of about 215 low-redshift AGN (quasars and luminous Seyfert 1 galaxies). We find that a scaled and broadened FeII template based on the I Zw 1 spectrum can satisfactorily model the FeII emission in almost all sources in our sample. We confirm that FWHM H and FeII4570 are strongly correlated. The correlation is different for sources with FWHM(H) greater than or less than 4000 km s-1. Sources with FWHM H 4000 km s-1 (Population A) show no difference between FWHM H and FeII while sources with FWHM(H) 4000 km s-1 (Population B) show FWHM FeII that is systematically smaller than FWHM H. This may be telling us that FeII emission in Pop. B sources comes from only the outermost part of the H emitting region where the degree of ionization is lowest.
1 Introduction
FeII emission has not been fully exploited as an emission line diagnostic, because the complexity of the Fe+ atom hampers reliable modeling. It was long ago realized that FeII is emitted in the BLR and that strong FeII emission requires a high density (ne 109 cm-3, high column density and low temperature (Te 5000 K; [1]) emitting region. These conditions are thought occur in a partially ionized region within the BLR created by strong X-ray emission ([2], [3] and [4]). The principal observational evidence for FeII emission from the BLR involves the profile (i.e. FWHM) similarity between optical FeII emission lines and the broad component of H ([5] and [6]). We show that the correlation between FWHM(FeII4570) and FWHM(H) is highly significant for a large sample of low redshift AGN; however, it takes a different form for sources with FWHM(H) greater or less than 4000 km s-1.
2 The Template
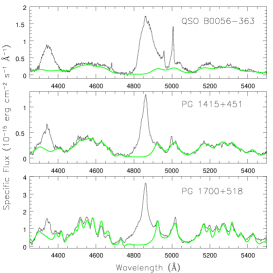
We derived FeII emission properties for each source using a scaled and broadened template extracted from a high S/N spectrum of I Zw 1. This method has already been successfully applied ([7], [8]). The template allows us to satisfactorily model and extract the FeII emission in about 98% of our sample. In other words, we found very few cases where the FeII line and multiplet ratios deviated from the I Zw 1 template. Fig. 1 shows examples of FeIIopt emission extraction in sources with very different broad line width.
3 FWHM(FeII4570) vs. FWHM(H)
Measurement of FWHM for optical FeII is not trivial. It is necessary to perform the following steps in order to parameterize optical FeII emission. (1) Define the local continuum using regions around 4200, 4700 and 5000 Åthat are relatively free of FeII contamination. (2) Subtract an adopted optical FeII template that has been scaled and broadened to give minimum residuals in the FeII4570Å. (3) Determine the template broadening factor that is proportional to FWHM(FeII4570) because the line FWHM is much larger than the instrumental profile. FeII equivalent width and FWHM measurement accuracy depends on S/N ratio and intrinsic width of the emission. Given a fixed S/N, there is a minimum W(FeII) for which the blends become undetectable (i.e., features are lost in noise or create a pseudo-continuum). FeII equivalent width measurements were obtained for 112 objects with an upper limit given for other sources. FWHM was derived for most, but not all, of the 112 sources. We usually estimated the FWHM uncertainty by evaluating a matrix where residuals were shown as a function of FeII intensity and broadening factor. FWHM boundaries were set when residuals were significantly worse than for the best fit. It was not always possible to constrain the width in sources where EW FeII was small.
In order to accurately measure FWHM(H) we also subtracted [OIII] 4959, 5007Åemission lines by interpolating between the blue and red edges. The broad and/or narrow components of Broad and/or narrow components of HeII4686 were subtracted, when present, using a Gaussian fit. Fig. 2 shows a correlation plot for FWHM(FeII4570) vs. FWHM(H). Outlying data points most likely reflect poor S/N, low resolution and/or FeII weakness rather than real differences. Only one outlier source is convincing: IRAS 07598+6508 (see §3.1). The correlation takes a different form if FWHM(H) 4000 km s-1 (Population A, following [9]) or FWHM(H) 4000 km s-1 (Population B):
-
•
Pop. A. There is a reasonably strong linear correlation (r) supporting the assumption that FWHM(H)= FWHM(FeII4570) and implying that both arise in the same emitting region.
-
•
Pop. B. There is also a clear correlation (R), however FWHM(H) appears to be systematically broader than FWHM(FeII4570).
 |
 |
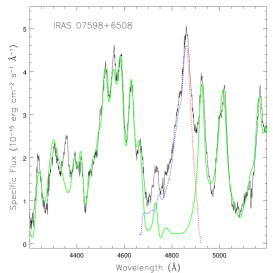
3.1 IRAS 07598+6508: a special case?
This intriguing FIR excess AGN source shows an unusual location in our optical Eigenvector 1 diagram ([10]). FWHM(H)=5000400 km s-1 and FWHM(FeII4570)=20001300 km s-1 in this source. The high S/N spectra and strength of the FeIIopt emission, along with the large EW(H), make this result especially striking. The strong blueward asymmetry of the BC in H (see fig. 3) suggests that additional broadening is present, due probably to Balmer emission from a highly blueshifted CIV1549 Å emitting wind. A narrower and unshifted component can be associated with low ionization emission typical of the majority of Type 1 AGN.
4 Conclusion
The most straightforward implications of our results may be that: 1) the FeIIopt emission mechanism is probably the same in almost all AGN and 2) FeIIopt emission is primarily emitted in a region of the BLR where H produced. FWHM FeIIopt in Population B objects appears to be systematically narrower than FWHM H. This suggests that FeII emission in Pop. B sources may come from only the outermost part of the H emitting region where the ionization degree is lower. This is again evidence supporting the population A-B distinction among AGN
Acknowledgements
We acknowledge support from the Italian MURST through Cofin 00–02–004.
References
References
- [1] S. Collin-Souffrin, M. Joly, S. Dumont, N. Heidmann, A&A 83, 190 (1980).
- [2] J. Kwan and J.H. Krolik, ApJ 250, 478 (1981).
- [3] J.H. Krolik and T.R. Kallman, ApJ 324, 714 (1988).
- [4] S. Collin-Souffrin, J.P. Lasota, PASP 100, 1041 (1988).
- [5] M.M. Phillips, ApJ 226, 736 (1978a).
- [6] M.M. Phillips, ApJ 38, 187 (1978b).
- [7] T.A. Boroson and R.F. Green, ApJS. 80, 109 (1992).
- [8] P.Marziani, J.W. Sulentic, D. Dultzin-Hacyan, M. Calvani, M. Moles ApJS. 104, 37 (1996).
- [9] J.W. Sulentic, P.Marziani, D. Dultzin-Hacyan ARA&A 38, 521 (2000).
- [10] P. Marziani, J.W. Sulentic, T. Zwitter, D. Dultzin-Hacyan, M. Calvani ApJ 558, 553 (2001).