New Chandra/ HST-STIS results on Seyfert I AGN: Photoionized Outflows
Abstract
We present soft X-ray results from observations with Chandra (HETGS) of the Seyfert I AGN NGC 4593 and Mrk 509. We discuss the photoionized outflows associated with Seyfert I AGN in terms of their absorption spectral signatures and discuss their kinematics, column density and ionization state. We discuss the link between UV and X-ray absorbers in Mrk 509 (which was simultaneously observed with Chandra and HST-STIS). We also briefly discuss the possibility of absorption due to neutral Fe embedded in the warm absorber of NGC 4593 versus an interpretation of the data in terms of soft X-ray relativistic emission lines. We conclude with a summary of what is being learnt about warm absorbers in type I AGN from high resolution spectroscopy.
1 Johns Hopkins University, 3400 N. Charles St., Baltimore,
MD21218.
2 NASA/GSFC, Code 662, Greenbelt Rd., Greenbelt, MD20771.
1. Introduction
The Chandra High Energy Transmission Grating Spectrometer (HETGS) currently provides the best spectral resolution available in the 0.5–10 keV band. The corresponding velocity resolution goes from FWHM at the O vii resonance line, to FWHM at 6.4 keV. There is now a sizable sample of HETGS observations of type I AGN, and we discuss here some new results from Mrk 509 and NGC 4593. We do not discuss observations with the Low Energy Grating (LETGS), nor do we discuss the few observations of NLS1, or type II Seyfert galaxies. Some of the key issues we address here are the range in properties of the photoionized outflow and the connection between the UV and X-ray absorbers.
2. The Soft X-ray Spectra
Detailed summaries and comparisons of the results of grating observations of photoionized outflows in different type I AGN can be found in Yaqoob, George, & Turner (2001) and references to individual objects therein. Here, we only have space to highlight a few facts which are emerging. Firstly, grating observations confirm earlier observations with CCDs, that there are highly ionized, outflowing warm absorbers in many type I AGN. Figure 1 shows the signature of warm absorption in NGC 4593; a flux deficit relative to a combined Chandra / RXTE best-fit hard X-ray power law extrapolated to soft X-ray energies.

Secondly, there is much evidence of more than one kinematic component. Even with the highest signal-to-noise data (NGC 3783, Kaspi et al. 2002), the two kinematic components apparent may themselves be composed of multiple, unresolved components (as is the case for the UV absorbers which can be observed with much higher velocity resolution). The centroids of the absorption lines are offset (usually blueshifted) from systemic velocity typically by to a few hundred . In one case (NGC 4051; Collinge et al. 2001), a blueshift as high as is observed. The absorption lines are often unresolved, and the profiles may be subject to uncertainties due to blending, so their true FWHMs are largely unknown, but we can say that they are in general.
The column densities are typically as high as a few . The ionization states are such that we commonly observe the lines of H-like O, Ne, and Mg (sometimes as well), and the first one or two resonance lines (to ) of He-like O, Ne, and Mg. The same for Si and S is observed in some cases. Many strong transitions due to various ionization stages of Fe are also common. Figure 2 shows the medium energy grating (MEG) data for NGC 4593 with the wavelengths of the Lyman series and He-like triplets of the most abundant elements superimposed. H-like and He-like ions of O, Ne, Mg, Si are clearly dominant in Figure 2 and several of the absorption features are marginally resolved (e.g. O viii Ly ()). Also in Figure 2 are several transitions and blends of transitions due to highly ionized Fe xx-xxv, as well as some unidentified features.

3. Photoionization Modeling
Despite the likely existence of multiple regions with different ionization states, given the signal-to-noise of the data, it is sometimes possible to model the X-ray spectrum with a simple, single-zone photoionized absorber. The best-fit photoionization model for Mrk 509 indicates that a single zone warm absorber with column density and ionization parameter ergs cm is adequate to explain the Chandra data (Yaqoob et al. 2002).
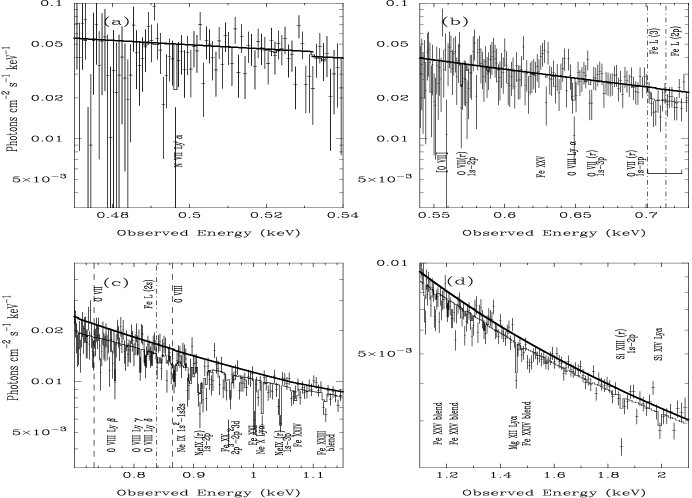
In the case of NGC 4593, we find also that a single zone warm absorber with and ergs cm is adequate to explain the bulk of the data (McKernan et al. 2003), part from some unidentified features and some line equivalent widths which are somewhat underpredicted. Figure 3 shows the best-fitting photoionization model (using the XSTAR code) superimposed on the NGC 4593 MEG data between 0.48–2.0 keV. The agreement between the model equivalent width and the individual absorption features in Figure 3 appears to vary considerably. However, the equivalent widths of the lines in the actual XSTAR spectra are calculated for a turbulent velocity width which is less than the thermal width. Also, the XSTAR model is subject to the limitations of a finite internal energy resolution. A more rigorous analysis, using the column densities from the XSTAR model, and the curve-of-growth, shows good agreement between the model and the identified absorption features (see McKernan et al. [2003] for details). The curve-of-growth analyses, consistent with the measured equivalent widths of absorption features in Mrk 509 and NGC 4593 respectively, indicate that the turbulent velocity widths for the X-ray absorber in Mrk 509 of km and of km in the case of NGC 4593. Mrk 509 and NGC 4593 are some of the first type I AGN that appear to be adequately modeled by a single-zone warm absorber, unlike sources such as MCG 6–30–15 which seem to require a multi-zone warm absorber (Lee et al. 2001).
The observation of Mrk 509 was performed simultaneously with HST-STIS in order to establish the elusive connection between the X-ray and UV absorbers. Details of the HST-STIS observation are given in Kraemer et al. (2003). Figure 4 shows velocity-resolved absorption profiles for some of the strongest absorption features in the Mrk 509 MEG data with UV kinematic components (vertical lines) and best-fit photoionization model (horizontal line) superimposed. It is clear from Figure 4 that both the UV and X-ray systems share the same velocity space. We found from photoionization modeling that the UV components have lower column densities and ionization parameters than the X-ray absorber. Thus we can imagine that the UV absorbers are embedded in the X-ray gas. A similar picture is emerging from the handful of other AGN which have been studied simultaneously in the UV and X-ray band (e.g. NGC 3783; Gabel et al. 2003).

Variability information is required to establish the distance, covering factor, and density of the X-ray absorber, and even then it is very difficult. Much monitoring data is required before any trends can be found.
4. Relativistic Emission Lines or Dust?
Narrow X-ray emission lines appear to be much rarer than absorption lines, and are often weak when present. It is possible to constrain density and temperature from He-like emission triplets, but it has not yet been established whether the emitter and the absorber are one and the same entity. The case for broad soft X-ray emission lines in two AGN (MCG 6–30–15 and Mrk 766) (e.g. from a relativistic accretion disk) has been made principally based on XMM data (e.g. Branduardi-Raymont et al. 2001). It is still controversial whether the apparent emission lines can be explained instead by absorption due to neutral Fe locked up in dust (e.g. see Lee et al. 2001). With the Chandra gratings we can only test for broadened O viii , not for C vi and N vii . Empirically we can look for more candidate objects by searching for a characteristic jump in the spectrum at 0.7 keV. This jump is either the sharp blue wing of a relativistic emission line, or an Fe L edge (at 0.707 keV). We have found only one other candidate AGN (NGC 4593) and this can be seen in Figure 1 and Figure 3. We find that an Fe L edge is a better fit statistically than a relativistically broadened O Ly emission line. Moreover if the energy of the jump coincides in three AGN with the Fe L edge this would imply that a relativistic disk line would have to be observed at the same inclination angle to within . Lee et al. (2001) propose that strong absorption in MCG 6–30–15 due to neutral Fe may result from dust grains embedded in the warm absorber. A neutral dust hypothesis suggests that absorption features due to neutral O, Si, Mg should also be present in the data. An absence of such strong features might indicate that there is an overabundance of Fe along the line-of-sight. More detailed analysis and discussion of this edge-like feature is presented in McKernan et al. (2003).
5. Conclusions
Grating observations of warm absorbers in type I AGN are revealing complex systems. The X-ray warm absorbers are highly ionized and flowing outwards relatively slowly (usually a few hundred km at most). They appear to have multiple unresolved kinematic components which are co-spatial with one or more of the UV absorbers. The UV absorbers have lower column densities and ionization parameters. Model-fitting shows the turbulent velocity widths are km for the X-ray absorbers. However, we there may be unresolved components in the X-ray absorption lines. The location and density of the absorbing gas is still unknown. Clear, narrow emission features have been detected in a few cases (e.g. NGC 3783, Kaspi et al. 2001; NGC 5548, Kaastra et al. 2002) and the density of the emitter is less than from He-like triplet diagnostics. Also, we do not yet know whether the absorption and emission regions are the same. It is also unclear whether broad, relativistic emission lines or neutral Fe probably bound up in dust can explain an edge-like feature around 0.707 keV in three AGN. A simple test to distinguish the two theories would be to see if the rest-frame energy of the edge-like feature were the same in a larger AGN sample.
Acknowledgments.
The authors gratefully acknowledge support from CXO grants GO1-2101X, G01-2102X (T.Y., B.M.), and NASA grants NCC-5447, NAG5-10769 (T.Y.). The authors are grateful to the Chandra and HST instrument and operations teams for making these observations possible. We thank our collaborators, I.M. George, T.J. Turner, S. B. Kraemer, D. M.Crenshaw, and J. R. Gabel. We also thank Tim Kallman for much advice on XSTAR.
References
Collinge, M. J. et al. 2001, ApJ, 557, 2
Gabel, J. R. et al. 2002, ApJ, accepted (astro-ph/0209484)
Kaastra, J. S. et al. 2002, A&A, 386, 427
Kaspi, S. et al. 2002, ApJ, 574, 643
Kraemer, S. B., Crenshaw, D. M., Yaqoob, T., McKernan, B., Gabel, J. R., George, I. M., & Turner, T. J. 2003, ApJ, 582, in press (astro-ph/028478)
Lee, J. C. et al. 2001, ApJ, 554, L13
McKernan, B., Yaqoob, T., George, I. M., & Turner, T. J. 2003, ApJ, in preparation.
Yaqoob, T., George, I. M., & Turner, T. J. 2001, in ASP Conf. Ser. Vol. 262, High Energy Universe at Sharp Focus: Chandra Science, ed. E. Schlegel, & S. Vrtilek (San Francisco: ASP), 203 (astro-ph/0111428)
Yaqoob, T., McKernan, B., Kraemer, S. B., Crenshaw, D. M., Gabel, J. R., George, I. M., & Turner, T. J. 2003, ApJ, 582, in press (astro-ph/0208530)