PECULIAR OUTBURST OF THE NEWLY REVEALED VARIABLE STAR V838 Mon
D. Kolev1, M. Mikołajewski2, T. Tomov2, I. Iliev1, J. Osiwała2,
J. Nirski2 and C. Gałan2
1 National Astronomical Observatory Rozhen, Institute of Astronomy, BAS, PO Box 136, 4700 Smolyan, Bulgaria, rozhen@mbox.digsys.bg
2 Centre for Astronomy, Nicolaus Copernicus University, Pl 87100 Torun, ul. Gagarina 11, Poland, mamiko@astri.uni.torun.pl
ABSTRACT. We present photometric and high- and low-resolution spectroscopic observations of the unusual outburst of V838 Mon. The data were collected at the NAO Rozhen, Bulgaria and at the Torun Observatory, Poland. Analysis of the peculiar behavior of the spectrum of the star is given. The star’s radial velocity of +60 km/s is derived. A brief discussion concerning the nature of the object is also given.
1 Introduction
The high-amplitude outburst star activity always focuses the attention. It is difficult for detection from the very beginning that causes the incomplete knowledge of these phenomena. V838 Mon is no exception. Brown (2002) first informed about the appearance of a new object in Monoceros. Its photographic and visual magnitude on January, 6.6-7.6UT was about 10. The first spectra showed numerous absorptions features some of them having P Cyg-type profile with radial velocities (RV) of km/s (Wagner 2002, Della Valle 2002). The object was identified with an anonymous star of (Munari et al. 2002). The event was puzzle: assumed as an extremely slow nova, the star showed no typical spectrum. The excess in of 0.8 mag corresponded to a distance d>3 kpc (Zwitter & Munari 2002). On February, 2 a second, rapid outburst begun and on February, 6-7 the maximum of V6.5 was reached. So, the at least “two-step” outburst had total amplitude of 9 mag! The light curve showed several “humps” before a rapid decline begun since the mid-April (Fig.1). A light echo, originating in circumstellar ring structures was detected (Henden et al. 2002, Bond et al. 2002, Munari et al. 2002).
2 Observations
We undertook spectroscopic and photometric observations within the framework of the joint project for investigation of the symbiotic stars between Institute of Astronomy, BAS and the Center for Astronomy, Torun University. The high-resolution spectra (0.2 and 0.4 Å) were collected with the coude-spectrograph + LN2-cooled CCD camera of the 2m telescope at NAO. The spectral intervals were: ÅÅ (1 night, ); ÅÅ (2 nights, ); ÅÅ (4 nights, and regions, including H (on all 8 nights, . One low-resolution (8 Å) slit less grizm-spectrogram was obtained at the Ritchey-Chretien focus using the focal reductor FORERO and the same CCD camera.
Low-resolution spectroscopic observations were carried out in the Torun Observatory at Piwnice on 11 nights (see Fig.1). The spectra were obtained with the Canadian Copernicus Spectrograph + CCD Peltier-cooling camera, attached to the focus of the 90 cm Schmidt-Cassegrain reflector. The resolution was 2 Å/pix.
Both high- and low-resolution frames were processed by standard IRAF procedures.
The photometric observations were carried out using the 60cm reflector at Torun Observatory.
3 Photometric behavior
Our observations do not cover the whole time interval of the event. That is why we use the available published data in order to analyze the photometric indicators. The light curve is presented in Fig.1. The data set is heterogeneous including standard , unfiltered CCD and simply visual estimates, but nevertheless the general shape of the curve is well enough outlined.
The first (at least) rise of the brightness had its maximum near the date of revealing the object. The V-brightness rose by 6.5 mag. Then the star underwent a monotonous decrease from 10 to 11 mag for 22 days. The reason for the brightening was the expansion of stellar pseudo-photosphere as rather slow, optically dense stellar wind (indicated by the “P Cyg”-type profiles of the lines).
It is difficult to estimate the slope of the first outburst. If we adopt a brightness of about 13 mag on December 22-25, 2001, the linear rate is 0.2 mag/day. Then, for a rise from 15.6 to 10 mag the star needs 30 days, i.e., the outburst may begin around December 10, 2001.
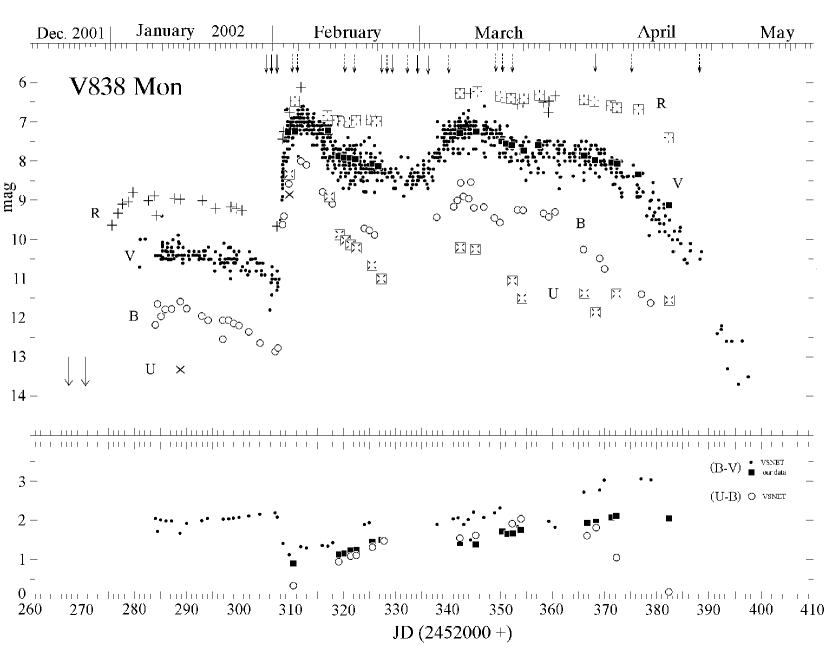
The second, “main”, outburst was very fast and the star increased its V-magnitude with amplitude for only 3–4 days. In the same time the color changed its value suggesting increase in temperature – a fact, confirmed by the changes in the spectrum (see below). The color reddened again when fast drop of the brightness begun on mid-April.
4 Evolution of the spectrum
The low-resolution spectra from Jan, 8–10 (Wagner 2002, Della Valle 2002) showed that near the maximum of the first outburst V838 Mon had a heavily reddened spectrum in which the absorption lines of neutral and singly ionized species prevail. Only H and few other lines (possibly BaII) had P Cyg profile with weak emission components. The measured colors corresponded to M-giant star.
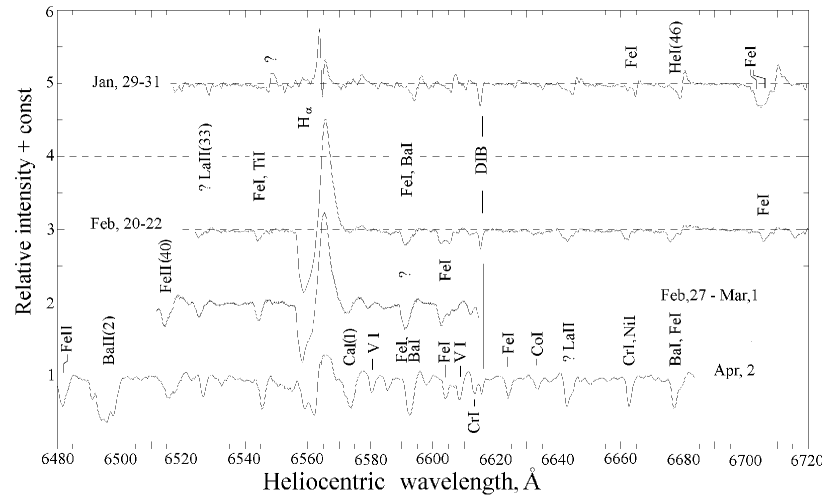
In the last weak before the second rise of the brightness, the spectrum remained reddened (T3000K, Lynch et al. 2002) and the line spectrum resembled K-giant. Many lines exhibited P Cyg shape with deep absorption and relatively weak emission components. Narrow H-absorption with positive RV presented in this time (see Fig. 2). Our spectra show the complex shape of all absorption components in P Cyg-profiles of ionized metals: the multi-component structure of the absorptions is evident. Due to unknown proper velocity of the star and the complexity of the RV-systems in the photosphere, the identification of the spectrum is very uncertain. There is some possibility to indicate line spectra of different excitation temperatures: on our frames some high-excitation lines, as NI or HeI can be suspected. Characteristic peculiarity of the spectrum of V838 Mon is the presence of numerous “diffuse interstellar bands” (DIBs). Especially strong and well outlined among them are those at 5782 Å and 6379 Å (Fig. 3).
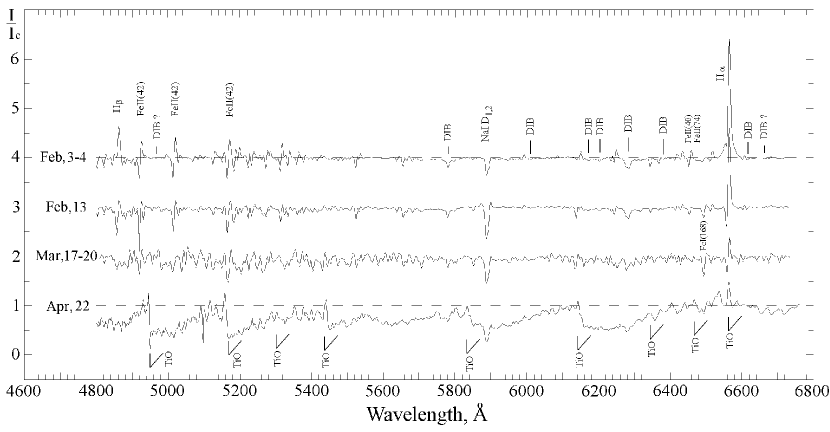
In the night of the second outburst the spectrum radically changed its outlook: the number of ionic lines (FeII, CrII, TiII, SiII, etc.) with strong P Cyg-emissions rose significantly. As can be seen on our low-resolution spectra (Fig. 3) H and H showed strong emissions (H exceeded 2.5 times the continuum level) while one can hardly see the absorption component of the lines. The line spectrum resembled rather late or early star. Two days after the main maximum the color resembled a late or early giant or supergiant.
During the next month the spectrum remained at color temperature about 4000K (Geballe et al. 2002) while the line spectrum underwent serious changes - see Fig.2 and 3: H and many of the other lines developed strong P Cyg profiles with deep and relatively wide absorptions while the emission components decreased.
Since the mid-March the emission component of H strongly decreased (Fig. 3) and even disappeared in H. The brightness progressively decreased and the photosphere evidently became cooler. TiO-bands traces possibly can be found on our spectra from March 17–20.
The spectra obtained on April 9 and 22–23 showed a drastic change in the line spectrum (Fig. 3). The M-giant TiO absorption bands strengthened, the P Cyg emissions of the near-IR CaII triplet disappeared. The only significant emissions remained those of H, NaID and several metallic lines. The spectrum looks like that of late M giant with a temperature of about 3000K (Henden et al. 2002). This temperature drop was interpreted as an expansion of the photosphere (Rauch et al. 2002). These spectral changes correspond with the drastic drop in the star’s brightness showed in Fig.1.
5 Spectral lines from high-resolution spectra
The evolution of the V838 Mon spectrum demonstrates the unlikeness of this event from the known nova-like phenomena. No high-excitation emission or forbidden lines appeared; no nebular spectrum was developed. Evidently the nature of the star is another and to obtain an idea about this phenomenon we must know some star’s characteristics, such as distance, velocity field in the photosphere, etc. The high-resolution frames provide the only data that can be of use in such a task.
5.1 Proper motion
The complex shape of the spectrum of V838 Mon makes identification of all features extremely difficult. The absence of symmetric, pure absorption lines in our spectra does not allow measuring the proper radial velocity of the star. A possible solution can give the Gaussian-fitting of the H-profile obtained on the end of January (see Fig. 2). The reason for such an attempt gives the fact, that only in the spectra from this period more or less symmetric emission component, not flanked by absorption, appeared. The emission ( Å, ) has a heliocentric =6564.155 Å and narrower ( Å), deep () absorption is centered on 6564.447 Å. Assuming spherical emitting volume one can propose the radial velocity shift of the emission km/s to reflect the real proper radial velocity of the star . The radial velocity of the absorption is km/s. The close of both H emission and absorption features possibly argue the presence of absorbing stationary or rotating zone around the star.
5.2 Interstellar (and circumstellar?) NaID lines
The heavily reddened continuum observed, the numerous strong DIBs and the pronounced interstellar (IS) components of NaID lines (see Fig. 4) witnesses at first glance for great distance to the star. The discovery of the light echo indicating the presence of surrounding nebula or cocoon additionally complicates the situation. In the same time this event fortunately allowed to estimate the distance in an independent from the interstellar absorption way. Henden et al. (2002) evaluated the distance d=700 pc and finally Munari et al. (2002) fixed the distance to 79030 pc.
The analysis of the IS-lines components also can give useful information concerning the absorption toward the star. There exists a well established relation between the mean equivalent width (in Å) of both D1(5896 Å) and D2(5890 Å) lines and the distance (in kpc): (Allen 1973). The region around NaID lines from our high-resolution spectra is presented in Fig. 4. In fact each of both IS D-lines has a complex shape, clearly resolved in 0.1 Å/pix spectra obtained on Feb, 27 and Mar, 1 (the solid line in Fig.4). The significantly wider ( Å) blue-edge component surely indicate even more complex structure of the interstellar matter toward V838 Mon. Both IS-components a, b of each D-line have mean of +37.2 km/s and +63.9 km/s. The of the components for these three periods of observation lie between Å for D1 and Å for D2. The mean are 0.84 and 0.94 Å respectively with mean Å. According to the above cited relation this value correspond to a distance kpc if a “normal” interstellar reddening law is adopted. The discrepancy of this value from the established by the light-echo is evident. Even more significant is the difference from the early-established d>3 kpc.
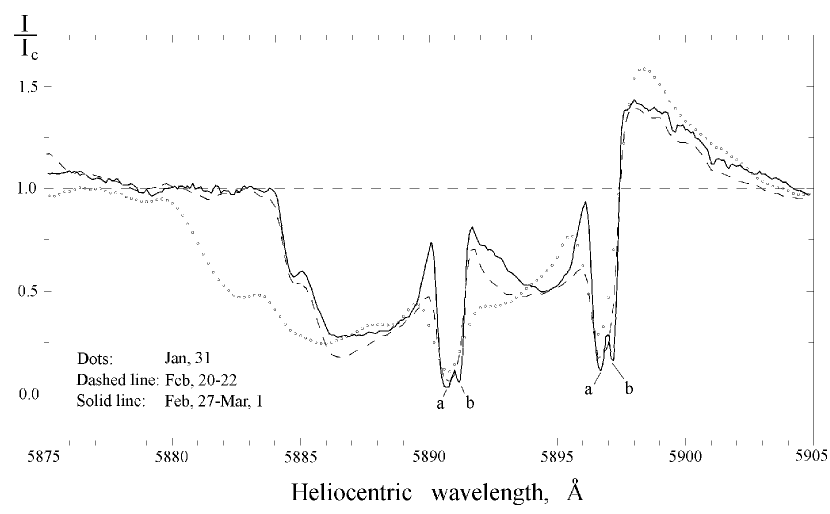
Munari et al. (2002) briefly discussed the interstellar reddening toward V838 Mon. They concluded that the color excess for this star lies between 0.25 (if kpc) and ( kpc). The adopted value is confirmed as well by their polarimetric observations. We agree that the presence of circumstellar mater changes in unpredictable way the absorption and the reddening may differ significantly from the “standard” one. The circumstellar gas and dust that contributes to the strength of the IS-lines or of the DIBs must have some radial velocity, characterizing the mass-outflow. If the proposition for mass-loss from the star with a velocity of 15 km/s (Zwitter & Munari 2002) is true, there must be a component with km/s according to the . Having km/s one can expect the presence of a component with km/s. Our measured coincide with the velocities measured by Zwitter & Munari (2002) after the heliocentric correction of about km/s for their date of observation – January, 26. So we can conclude, that the wider IS-component ( km/s) can be affected or even can be fully generated by the circumstellar outflow material. If we exclude this component from the estimations, the mean of the narrower component of 0.33 Å gives d0.7 kpc! Despite this formal closeness to the light-echo derived distance, we must reject the NaID interstellar lines as an indicator of the distance. Nevertheless the analysis of the shape of the Na-lines allows us to conclude, that the contribution from the rich in matter environment of the star certainly can be responded also for the unusually strong DIBs that may be simply diffuse circumstellar bands.
5.3 Outflow velocities
The spectral lines showed most complex shape just before the main outburst. The mean of six FeII lines (well seen in Fig. 2) radial velocity profile in our end-of-January frames can be fitted with at least 4 absorption components. They have heliocentric of , , and km/sec (with boundary near km/sec). The emission component has about km/sec. The ( km/sec) of this emission coincides with that of the H-emission discussed above in §5.1.
The “typical” of the metallic lines in the end of February were between km/sec while the most rapid components showed of or even km/sec (very week features). The hydrogen lines absorptions were with of (H) and (H) km/sec. The same value for H was registered also on our April 2 frame.
6 Discussion: what is V838 Mon?
We already noted the strange behavior of V838 Mon. Different authors tried to find analogues to the event: from “peculiar slow nova or post-AGB star in outburst” (Della Valle & Iijima 2002), “a close analogue of FG Sge, V605 Aql and V1334 Sgr” (Henden et al. 2002a) to an analogue of “the very luminous extra galactic red variable ‘M31RV’ that had a long outburst in 1988” (Bond et al. 2002). Comparing the light curve shape of V838 Mon with other known eruptive objects, we can note the following. The summary amplitude of the event, mag and the shape of the curve are similar to that of some known Novae. The important nova’s parameter (the interval since the moment of maximum until the decreasing of brightness by 3 mag) for V838 Mon is days. Similar value for (70 days) and for the amplitude ( mag) had the fast nova HR Lyr (1919) (Allen 1973). The comparison with FG Sge shows drastic discrepancies: the brightness of FG Sge increased almost linearly from 14 to 9.5 mag (amplitude of only 4.5 mag) for more than 60 years (Herbig & Boyarchuk 1968)! The V838 Mon’ light curve resembles also the curve of the eruptive variable HM Sge (Ciatti et al. 1977). The last star was classified as early PN-stage or as an object related to V1016 Cyg and V1329 Cyg, but not as a typical symbiotic star (Arkhipova et al. 1979), while now it is considered to be a symbiotic nova (Schmid 2000). The symbiotic nova RR Tel has amplitude of 10 mag. A number of other kinds of variable luminous stars show comparable amplitudes. So, Mira Cet changes its magnitude from 2 to 10 mag. But the spectral behavior that V838 Mon demonstrated differs completely from the spectral evolution of classical and symbiotic novae or Miras.
There can be also found more “contra” than “pro” arguments comparing V838 Mon with the other cited objects. Possibly, the suggestion proposed by Munari et al. (2002) that we are looking at new class objects may be a clue to the understanding of V838 Mon?
Acknowledgments. We are grateful to Drs. D. Kyurkchieva and D. Marchev from the Shumen University for obtaining a spectrum on April 2 and Drs. T. Bonev and E. Semkov from IA BAS for low resolution FORERO-frame. This study was partly supported by Polish KBN Grants 5 P03D 003 20 and 5 P03D 013 21.
References
Allen C.W., 1973, Astrophysical quantities, 3rd ed., §108, Univ. of London,
The Athlone Press
Arkhipova V.P., Dokuchaeva O. D., Esipov V.F., 1979, Astron Zh, Vol.56,
#2, 313
Bond H.E., Panagia N., Sparks W.B., Starrfield S.G. and Wagner R.M.,
2002, ”HST observations of V838 Mon light echo” (in vsnet-campaign-
v838mon 363 from May, 4)
Brown N. J., 2002, IAU Circ. 7785
Ciatti F., Mammano A., Vittone A., 1977, A&A, 61, 459
Della Valle M., Iijima T., 2002, IAU Circ. 7786
Geballe T.R., Evans A., Smalley B., et al., 2002, IAUCirc. 7855
Henden A., Munari U., Schwartz M., 2002a, IAU Circ. 7859
Henden A., Munari U., Marrese P., et al., 2002b, IAU Circ. 7889
Herbig G.H., Boyarchuk A., 1968, ApJ, 153, 397
Lynch D.K., Rudy R.J., Mazuk S., et al., 2002, IAU Circ. 7829
Munari U, Henden A, Kiyota S., et al., 2002, A&A, 389, L51
Rauch T., Kerber F., van Wyk F., et al., 2002, IAUCirc. 7996
Schmid H.M., 2000, ”Observations of hot stellar winds in symbiotic sys-
tems”, in: Thermal and Ionization Aspects of Flows from Hot Stars:
Observations and Theory. ASP Conference Series, Vol. 204, eds.
H. J.G.L.M. Lamers and A. Sapar, p. 303
Wagner R. M., 2002, IAU Circ. 7785
Zwitter T., Munari U., 2002, IAU Circ. 7812