An outflow from the nebula around the LBV candidate S 119
We present an analysis of the kinematic and morphological structure of the nebula around the LMC LBV candidate S 119. On HST images, we find a predominantly spherical nebula which, however, seems to be much better confined in its eastern hemisphere than in the western one. The filamentary western part of the nebula is indicative of matter flowing out of the nebula’s main body. This outflow is even more evidenced by our long-slit echelle spectra. They show that, while most of the nebula has an expansion velocity of 25.5 km s-1, the outflowing material reaches velocities of almost 140 km s-1, relative to the systemic one. A ROSAT HRI image shows no trace of S 119 and thus no indications of hot or shocked material.
Key Words.:
Stars: evolution – Stars: individual: S 119 – Stars: mass-loss – ISM: bubbles: jets and outflows1 Introduction
Stars with masses in the range of and luminosities of populate the upper left end of the Hertzsprung-Russell Diagram (HRD). In their short lives of yrs they evolve from hot O stars on the main sequence towards cooler temperatures, first at almost constant luminosities. They soon enter a phase of very strong mass loss of up to . This influences their further evolution dramatically: They do not evolve further towards lower temperatures, i.e., towards the red supergiant state, but rather turn in the HRD and become hotter again, albeit later less luminous (e.g., Schaller et al. 1992; Langer et al. 1994).
The region in the HRD where this turn occurs is known to be the domain of the Luminous Blue Variables (LBVs). There exists an empirical limit that separates a region in the HRD into which the most massive stars do not evolve, the so-called Humphreys-Davidson Limit (Humphreys & Davidson 1979, 1994). Here the stars not only exhibit large continuous mass loss, but at least some of them undergo giant eruptions. Both, the continuous wind and the eruptions lead to a peeling off of the outer parts of the stellar envelope and to the formation of circumstellar LBV nebulae (LBVN; e.g., Nota et al. 1995). Humphreys & Davidson (1994) classify 32 stars as LBVs and an additional 9 as candidates. 9 of the LBVs and candidate stars are located in the Milky Way and 10 in the Large Magellanic Cloud (LMC).
S 119 (–69 ) is one of the LBVs in the LMC. It was classified as Ofpe/WN9 star by Bohannan & Walborn (1989). Since the early eighties, there was already the suspicion of a close relation between Ofpe/WN9 stars and LBVs when R127, located again in the LMC and previously classified as Ofpe/WN9 underwent an LBV outburst (Stahl et al. 1983). The evidence for a connection between the two stellar classes has become even stronger since then, as longtime spectroscopic monitoring of LBVs and Ofpe/WN9 stars became available (see, e.g., Stahl & Wolf 1986; Wolf et al. 1988; Bohannan & Walborn 1989; Nota et al. 1996; Pasquali et al. 1996).
After discovering a nebula around S 119, Nota et al. (1994) classified the star as an LBV candidate. Their ESO New Technology Telescope (NTT) image shows a nebula of 7″ 9″ size (corresponding to 1.9 pc 2.1 pc for an assumed distance of the LMC of 51.2 kpc), with a brighter lobe. Their NTT/EMMI spectra indicate an expansion velocity of the S 119 nebula of km s-1, and a ratio of Hα/N , leading to [N ii]6583Å/Hα. They derive a radial velocity of the star and of the center of expansion in the range of km s-1. This casts doubt on S 119 being a member of the LMC the radial velocity of which as derived from H i observations (Rohlfs et al. 1984) is typically in the range of km s-1.
From the line ratio of [S ii]6716/6731 Å Nota et al. (1994) derived an electron density of cm-3 and—assuming an electron temperature of K—estimated a nebula mass of M⊙. Similar results for the nebula were reported by Smith et al. (1998). They describe the nebula as elliptical of size 77 86, with K as estimated from the non-detection of the [N ii]5755 Å line, and cm-3. Little reddening and a radial velocity of km s-1 supports S 119 not being a member of the main body of the LMC. The main stellar parameters of S 119 have been determined by Crowther & Smith (1997) using two different models to account for the contamination of the nebula in the stellar spectrum: , , and . In this contribution, we present results of an analysis of the kinematics of the nebula around S 119 and put it for the first time into perspective with the nebula’s high-resolution morphology as obtained from Hubble Space Telescope (HST) images. Moreover, we use the non-detection of S 119 and its nebula with the High Resolution Imager (HRI) on board the Röntgensatellit (ROSAT) for determining and discussing upper limits of the X-ray emission.
2 Observation and data reduction
2.1 Imaging
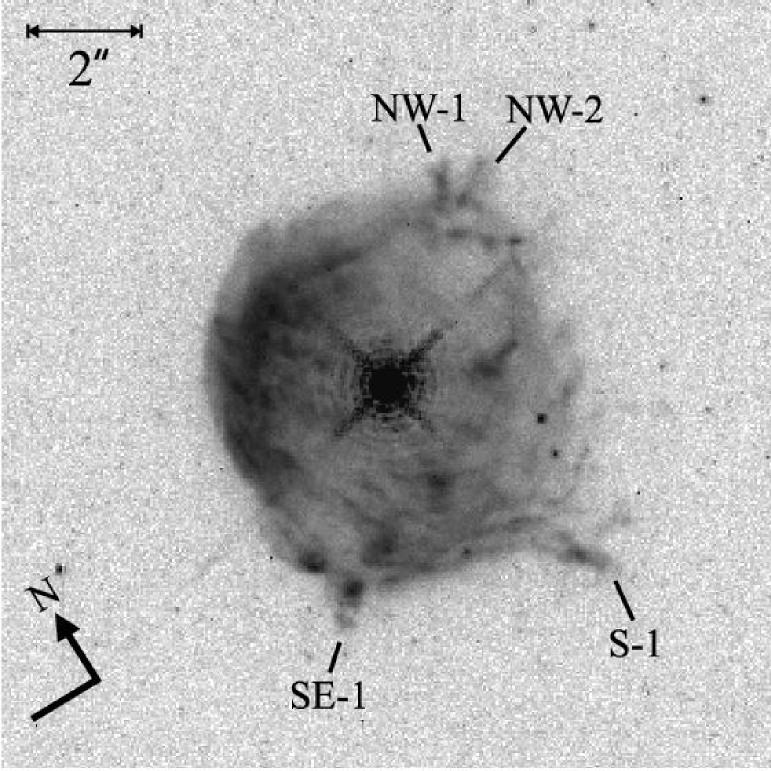
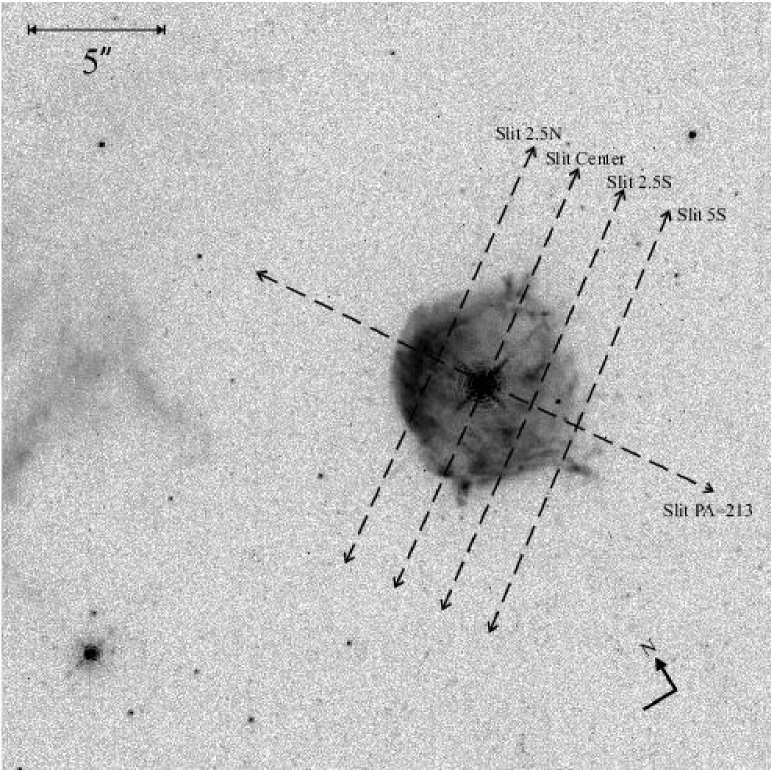
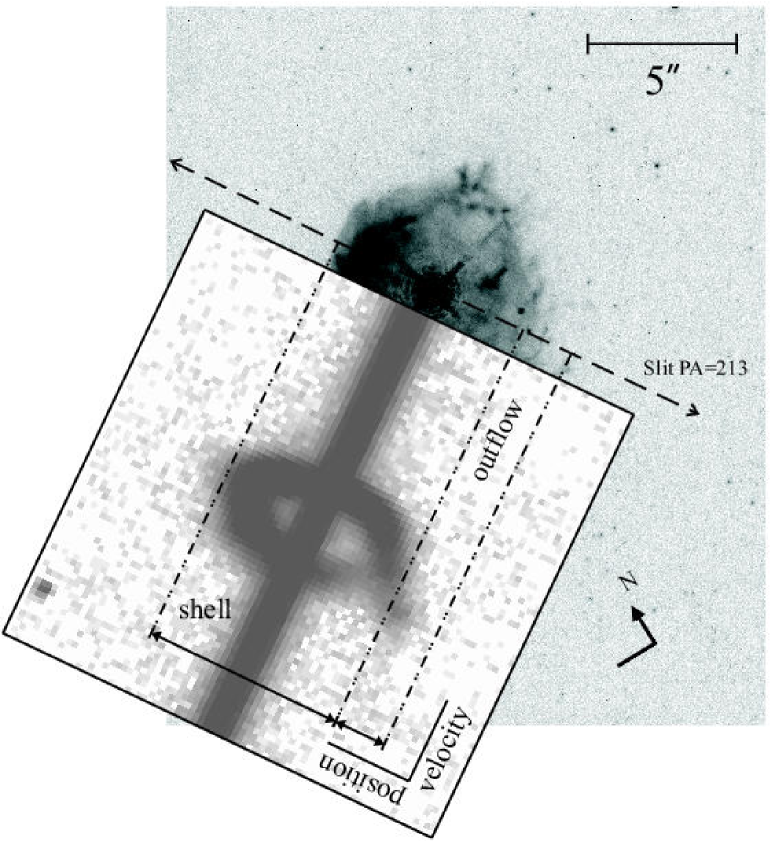
For the morphological analysis we retrieved from the STScI data archive all images of S 119 taken with the HST Planetary Camera (PC) of the Wide Field Planetary Camera 2 using the F656N (Hα) filter111program number: 6540; P.I.: Regina Schulte-Ladbeck; dataset names: U4KY0301R…U4KY0308R. The exposure times were 500 s for four images, and 5 and 30 s for two each. The data were reduced with the standard STSDAS/IRAF routines. In total the four 500 s exposures were combined and cosmic-ray cleaned. They were not mosaiced since the nebula is fully covered by the PC field of view. The pixel size in the Planetary Camera is 0.0455″ per pixel, the effective resolution about 01. The images were not rotated or binned to make sure to maintain the full resolution. The celestial directions therefore are indicated in the images. The HST system position angle is 148.5°. Fig. 1 shows a section of from the reduced PC image which we used for the analysis. The almost full field of view of the PC image is shown in Fig. 2.
2.2 Long-slit echelle spectroscopy
For the kinematic analysis of the S 119 nebula we obtained high-resolution long-slit echelle spectra with the 4 m-telescope at the Cerro Tololo Inter-American Observatory. For the order selection we replaced the cross-disperser by a flat mirror and inserted a post-slit Hα filter (6563/75 Å). This setup left us with a long-slit vignetted to a length of and a spectral range that contained the Hα line and two [N ii] lines at 6548 Å and 6583 Å. We chose the 79 l mm-1 echelle grating and a slit-width of 150 m (corresponding to 1 ″), which lead to an instrumental FWHM at the Hα line of 8 km s-1. The data were recorded with the long focus red camera and a pixel CCD with a pixel size of 0.08 Å pixel-1 along the dispersion and 026 pixel-1 on the spatial axis. Seeing was . Thorium-Argon comparison lamp frames were taken for wavelength calibration and geometric distortion correction. Telluric lines visible in the spectra were used to improve the absolute wavelength calibration of which we estimate an accuracy of better than 0.08 Å.
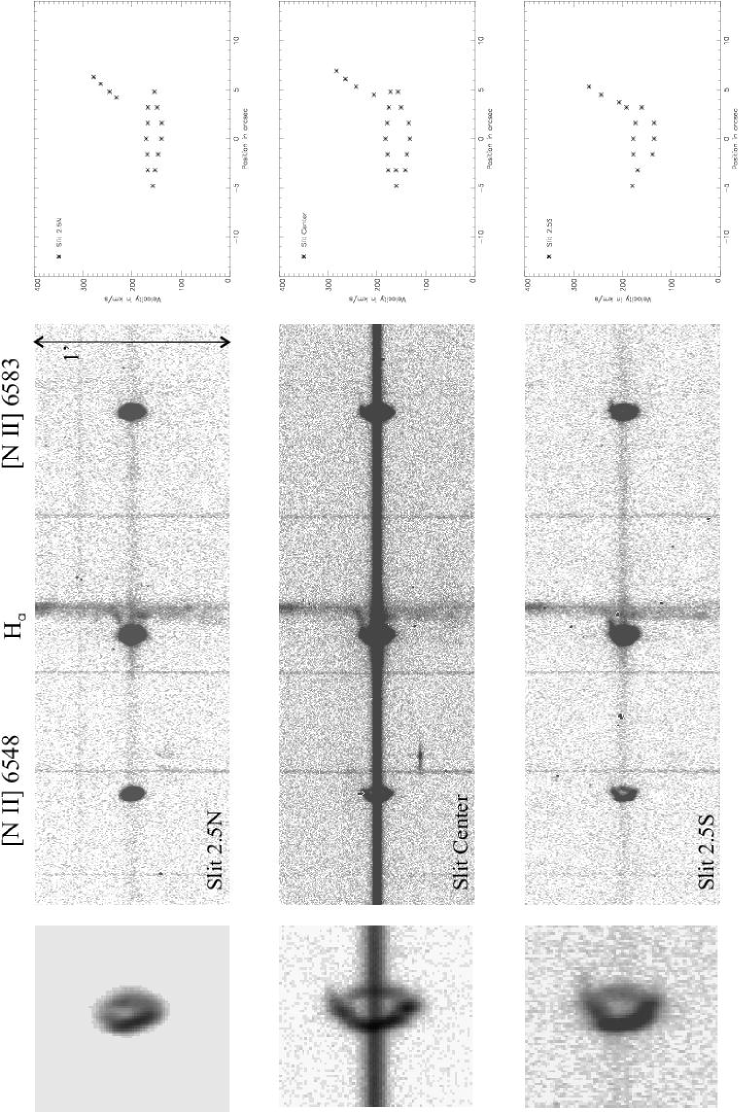
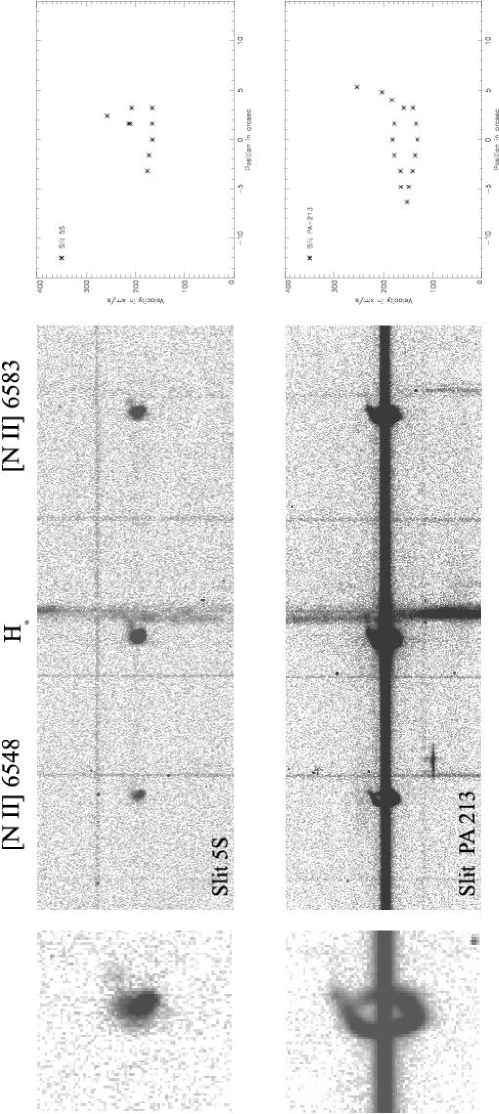
We observed at two different position angles (PA) which were nearly perpendicular to each other. Four slit positions mapped the nebula with a , one centered on the star (Slit Center), one offset 25 to the north (Slit 2.5N) as well as one each at 25 and 5″ to the south (Slits 2.5S and 5S). One additional observation was made with the slit oriented to and centered on S 119 (Slit PA=213). Fig. 2 shows the slit positions. Fig. 3 and 4 summarize our spectroscopic observations. The left column of Fig. 3 and 4 show the echellograms of each slit position we observed, the right column the corresponding position velocity diagrams (-diagrams). The echellograms are 54 Å long and extend 1′ in spatial direction, centered on the projected position of the star. The top of the echellograms points towards north-west for and towards south-west for . In each echellogram an insert (of Å) shows the expansion ellipse of the stronger [N ii] line (6583 Å) at a different cut level. The slits are identified according to the nomenclature as introduced above. In the -diagrams the positions are given as offsets from the projected location of the star. Offsets to the north-west (or, in the case of Slit PA=213, south-west) are counted positive. The velocity measurements for the -diagrams followed from the Hα and the stronger [N ii] line at 6583 Å. We estimate an error of the line fits to determine the radial velocities between 0.5-1 km s-1, this is well below the printed symbol size in the -diagramms. All velocities are with respect to the heliocentric system, unless mentioned otherwise.
2.3 ROSAT HRI data
In addition to the optical morphology and the kinematic analysis we looked up ROSAT HRI observations of the S 119 region. The ROSAT satellite was sensitive to X-ray emission between 0.1 and 2.4 keV and its HRI achieves a spatial resolution of . A 21 ks ROSAT pointing222P.I.: You-Hua Chu, HRI-pointing: rh600635n00 was retrieved from the Max-Planck-Institut für Extraterrestrische Physik (MPE) ROSAT data center. After reduction and analysis of the X-ray image with IRAF/PROS333PROS is developed, distributed, and maintained by the Smithonian Astrophysical Observatory, under partial support from NASA contracts NAS5-30934 and NAS8-30751., we found no traces of S 119 in the data.
3 Morphology from the HST image
Previous images of the nebula around S 119 taken with the NTT show an axisymmetric shell, with a conspicuously brighter lobe at the north east (Nota et al. 1994). The HST F656N images resolve the nebula around S 119 and show that it is approximately spherically symmetric, with an average diameter of 75. Assuming that S 119 is at the same distance as the LMC ( kpc), this corresponds to a size of 1.8 pc. With the help of the HST especially the small scale structures in and around the nebula of S 119 are clearly detected, which were not seen in previous ground-based images. A large amount of these filamemtary structures can be seen in addition to the spherical main body of nebula. The most prominent ones are four filaments extending out of the nebula, two next to each other to the north-west (marked NW-1 and NW-2 in Fig. 1), one to the south (S-1), and one to the south-east (SE-1). These filaments extend beyond the nebula’s main body by 096, 181, 096, and 068, respectively. On the west side, between filaments NW-2 and S-1, at the rim of the main body, numerous filaments of comparatively low surface brightness extend beyond it. Here, no clear border of the spherical main body is visible. In his region, some of the filaments appear to be even detached from the main body of the nebula.
In the east, the surface brightness of the nebula is highest, with an Hα surface brightness of 8 10-14 erg cm-2 s. This brighter area marks the region seen in seeing-limited NTT images. In the inner part of the nebula the surface brightness is quite low ( erg cm-2 s on average, with some of the filaments being weaker by almost another order of magnitude). There it is far from a homogeneous structure. On the other hand, there are also knots and filaments distributed all over the nebula which are as bright as the eastern part of the nebula. This combination of unevenly high and low surface brightness features give rise to the nebula’s patchy appearance.
4 The kinematic structure of the nebula
Our high-resolution echelle spectra allow us to analyze the kinematic structure of the S 119 nebula in great detail. At a FWHM resolution of 8 km s-1 our observation fully resolve the global structure of the Doppler ellipse of the expansion of the S 119 nebula.
4.1 The overall expansion
We find a radial velocity of the center of expansion at km s-1. This is in agreement with earlier findings that the radial velocity of the S 119 system is well below that of the main part of the LMC. The echellograms show background Hα emission along the entire slit at all positions, which presumably results from an H ii region within the LMC. The radial velocity of this H ii region of km s-1 is consistent with it being located in the LMC. With respect to this H ii region, the S 119 nebula moves with about 100 km s-1 more along the line of sight.
All spectra passing over the central part of the spherical main body of the nebula show an expansion ellipse as expected for a spherical expansion. We derive a maximum expansion velocity of km s-1 at the central position in both slits that cross the central star (see -diagrams for Slit Center and for Slit PA=213 at the position 0″ in Figs. 3, 4). As we move away from the geometric center of the nebula, the slits (Slit 2.5N and Slit 2.5S) prove the decrease of the expansion, that reduces to 15.5 km s-1 and 21.4 km s-1 respectively.
We measured sizes of the Doppler ellipses in our echelle data and get diameters of 60 (Slit 2.5N), 91 (Slit Center), and 68 (Slit 2.5S), respectively. These sizes were determined from the spectra and not from the binned -diagrams. Given the considerably different spatial resolutions these values agree with those derived from the HST images (57, 86, and 62, respectively).
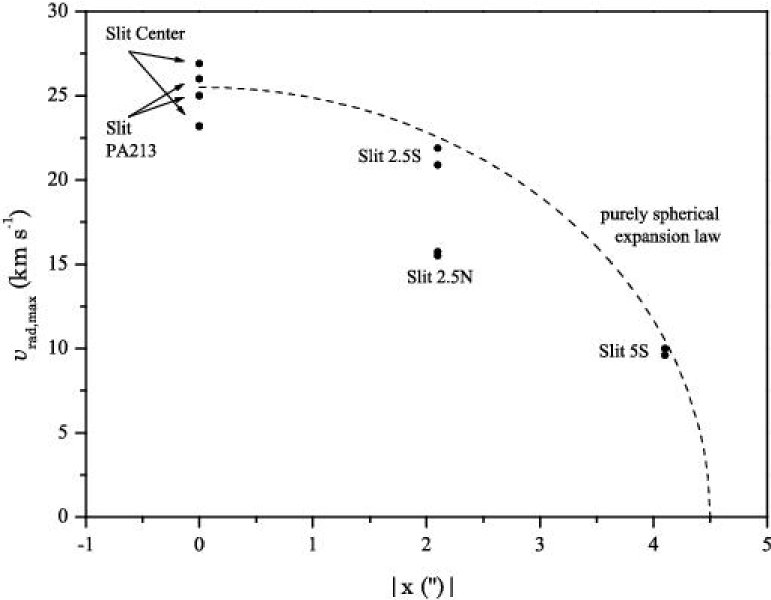
For a spherical shell of radius a spherically symmetric expansion with velocity would lead to an observed radial velocity relative to the systemic velocity
| (1) |
at a location in a Cartesian coordinate system centered on the star. In the present case, we would assume and km s-1from our data. If we orient the coordinate system such that the -axis is along the slit direction with being the star’s projected position onto the slit and being the offset of the slit with respect to the star, we get for the maximum radial velocities . In Fig. 5 we give a comparison between the absolute value of the radial velocities (corrected for the systemic velocity) at the star’s position projected onto the slit, and the model values. If it were a purely spherical expansion, the measured values should fall onto the dashed model curve). We find a clear deviation from a purely spherical expansion, for instance in the north-south asymmetry in Slits 2.5N and 2.5S.
Both the red-shifted and the blue-shifted components of the expansion ellipse have a FWHM of Å ( km s-1), compared to an instrumental FWHM of 8 km s-1. The echellograms in Fig. 3 and 4, in particularly the small inserts of the expansion ellipse reveal a clumpy sub-structure. Most prominent in Slit Center, the blue-shifted wing of the ellipse shows brightness variations (at a roughly constant FWHM). These variations are most likely due to the brighter knots identified in the HST image, which were intercepted by the slits. However, due to the large difference in resolution between our spectra and the HST image, no clear identification of the individual knots is possible.
4.2 The outflow
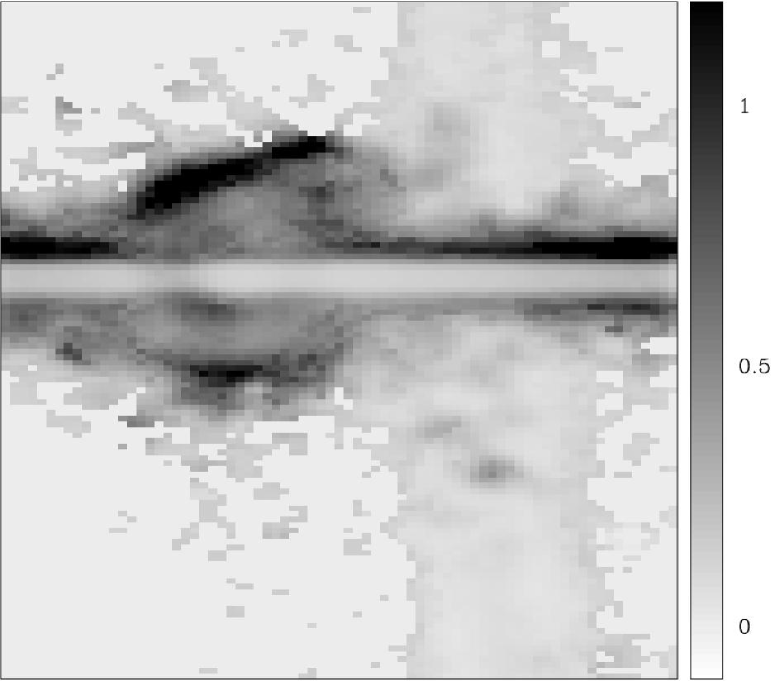
In addition to the spherical expansion we find in all spectra clear indications for a much higher velocity expansion structure (for an example, see Fig. 6). It extends spatially from to and in velocity space from the end of the expansion ellipse to more than km s-1 redshifted. Only in Slit 2.5N this emission feature appears to be detached from the expansion ellipse, and merges with the background Hα emission. To ensure that this high velocity component is part of the S 119 nebula and not a structure in the background emission, we determined its [N ii]6583Å/Hα ratio. If the feature contains CNO processed material we expect a significantly larger value for an LBV nebula than for an uncontaminated H ii region. Nebulae around LBVs do have a higher content of nitrogen due to CNO processed material that is mixed into outer regions of the star, which will be ejected and forms the nebula. The higher nitrogen abundance of the nebula can be traced by the [N ii]6583Å/Hα ratio. Typical examples of this ratio for LBVNs are for HR Car (Hutsemékers & van Drom 1991; Weis et al. 1997), for AG Car (Thackeray 1977; Smith et al. 1997), or even as high as in Car (Davidson et al. 1982; Meaburn et al. 1987; 1996; Weis et al. 1999). For the spherical nebula around S 119 we derive a ratio of , for the high velocity component we still find (Fig. 7). Both ratios are well within the range found in LBVNs, and are significantly larger than the ratio of the H ii region in the background of which we observe [N ii]6583 Å/H. While not far from the limit of our spatial resolution, the combination of spatial and velocity resolution makes it unlikely that our [N ii]6583Å/Hα determination is contaminated. The [N ii]6583Å/Hα values derived for the nebula agree well with earlier measurements of Nota et al. (1994).
The largest velocity of the high-velocity feature was detected in the Slit Center position with 283.1 km s-1, almost 130 km s-1 faster than the center of expansion of the central nebula. The velocity of this component increases approximately linearly with distance from the star’s projected position. The echellograms do not show any traces of this feature within the Doppler ellipse of the spherical nebula. All these properties strongly point towards this feature being a component of the nebula around S 119 and not a projection effect.
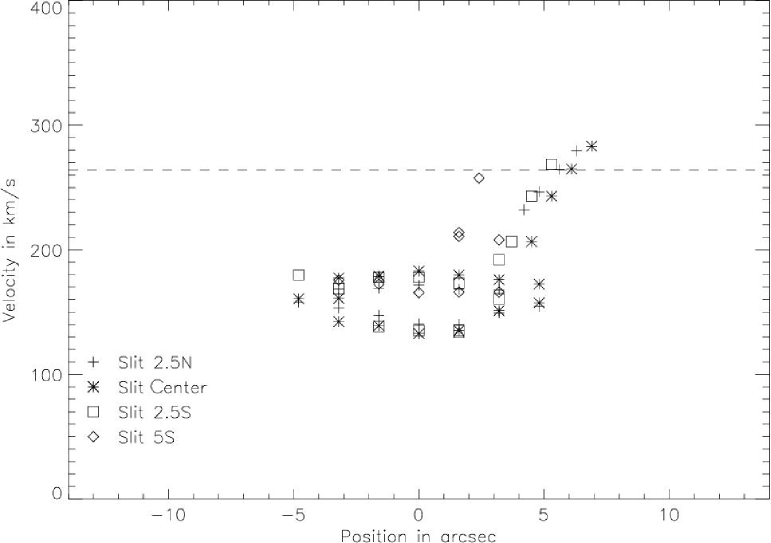
In Fig. 8 we combine the plots of all -diagrams available to us. A dashed line marks the radial velocity background H ii region. Both, the spherical expansion of the nebula’s main body as well as the high-velocity component are clearly visible. Due to its larger overall offset from the star, in Slit 5S (diamond shape symbols) the outflow seems to set on at a smaller projected offset from the star ( as compared to for the other slits). This is caused by the effect that the slit intercepts the outflow region earlier.
In Slit 2.5S (square shape symbols) at a projected position of another feature appears which moves slightly faster by . This feature most likely can be assigned to a part of the filament SE-1 identified in section 3.
4.3 X-ray emission ?
A 21 ks integration with the ROSAT HRI shows no X-ray emission of the nebula. At a distance of 50 kpc and for a Raymond-Smith plasma this corresponds to an upper flux limit of , almost independent of assumed temperatures between 0.1 and 1 keV (see Technical Appendix to the ROSAT Call For Proposals, ROSAT Appendix F). Thus we can only demonstrate that this limit is consistent with the conditions in the S 119 nebula:
-
•
For an energy conserving bubble, for instance, we find an expected X-ray flux of (Weaver et al. 1977, Chu et al. 1995; with a mechanical wind luminosity of 8.1 1040 erg s-1, an electron density of 700 cm-3, an electron temperature of 7 000 K, and an expansion age of 2 104 yr).
-
•
Moreover, even for the highest outflow velocities ( km s-1, may lead to post-shock temperatures at a possible interface with the ambient medium of and thus give rise to UV radiation rather than X rays detectable by ROSAT.
5 Summary and Conclusions
We have analyzed the morphological and kinematic structure of the nebula around the LBV candidate S 119.
We find that S 119 is surrounded by a nebula that represents a spherically expanding shell. On the western rim of this shell, a massive outflow occurs with a much higher velocity than the expanding shell. If one assumes a scenario, in which LBV nebulae are due to wind-wind interactions, the LBVN should be filled with hotter gas, since LBVs—unless in outburst—are hot stars with fast stellar winds. S 119 is a hot star, classified as Ofpe/WN9. The lack of detectable X-rays can therefore be explained by either (a) a relatively old outflow in which the originally hot gas had already sufficient time to cool, or (b) an LBV nebula which was not filled with hot gas in the first place, or (c) a velocity of the outflow which is too small to cause shocks with a sufficiently high post-shock temperature, or—of course—a combination of two of these reasons.
HST images are characterized by the spherical overall appearance of this nebula. The edge of the spherical component is much better defined in the northern and eastern directions where we also find the largest surface brightness. It does not exhibit a smooth distribution of surface brightness, but rather is very patchy and shows many filaments and knots, some of which extend—in particular in the western directions—beyond the nebula’s main body and occasionally are detached from the main body. This is the reason for the less well defined edge of the nebula in this direction.
High-resolution long-slit echelle spectra show that the spherical component of the nebula is expanding with about 25 km s-1 and that the center of expansion is at a radial velocity of 156 km s-1. This is remarkable as it is considerably lower than that of the LMC to which—due to its projected position on the sky—the star seems to belong. Both numbers are in good agreement with earlier results (e.g., Nota et al. 1994).
In all spectra a high velocity component is present in addition to the spherical expansion. It corresponds to a relative radial motion of up to km s-1 faster than the spherical main body of the nebula. This high velocity material is concentrated on the western side of the nebula. It is worth noting that on this side the nebula also seems to be somewhat frayed even between the filaments NW-2 and S-1 (see Sect. 3). As yet this makes S 119 the only LBV (candidate) nebula with such an outflow. The radial velocities in the outflow increase linearly with distance from the nebula. This Hubble-type velocity law reminds one of the strings found in and around the Homunculus nebula of Car (Weis et al. 1999). However, due to the rather different morphological structure, projection effects (which were ruled out in the Car strings) may play a role in the radial velocity structure in the S 119 outflow. One may, for instance, think of a conical structure with an opening angle that increases outwards. Due to our current lack of understanding of the physical nature of such Hubble type velocity laws, it is not possible to draw firm conclusions on the relation between the two phenomena. The largest radial velocity, relative to the star, amounts to km s-1 at a projected distance of from the star, corresponding to pc. One may deduce a minimum dynamical age of yrs. The dynamical age of the shell assuming a radius of 45 and an expansion velocity of 25.5 km s-1amounts than to yrs. One has to be aware, however, that it depends strongly on the formation mechanism of the outflow how meaningful a dynamical age is. In addition it was shown that the radial velocity of the system seems to deviate from that of the LMC so that the distance to S 119 has to be questioned. This distance on the other hand severely affects the determination of the dynamical age. If S 119 were only 30 000 pc away the dynamical age of the nebula would already go down to yrs. That would than be comparable to the lifetime of the star as an LBV. The dynamical age and the stars position in the HRD, that is being a hot star makes it quite likely that S 119 is already on its way to leave the LBV phase as does He 3-519 (Davidson et al. 1993).
The brightness difference between the west side and the east side (Nota et al. 1994, see also Sect. 3) can most likely be accounted for by the outflow. However, one can only speculate whether the outflow is due to a density gradient in the ambient medium or whether it is caused by asymmetric flows in the S 119 system. Given the sphericity of the nebula’s main component we are inclined to hold environment effects responsible for the outflow. This is also consistent with the brightest part of the nebula occurring in the same direction in which the HST image shows ionized diffuse gas which may easily indicate a higher density in that direction.
Acknowledgements.
We have made use of the ROSAT Data Archive of the Max-Planck-Institut für extraterrestrische Physik (MPE) at Garching, Germany. Part of the work was carried out on a workstation provided by the Alfried Krupp von Bohlen und Halbach-Stiftung to the ITA. This support is gratefully acknowledged.References
- (1) Bohannan, B.,Walborn, N.R. 1989, PASP, 101, 520
- (2) Chu, Y.-H., Chang, H.-W., Su, Y.-L., MacLow, M.M.,1995, ApJ, 450, 157
- (3) Crowther, P.A., & Smith, L.J. 1997, A&A, 320, 500
- (4) Davidson, K., Walborn, N.R., Gull, T.R. 1982, ApJ, 254, L51
- (5) Davidson, K., Humphreys R.M., Hajian A., Terzian Y., 1993, ApJ 411, 336
- (6) Humphreys, R.M., & Davidson, K. 1979, ApJ, 232, 409
- (7) Humphreys, R.M., & Davidson, K. 1994, PASP, 106, 1025
- (8) Hutsemékers, D., & Van Drom, E. 1991, A&A, 248, 141
- (9) Langer, N., Hamann, W.-R., Lennon, M., Najarro, F., Pauldrach, A.W.A., Puls, J. 1994, A&A, 290, 819
- (10) Meaburn, J., Wolstencroft, R.D., Walsh, J.R. 1987, A&A, 181, 333
- (11) Meaburn, J., Boumis, P., Walsh, J.R., et al. 1996, MNRAS, 282, 1313
- (12) Nota, A., Drissen, L., Clampin, M., Leitherer, C., Pasquali, A., Robert, C., Paresce, F., Robberto, M. 1994, in: Circumstellar Media in the Late Stages of Stellar Evolution, eds. R.E.S. Clegg, I.R. Stevens, W.P.S. Meikle, Cambridge University Press, Cambridge, UK, 89
- (13) Nota, A., Livio, M., Clampin, M., Schulte-Ladbeck, R. 1995, ApJ, 448, 788
- (14) Nota, A., Pasquali, A.,Drissen, L., Leitherer, C., Robert, C., Moffat, A.F.J., Schmutz, W. 1996, ApJS, 102, 383
- (15) Pasquali, A., Langer, N., Schmutz, W., Leitherer, C., Nota, A., Hubeny, I., Moffat, A.F.J. 1996, ApJ, 478, 340
- (16) Rohlfs, K., Kreitschmann, J., Siegman, B.C., Feitzinger, J.V. 1984, A&A, 137, 343
- (17) Schaller, G., Schaerer, D., Meynet, G., Maeder, A. 1992, A&AS, 96, 269
- (18) Smith, L.J., Stroud, M.P., Esteban, C., Vílchez, J.M. 1997, MNRAS, 290, 265
- (19) Smith, L.J., Nota, A., Pasquali, A., Leitherer, C., Clampin, M., Crowther, P.A. 1998, ApJ, 503, 278
- (20) Stahl, O., & Wolf, B. 1986, A&A, 154, 243
- (21) Stahl, O., Wolf, B., Klare, G., Cassatella, A., Krautter, J., Persi, P., Ferrari-Toniolo, M. 1983, A&A, 127, 49
- (22) Thackeray, A.D., 1977, MNRAS, 180, 95
- (23) Weaver, R., McCray, R., Castor, J., Shapiro, P., Moore, R. 1977, ApJ, 218, 377
- (24) Weis, K., Duschl, W.J., Bomans, D.J., Chu, Y.-H., Joner, M.D. 1997, A&A 320, 568
- (25) Weis, K., Duschl, W.J., Chu, Y.-H., 1999, A&A, 349, 467
- (26) Wolf, B., Stahl, O., Smolinski, J., Casatella, A., 1988, A&AS, 74, 239