XMM-Newton Observations of PSR B1823–13: An Asymmetric Synchrotron Nebula Around a Vela-like Pulsar
Abstract
We present a deep observation with the X-ray Multi-Mirror Mission of PSR B1823–13, a young pulsar with similar properties to the Vela pulsar. We detect two components to the X-ray emission associated with PSR B1823–13: an elongated core of extent immediately surrounding the pulsar, embedded in a fainter, diffuse component of emission in extent, seen only on the southern side of the pulsar. The pulsar itself is not detected, either as a point source or through its pulsations. Both components of the X-ray emission are well fit by a power law spectrum, with photon index and X-ray luminosity (0.5–10 keV) erg s-1 for the core, and and erg s-1 for the diffuse emission, for a distance of 4 kpc. We interpret both components of emission as corresponding to a pulsar wind nebula, which we designate G18.0–0.7. We argue that the core region represents the wind termination shock of this nebula, while the diffuse component indicates the shocked downstream wind. We propose that the asymmetric morphology of the diffuse emission with respect to the pulsar is the result of a reverse shock from an associated supernova remnant, which has compressed and distorted the pulsar-powered nebula. Such an interaction might be typical for pulsars at this stage in their evolution. The associated supernova remnant is not detected directly, most likely being too faint to be seen in existing X-ray and radio observations.
Subject headings:
ISM: individual (G18.0–0.7) — pulsars: individual (B1823–13) — stars: neutron — supernova remnants — X-rays: ISM1. Introduction
Many of the energetic processes which take place in the aftermath of a supernova explosion are significant sources of X-ray emission. The supernova remnant (SNR) which results as the expanding debris collide with the interstellar medium (ISM) can generate both thermal X-rays from shock-heated gas and ejecta, as well as non-thermal X-ray synchrotron emission from the shock-acceleration of electrons. Meanwhile, the core collapse which triggers such explosions often forms a rapidly rotating central pulsar. Pulsars also produce X-rays, in the form of pulsed non-thermal emission from the pulsar magnetosphere, quasi-blackbody emission from the neutron star surface, or an extended pulsar wind nebula (PWN) powered by a relativistic particle outflow from the central source.
Each of these processes dominates at different stages in the system’s evolution. For example, the youngest systems are generally well-suited for studying SNR blast waves and magnetospheric emission from pulsars, while in middle-aged systems one can better study the neutron star surface. Potentially the most challenging group of objects to understand are the “Vela-like” pulsars (Becker & Trümper (1997)), which are at an evolutionary stage for which all the above processes may be taking place. Such pulsars, typified by the Vela pulsar, have spin periods ms, spin-down luminosities erg s-1 and characteristic ages kyr (where is the pulsar’s spin-period derivative and is the star’s moment of inertia). Until recently, about 10 Vela-like pulsars were known; the highly successful Parkes Multibeam Pulsar Survey has approximately doubled this number (Manchester et al. (2002)).
The Vela pulsar itself is sufficiently nearby ( pc) that its different emission processes can be clearly distinguished: X-rays from the neutron star surface, the pulsar magnetosphere, the surrounding PWN and the associated SNR have all now been identified (Strickman, Harding, & de Jager (1999); Lu & Aschenbach (2000); Helfand, Gotthelf, & Halpern (2001); Pavlov et al. (2001)). However, the rest of the known Vela-like pulsars are at much greater distances, resulting in fainter, smaller and more heavily absorbed X-ray sources. It has thus been difficult to detect and interpret the emission from these objects.
Radio observations of the pulsar B1823–13 have measured a spin-period ms and a period derivative s s-1, implying a spin-down luminosity erg s-1 and a characteristic age kyr (Clifton et al. (1992)), all properties typical of a Vela-like pulsar. The distance to PSR B1823–13, as inferred from the dispersion of its radio pulses, is kpc (Cordes & Lazio (2002)). Previous X-ray studies of PSR B1823–13 have been carried out with both ROSAT and ASCA. The ROSAT data showed a complicated source at the pulsar’s position, with a morphology best modeled as a point source embedded in a compact nebula of radius 20′′ and surrounded by an elongated diffuse region 5′ across (Finley, Srinivasan, & Park (1996)). However, because of the low number of photons detected, it was not possible to determine whether the extended component of the source was a SNR or PWN, while the nature of emission from the pulsar itself also remained unclear. ASCA data also indicated the presence of one or more compact components embedded in a more extended region of emission, but lacked the spatial resolution needed to properly separate and interpret these sources (Sakurai et al. (2001)).
As the first part of an effort to understand the X-ray emission from Vela-like pulsars, here we present observations of pulsar B1823–13 with the X-ray Multi-Mirror Mission (XMM-Newton), the first observatory to provide sufficient angular, spectral and temporal resolution to separately identify all the processes described above. XMM-Newton also has much higher sensitivity (effective area 4650 cm2 at 1.5 keV) than previous missions, making it well-suited for studying faint sources such as seen here.
2. Observations and Analysis
Observations of PSR B1823–13 were carried out with XMM-Newton on 2001 October 16 and 2001 October 18, in two observations each of length 30 ks, as summarized in Table 1. The data described here correspond to the three X-ray imaging instruments on board XMM-Newton. The EPIC MOS1 and MOS2 detectors were operated in the standard “full frame” mode, in which seven CCDs in each detector are used to produce an approximately circular field-of-view of diameter , with a time resolution for each CCD frame of 2.6 s. The EPIC pn detector was operated in “small window” mode, in which only a central square region is active, but for which the time resolution is 5.7 ms. In this mode a significant fraction of each 5.7-ms frame is used to read out the CCD, resulting in a dead-time fraction of 30% (Kuster et al. (1999)). To avoid optical contamination of the field, the medium and thin blocking filters were used for the MOS and pn detectors, respectively.
Initial processing of the data was carried out at the XMM-Newton Science Operations Centre (SOC). We analyzed the resulting event files using the XMM-Newton Software Analysis System (SAS), version 5.3.0. The data were first filtered to remove hot pixels and other bad data, and to only allow standard event grades (patterns 0 to 12 for MOS1 and MOS2, patterns 0 to 4 for pn). Each of these data sets was examined for periods of high background by only considering events with energies in the range 10–15 keV. Times at which flares or high levels were seen in the X-ray count rate for this bandpass were excluded. This latter filtering excluded a significant fraction of each observation; the resulting useful exposure times are listed in Table 1.
2.1. Imaging
For each observation and detector listed in Table 1, the data set was corrected was for vignetting losses using the SAS task EVIGWEIGHT. Next, an energy filter was applied to include only events falling in the energy range 0.5–10 keV, other energies being dominated by background. Finally, all the MOS and pn data were combined to form a single image for each type of detector. For the MOS CCDs, the flat-fielded images have a plate scale of pixel-1; for the pn CCD, the flat-fielded image has a plate scale of pixel-1.
2.2. Spectroscopy
The high background count-rate for XMM-Newton requires careful analysis in order to extract accurate source spectra. The background contribution to the data consists of two main components (see Lumb et al. (2002)): a diffuse X-ray background, assumed to have a smooth spatial distribution over the observed field, and a particle background, which shows spatial variations across the detector.
For a source not much larger than the point spread function (PSF), we determine the spectrum by extracting data from both a small region enclosing the source, and from a reference spectrum immediately adjacent. The spectrum of interest is then obtained by subtracting the reference spectrum from the source spectrum, scaling appropriately to account for the differing areas of the extraction regions for the two fields. This approach assumes that because of the proximity of the two extraction regions, the differences in the background components are negligible between source and reference spectra.
Analysis of extended sources is complicated by the spatially varying nature of the background. Both the diffuse X-ray background and the source photons are vignetted by the XMM-Newton mirrors, resulting in a background component that varies dramatically with detector position. The particle background, however, is unaffected by the mirrors, resulting in a background component that is largely independent of detector position. Given these complications, we follow the prescription given in Appendix A of Arnaud et al. (2002), in which reference spectra from adjacent regions are used to correct for the X-ray background, and spectra from blank-field observations supplied by the SOC111http://xmm.vilspa.esa.es/ccf/epic/#background are used to account for the particle background.
Once these corrections had been applied, spectra were re-grouped so that there were at least 50 counts per spectral bin for compact sources, and 100 counts per bin for extended sources. For analysis of EPIC MOS data, we used the responses supplied by the SOC222http://xmm.vilspa.esa.es/ccf/epic/#responses to provide information on the redistribution matrix and effective area of each CCD: specifically, for the MOS1 CCD we used the response file m1_medv9q19t5r5_all_15.rsp, while for MOS2 we used m2_medv9q19t5r5_all_15.rsp. For analysis of EPIC pn data, we generated our own response files using the SAS tasks RMFGEN and ARFGEN. Subsequent spectral fitting and analysis were carried out using XSPEC version 11.1.0.
2.3. Timing
In the “small window” mode used here, the EPIC pn CCD has sufficient time resolution to search for X-ray pulsations from PSR B1823–13. Due to improvements in the time-tagging of events since the time when pipeline processing was carried out on the data by the SOC, we completely reprocessed the pn data from the raw observation data files, using the SAS task EPCHAIN. After filtering the data as described in §2 above, we then corrected the arrival times of each event to correspond to a reference frame at the solar system barycenter. For a given extraction region and energy range, a pulsation analysis could then be carried out on the resulting arrival times.
3. Results
3.1. Imaging
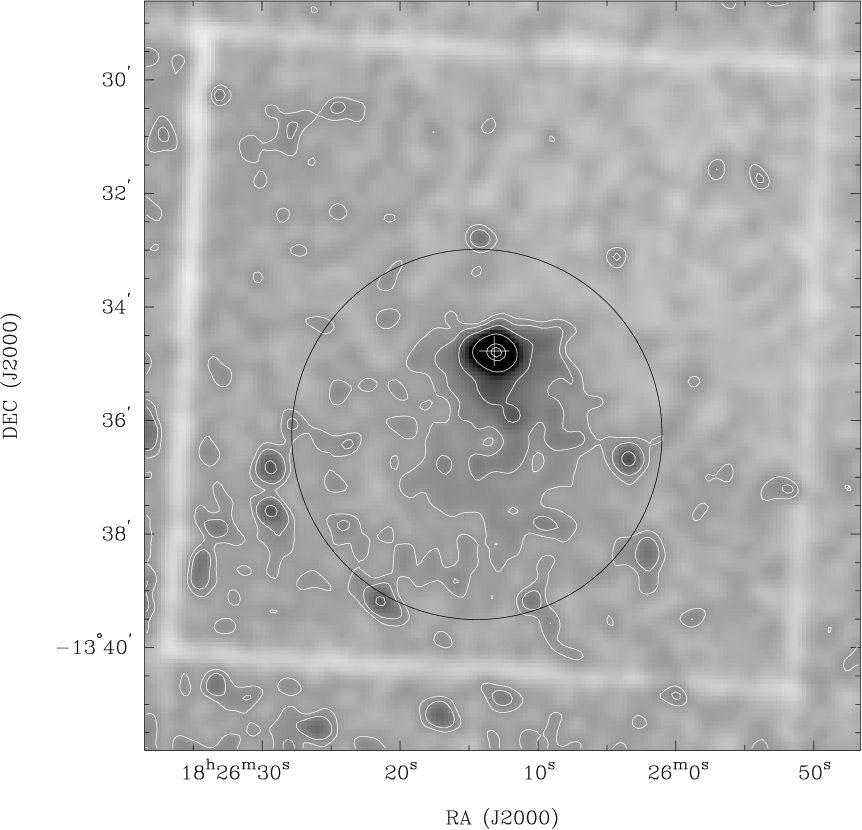
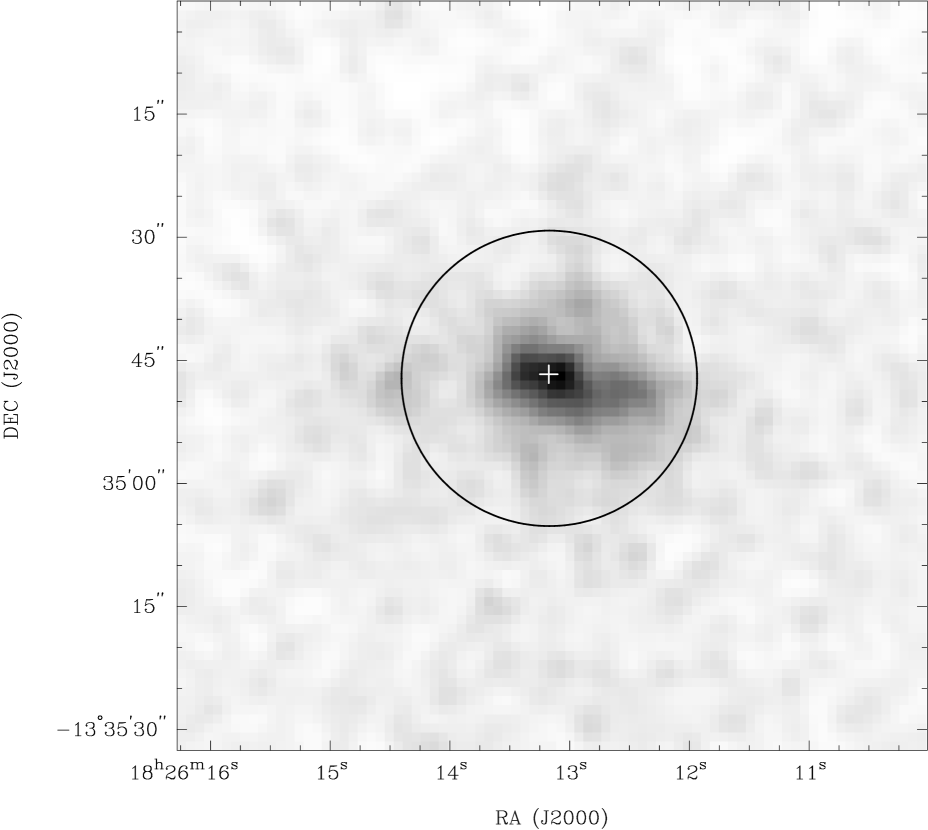
The EPIC MOS image of PSR B1823–13 is shown in Figures 1 and 2. Because a significant contribution to the background emission is from high-energy particles, the vignetting correction which has been applied to the data gives the false impression that the background emission is stronger around the edges of the fields. The O star HD 169727 (outside the extent of the region shown in Figure 1) is detected as a prominent X-ray source; comparison of its position in our data with that in the Tycho Reference Catalogue (Høg et al. (1998)) suggests that the absolute astrometry of our observation is correct to within in each coordinate.
The data clearly demonstrate that the X-ray emission associated with PSR B1823–13 consists of at least two components. The brightest X-ray emission is seen immediately surrounding the position of the pulsar, in a compact region shown in Figure 2 which we subsequently refer to as the “core”. However, the morphology of the core suggests that it is not an unresolved source, but rather is elongated along an extent of in the east-west direction. This extension can be seen independently but at lower resolution in the EPIC pn image (not shown here). We quantify this in Figure 3, where we show the intensity profile of X-ray emission around the pulsar along both east-west and north-south axes. We compare these profiles to the XMM-Newton PSF for MOS1 at 1.5 keV, which we generated using the King profile parameters included in the XMM-Newton calibration file XRT1_XPSF_0005.CCF.333See http://xmm.vilspa.esa.es/docs/documents/CAL-SRN-0100-0-0.ps.gz for more information. Above levels of of the peak flux in the image, the intensity profile in the north-south direction (i.e. the lower panel of Fig 3) appears to be largely consistent with this PSF. However, the profile shown in the upper panel of Figure 3 clearly demonstrates that along its east-west axis, the core region is significantly broader than the PSF, only falling to the apparent background level at offsets of on the eastern and western sides of the pulsar. Also present is a secondary clump of emission east of the pulsar, seen at coordinates (J2000) RA , Dec. in Figure 2, and and visible as a flux enhancement at an offset of in the upper panel of Figure 3.
At larger angular scales, Figure 1 demonstrates the existence of a faint, amorphous component of emission extending to much larger distances from the pulsar than does the central core; we subsequently refer to this region as the “diffuse” component. This diffuse emission is located predominantly to the south of the core region. The morphology of the diffuse component is approximately elliptical, centered south of the pulsar, with a major axis of aligned north-south, and a minor axis of . In all directions, the diffuse component decreases in brightness with increasing distance from the pulsar. To the south, east and west of the pulsar, the diffuse component fades into the background over several arcmin; to the north of the pulsar the brightness profile decreases much more rapidly. We demonstrate this in Figure 4, where we show the brightness profile of the X-ray emission along the north-south axis of the source. As a comparison, we have extracted the same profile from the blank-field observations supplied by the SOC, and have normalized the profile for the blank-field data to that of the source by comparing count rates in an identical source-free region. As shown in Figure 4, a comparison of profiles between the source field and the blank field clearly shows that X-ray emission from the source extends at least to the south of PSR B1823–13, but extends no more than to the north of the pulsar. Note that the ranges of offset shown in Figure 4 correspond to the extent of the central CCD of the detector. At larger offsets the background dominates, and in these regions the differences between the background levels in the source field and in the blank field make it impossible to determine whether there is any significant signal above the noise. For this reason we cannot place useful constraints on the presence of a faint limb-brightened shell of emission at larger radii, as might be produced by an associated SNR (see further discussion in §4.3 below).
3.2. Spectroscopy
We have extracted spectra for the core from both the MOS and pn data, using a circular extraction region, centered on the pulsar and with a radius of (as shown in Figure 2). Although only 75% of the energy from an unresolved or slightly extended source is encircled at this radius, this extraction region minimizes contamination from the surrounding diffuse component. The core region is sufficiently compact that we can correct for background using the simple process of subtracting a reference region from an adjacent source-free region. In this case, the reference region was located distant from the core, and was placed so as to avoid any contribution from the diffuse component of the emission.
Six spectra resulted, one for each of MOS1, MOS2 and pn, for each of the two observations listed in Table 1. We then fitted each of power-law and blackbody models to these six spectra simultaneously, modified by photoelectric absorption — the best-fit results are summarized in Table 3. We find that the core region is well fit by a power law, with an absorbing column of cm-2 and a photon index . At a distance to the system of kpc, the unabsorbed 0.5–10 keV luminosity implied by this fit is erg s-1, where we have corrected for the of the flux from this source which presumably falls outside our extraction region. A blackbody model gives a much poorer fit to the spectrum.
The diffuse component occupies a much larger area on the detectors than does the core region, and indeed fills the entire field-of-view of the EPIC pn image. Because there is no source-free region on the detector, it is impossible to accurately account for the background of the diffuse emission for the EPIC pn. Instead, we only considered MOS data in this analysis. We extracted a spectrum from a circular region centered on (J2000) RA , Dec. , with radius , as shown in Figure 1. We excluded from this region a -radius region centered on the pulsar, and -radius regions around the point sources seen at (J2000) RA , Dec. and RA , Dec. . As a reference spectrum, we considered all emission outside the main extraction region, but falling within a square of side centered on the pulsar. Both source and reference spectra were corrected for the particle background by subtraction of blank field data, as explained in §2.2. All four MOS spectra were then fit simultaneously to a variety of absorbed models (see Table 3 for details): a power law, thermal bremsstrahlung, a synchrotron spectrum with an exponential cut-off (model “SRCUT”), and three thermal plasma models (“RAYMOND”, “MEKAL” and “NEI”). In all six cases, we find a good match to the data with an absorbing column of cm-2. For the power law fit shown in Figure 5, the photon index is , while the thermal models all imply temperatures keV. The cut-off synchrotron spectrum can be extrapolated to radio wavelengths, where the corresponding 1 GHz flux density implied for the source is mJy.4441 mJy W m-2 Hz-1.
3.3. Limits on a Point Source
While it is clear that the core component of X-ray emission surrounding PSR B1823–13 is extended, an important consideration is how much of the X-ray emission detected could be from an unresolved source potentially corresponding to the pulsar itself. We here consider the upper limits we can place on the temporal, morphological and spectral contributions of a central point source.
3.3.1 Timing Analysis
In principle, PSR B1823–13 may be directly detectable in these data through its pulsations. Because any emission from the pulsar is embedded in the surrounding extended component, pulsations will inevitably be contaminated by this extended emission, and the signal-to-noise ratio of the pulses will thus depend on the extraction radius and energy range in which data are considered. We therefore searched for pulsations by considering events in five possible circular extraction regions, of radii , , , and , each centered on the pulsar position. For each extraction radius, we considered photons in the energy ranges 0.5–2, 2–5, 5–10 and 0.5–10 keV. We then determined the phase of each photon by folding the data at the ephemeris listed in Table 2, which was kindly supplied to us by M. Kramer from pulsar timing observations at the Jodrell Bank Observatory. Because our two observations were only separated by two days, we combined data from both runs when searching for pulsations.
With the phases corresponding to the known pulsar period in hand, we applied to the data the test (Buccheri et al. (1983)), a binning-independent method of looking for the th harmonic of a pulsating signal in sparsely-sampled data. In the absence of pulsations, the quantity will be distributed like with degrees of freedom. For each of the extraction radii and energy ranges listed above, we have calculated for our observations for harmonics in the range . Amongst these data, the most significant statistic is , which occurs for an extraction radius of and an energy range 0.5–10 keV. The probability of such a signal emerging by chance is 4.9%, which is consistent with chance occurrence given the number of different extraction radii and energy ranges searched. We therefore conclude that there is no significant pulsed signal in the data.
We can estimate an upper limit on the amplitude of any pulsations as follows. For a sinusoidal signal of pulsed fraction embedded in an event list containing photons, we expect (Leahy, Elsner, & Weisskopf (1983)). Since we do not know the optimal extraction radius in which pulses are most likely to dominate over surrounding extended emission, we conservatively consider a extraction radius. This corresponds to of the energy of a central point source555See http://heasarc.gsfc.nasa.gov/docs/xmm/uhb/XMM_UHB/node17.html ., but also most likely suffers from significant contamination from surrounding emission. The resulting values of can be used to determine upper limits on for the entire core region. For 0.5–2, 2–5, 5–10 and 0.5–10 keV, we determine upper limits on for a sinusoidal pulsed signal from PSR B1823–13 of 11%, 4%, 14% and 2% respectively. The upper limits on the pulsed fraction for an unresolved pulse are a factor of two lower in each case.
3.3.2 Imaging Analysis
The intensity profiles in Figure 3 show that while cuts through the pulsar along a north-south axis are consistent with a point source, those in an east-west direction demonstrate the presence of extended emission immediately surrounding the pulsar. However, unlike other cases in which an unresolved source is clearly superposed on a smooth nebula (e.g. Murray et al. (2002)), there is no obvious decomposition of the profile seen in the upper panel of Figure 3 into two such separate components. The profile shown could be interpreted as a centrally peaked nebula, with no central point source, but it could equally be regarded as an unresolved source embedded in lower level nebular emission. Thus we must adopt a conservative upper limit on a point source, in which we assume that all the flux in the central bin corresponds to unresolved emission. Integrating under the appropriately normalized PSF, we find that in the energy range 0.5–10 keV, counts in the combined MOS1MOS2 data set could be from an unresolved source at the pulsar position. (Note that only of these counts would fall within the extraction radius shown in Figure 2, owing to the large wings of the XMM-Newton PSF.) The corresponding upper limit on the EPIC MOS count-rate from the pulsar is 0.0123 cts s-1.
3.3.3 Spectral Analysis
The spectrum of the core region is well fit by a power law. If the emission from the pulsar has a blackbody spectrum, then it should be spectrally distinct from the rest of the core. Thus, we can constrain the temperature of a central source by determining what contribution a thermal source could make to the core’s spectrum (Slane, Helfand, & Murray (2002)). Specifically, we adopt a hard upper limit on the foreground column density of cm-2, above all values of listed in Table 3. We assume that the neutron star’s radius as viewed by a distant observer is km, and that the distance to the source is 4 kpc. We can then fit a two component spectral model to the core’s spectrum (as measured by the combination of MOS1, MOS2 and pn), in which we allow the photon index and flux of the power-law component to be free parameters, and find the maximum temperature of the blackbody component which still yields an acceptable fit to the spectrum. This results in an upper limit on the surface temperature of the blackbody (as viewed at infinity) eV, and an unabsorbed bolometric luminosity erg s-1. We note that a blackbody model will overestimate a neutron star’s temperature when compared to more realistic atmosphere models (Pavlov & Zavlin (2000)), strengthening the upper limits made from blackbody fits here.
4. Discussion
4.1. Comparison with Earlier Results
ROSAT observations of this source suggested the presence of three components of emission: an unresolved source centered on the pulsar, embedded in a compact region of radius , and further surrounded by a diffuse nebula of extent (Finley, Srinivasan, & Park (1996)). From the ROSAT data, there was the suggestion that this latter diffuse component had a cometary morphology, with a fan-like tail extending out behind the pulsar at a position angle (north through east). In the data presented here, we confirm the presence of both a compact region surrounding the pulsar, and of a diffuse nebula at larger extents. However, our results differ from those of Finley et al. (1996) in two important respects.
First, based on the analyses in §3.3 above, we can only put upper limits on the contribution of a central unresolved source. Given the many more counts detected here, we ascribe the apparent detection of such a source by ROSAT to statistical fluctuations in the presence of low signal-to-noise. We can estimate the expected contribution from the pulsar as follows. The X-ray spectrum of the Vela pulsar can be modeled as a blackbody with km, eV and erg s-1, combined with a power law component of photon index and an unabsorbed 0.2–8 keV luminosity erg s-1 (Pavlov et al. (2001)). The pulsed fraction in the 0.1–10 keV band is 7% (Helfand, Gotthelf, & Halpern (2001)). At a distance of 4 kpc, and adopting cm-2 as representative of the minimum of the range of possible absorbing columns derived in Table 3, we would expect to detect EPIC pn counts in our observation from such a source. When embedded in the surrounding core region, the effective pulsed fraction would be , well below the limits determined in §3.3.1. The resulting MOS count-rate for such a source would be cts s-1, also well below the upper limit on the point-source count-rate determined in §3.3.2. Finally, the expected temperature and luminosity of the blackbody component are both much less than the spectral limits on such a source determined in §3.3.3. Thus the failure to detect PSR B1823–13 in our data is entirely consistent with the emission properties expected of a Vela-like pulsar. Higher resolution observations with Chandra will be needed to separate out any unresolved source from the surrounding extended component, and to thus directly detect the pulsar.
Second, while we confirm the presence of diffuse emission surrounding the core region, we find no evidence for the cometary morphology proposed by Finley et al. (1996). Rather, it seems likely this appearance resulted from the much lower sensitivity of their data ( total source counts for ROSAT PSPC compared to for XMM-Newton EPIC MOS), and simply corresponded to the brightest regions of the larger source seen here.
Our measurements also differ somewhat from the ASCA results presented by Sakurai et al. (2001). While Sakurai et al. (2001) concluded that the X-ray emission consists of a core region embedded in a more diffuse nebula, the diffuse component in their data seems symmetrically distributed around the pulsar, as opposed to the distinctly one-sided morphology seen here. Sakurai et al. (2001) find that the core and diffuse components can both be fit with power-law spectra, with photon indices of and respectively. While these spectra are broadly consistent with our measurements, the unabsorbed flux densities (2–10 keV) for the core and diffuse regions inferred from ASCA are erg cm-2 s-1 and erg cm-2 s-1 respectively, an order of magnitude higher than those inferred here. Since Sakurai et al. (2001) provide no information on their analysis procedure, fitted absorbing column or assumed distance, it is difficult to assess whether there is a genuine discrepancy between our results and theirs. Pending a more detailed analysis of the ASCA data, we ascribe these differences to the much poorer angular resolution and sensitivity of ASCA when compared to XMM-Newton.
4.2. Morphology of the X-ray Emission
Spectral fits to the the diffuse component of the X-ray emission cannot distinguish between thermal and non-thermal models. In the case of a thermal spectrum, this emission could be interpreted as shock-heated gas from a SNR associated with the pulsar. However, the temperatures inferred by the corresponding fits listed in Table 3 are higher than seen even in very young ( yr) SNRs (e.g. Blanton & Helfand (1996); Gotthelf & Vasisht (1997)). Fits with enhanced abundances can lower the inferred temperature (e.g Pivovaroff et al. (2001)) — we have attempted to model the data in this way here, but the quality of the fit then becomes unacceptable. We thus conclude that the spectrum of the diffuse component is most likely non-thermal, and is best described by either the power-law or synchrotron cut-off spectral model.
The synchrotron cut-off spectrum (model “SRCUT” in Table 3) corresponds to synchrotron emission from shock-accelerated electrons in supernova remnants (Reynolds & Keohane (1999)). It is not unreasonable to suppose that a SNR associated with PSR B1823–13 is accelerating such electrons, and generating the diffuse component of the emission. Indeed, the photon index of a power law fit to the spectrum, , is similar to that seen from other SNRs emitting synchrotron X-rays when fit with such a model (Slane et al. 1999, 2001). Furthermore, the inferred 1 GHz flux density from the SRCUT fit, mJy, is well below the upper limit on 1.4-GHz radio emission from this source ( mJy, ) as determined by Braun et al. (1989) from their radio observations of this field. However, in this interpretation the morphology of the X-ray emission should take the form of an approximately circular limb-brightened region associated with the expanding SNR shock (e.g. Koyama et al. (1995)). The amorphous, centrally-brightened emission seen here does not meet this expectation.
We therefore interpret the diffuse component of the X-rays seen surrounding PSR B1823–13 as synchrotron emission produced by a pulsar wind nebula, which we designate G18.0–0.7 based on its Galactic coordinates. The fact that the diffuse component steadily fades with increasing distance from the pulsar supports the interpretation that PSR B1823–13 is the central energy source for this emission. The inferred photon index for the diffuse component, , is typical of PWNe (Becker & Trümper (1997); Possenti et al. (2002)). The unabsorbed 0.5–10 keV luminosity for this source is erg s-1; the corresponding efficiency with which the pulsar’s spin-down is converted into nebular X-rays is , a value also typical for young pulsars (Becker & Trümper (1997)).
Contained completely within the diffuse component, the core region is a compact region with a hard power-law spectrum centered on the pulsar. Bright central structures are seen around many other young pulsars which power PWNe (e.g. Helfand, Gotthelf, & Halpern (2001); Gaensler et al. 2002a ), and similarly we argue here that the core region is a central region of synchrotron emission powered by the pulsar. We thus interpret the core and diffuse regions of X-ray emission as both parts of a single PWN, of total unabsorbed luminosity (0.5–10 keV) erg s-1 and foreground column density cm-2. Spectral fits with the “SRCUT” model demonstrate that a continuous synchrotron spectrum for G18.0–0.7 extrapolated to radio frequencies results in a 1-GHz flux density well below the sensitivity of radio searches for a nebula of this size, accounting for the non-detection of any PWN surrounding PSR B1823–13 at radio wavelengths (Braun, Goss, & Lyne (1989); Gaensler et al. (2000)).
In such a source, we expect that the pulsar wind flows freely out to the point at which the wind pressure is balanced by that from the nebula. In this region the wind decelerates, a termination shock is formed, and synchrotron emission is generated. Recent high-resolution observations with the Chandra X-ray Observatory have provided beautiful images of termination shocks around young pulsars. In some cases these images demonstrate that the termination region is not a spherical shock, but rather has a toroidal morphology presumably corresponding to a wind focused into the pulsar’s equatorial plane (Gaensler et al. 2002a ; Lu et al. (2002)).
While we generally expect any X-ray PWN to be brightest near the pulsar, Figure 3 demonstrates that the core is a distinct, well-defined region superimposed on the much fainter diffuse background. We thus argue that the core component seen here represents the pulsar termination shock, its elongated morphology possibly indicative of anisotropic outflow from the pulsar. The radius of the termination shock is then pc, an extent similar to that seen around the Crab pulsar and PSR B1509–58 (Weisskopf et al. (2000); Gaensler et al. 2002a ), but about an order of magnitude larger than that inferred for the Vela pulsar (Helfand, Gotthelf, & Halpern (2001)). We expect particles emitting in this region to have undergone minimal synchrotron losses, and to thus have a harder spectrum than the rest of the nebula (e.g. Slane et al. (2000); Gaensler et al. 2002a ). We can directly compare the spectra of the core and diffuse components by fitting each to a power law with fixed . The results of such fits are given in Table 3 for cm-2 (corresponding to the best-fit absorbing column for the core) and cm-2 (corresponding to the best fit for the diffuse region). From these fits, we see that the core is indeed harder than the rest of the nebula at a statistically significant level, with a difference in photon index .
The X-ray luminosity of the core region is about 25% of that from the total nebula. This is somewhat higher than the contribution made by the central termination shock region in other such sources (Slane et al. (2000); Gaensler et al. 2002a ; Lu et al. (2002)), potentially indicating a difference in the efficiency or length scale over which electrons and positrons are accelerated in the shock seen here compared to other sources. However, we caution that a significant contribution to the flux in the core region could be from the pulsar itself (see §3.3.2 above).
If the core indeed represents the termination shock, the extent of this region then provides a constraint on the magnetic field in G18.0–0.7. Specifically, we expect pressure balance between the pulsar wind and the surrounding nebula,
| (1) |
where is the pressure in the PWN and is the fraction of a sphere through which the wind flows. The limited angular resolution of XMM-Newton makes it difficult to derive a specific geometry for outflow from the core morphology; we here leave as a free parameter with a hard upper limit . The corresponding nebular pressure needed to confine the pulsar wind is erg cm-3. At distances far downstream of the shock, we expect approximate equipartition between particles and magnetic fields (Kennel & Coroniti (1984)), so that , where is the mean nebular magnetic field. In this case we can infer G. For electron/positron pairs emitting at 1.5 keV (the peak of the X-ray flux seen in Figure 5), the corresponding synchrotron lifetime is yr.
The simplest expectation for a PWN is that, beyond the termination shock, the emitting particles should flow out radially in all directions until they either radiate all their energy or reach the outer edge of the PWN. However, G18.0–0.7 differs from this in two important respects. Most fundamentally, rather than forming an approximate ellipsoid with the pulsar and termination shock at its center (e.g. Slane et al. 2000, 2002), G18.0–0.7 is distinctly one-sided, showing little emission to the north of the pulsar but a broad diffuse region to the south. Also problematic is the fact the southern region of the PWN extends to a distance pc from the pulsar. If this extent represents the outer edge of the expanding nebula in this direction, then the expansion speed of the nebula is km s-1 (e.g. van der Swaluw et al. (2001)). Alternatively, if the true nebular extent is much larger than that seen in X-rays, then we expect a flow speed at the edge of the X-ray nebula km s-1 (Kennel & Coroniti (1984)). Both these calculations are at odds with the speed needed to transport particles to the southern end of the PWN within their synchrotron lifetimes, km s-1. Thus the size of the PWN is much larger than be easily accounted for if the nebula has expanded unimpeded on its southern side.
One possible explanation for the PWN’s properties is if if the pulsar’s space velocity is supersonic with respect to the sound speed of its environment. In this case the PWN is confined through ram pressure and a bow-shock PWN results (e.g. Gaensler, Jones, & Stappers (2002)). In such PWNe, the pulsar is at one end of an elongated X-ray nebula; the PWN has a bright head at or near the pulsar position, with a progressively fainter tail extending opposite the direction of motion (e.g. Kaspi et al. 2001a ). While there is no proper motion information for PSR B1823–13 from which we might estimate its space velocity, the gross morphology of G18.0–0.7 could be interpreted as a tail extending to one side of the pulsar, suggestive of rapid motion of the central source in a northerly direction. However, there are at least two difficulties with this interpretation.
First, in other bow-shock PWNe, the shocked pulsar wind interior to the bow shock is tightly confined by the flow of surrounding material, and the X-ray tail correspondingly consists of a very narrow column of emission, marginally resolved or unresolved even with Chandra (Bucciantini (2002); Stappers et al. (2003)). On the other hand, the diffuse emission seen here forms a very broad region behind the pulsar, showing no evidence for containment or collimation. Second, the length of the proposed tail region seen here, pc, is too long to be a trail of emission left behind by a fast pulsar. Even if the pulsar had an extreme space velocity km s-1, the lifetime computed above for X-ray emitting pairs limits the length of such a synchrotron “wake” to pc, noticeably smaller than the measured extent of G18.0–0.7. Alternatively, if the emitting particles have not been left behind by the pulsar, but are part of the wind flow driven by the pulsar, one is left with the uncomfortably high-flow speed discussed above, km s-1. Wang et al. (1993) argue that such high-speed backflows behind the pulsar can be attained when the wind is forced to travel through a narrow nozzle, but no such collimated region behind the pulsar is seen here.
A second possibility to explain the morphology and extent of this PWN is that the nebula is intrinsically symmetric around the pulsar, but that there is a relativistic bulk flow of particles within the nebula which results in Doppler boosting of the approaching component over receding material. Such a situation has been proposed to explain the one-sided PWN seen around PSR B1509–58 (Gaensler et al. 2002a ), in which a flow velocity has been inferred. However, in PWNe for which such high speed flows have been claimed, this outflow manifests itself in collimated jets of material directed along the pulsar spin-axis (Gaensler et al. 2002a ; Lu et al. (2002)) — the lack of any such collimated structures here argues against this possibility. The large extent of the PWN can be explained in this case, since the flow time from the pulsar to the edge of the nebula is only yrs (ignoring projection effects). However, at the relativistic speeds needed for Doppler boosting to be effective, we find that . We thus would expect minimal synchrotron cooling of the outer nebula (i.e. a photon index as is seen in the core), in contradiction with the steeper photon index () seen for the diffuse component of G18.0–0.7.
A final alternative is that the system is in an evolved state, in which the reverse shock from a surrounding SNR has propagated back inwards, colliding with the PWN (Reynolds & Chevalier (1984)). If different components of this reverse shock collide with the PWN at different times, emitting particles can be rapidly convected away from the pulsar, generating a nebula which can be significantly offset to one side of the pulsar (Chevalier (1998)). Such an effect has been specifically proposed to account for the one-sided morphology of the PWN powered by the Vela pulsar (Blondin, Chevalier, & Frierson (2001)), and we propose that this process may similarly be occurring here for the Vela-like pulsar B1823–13. Such an asymmetric PWN will result only if the PWN crushing time-scale is of order or less than the lifetime of emitting pairs, and if the velocity of convective motions is sufficient to produce the observed PWN extent. Simulations of this process suggest a crushing time-scale yrs and convective motions at speeds km s-1(van der Swaluw et al. (2001)). Assuming that the PWN had a radius of a few pc before interacting with the reverse shock, these values are roughly consistent with the observed nebular extent and the lifetimes of emitting electrons inferred above, and we thus think an asymmetric reverse-shock interaction the most likely explanation for the observed nebular morphology. One important consideration in this interpretation is that we do not directly detect the SNR required to generate this effect; we discuss this issue in §4.3 below.
Recent evidence has suggested that characteristic ages can overestimate (Kaspi et al. 2001b ) or underestimate (Gaensler & Frail (2000)) a pulsar’s true age by up to an order of magnitude, depending on assumptions made about the initial period of and braking torque acting on the neutron star. The PWN / reverse shock interaction which we have proposed here is expected to take place yrs after the supernova explosion (Reynolds & Chevalier (1984)), in approximate agreement with the characteristic age kyr measured for PSR B1823–13. Thus within the reverse shock scenario, the available evidence suggests that the pulsar’s characteristic age and true age are broadly consistent.
4.3. The Lack of an Associated Supernova Remnant
The interpretation which we have adopted in §4.2 requires the presence of a surrounding SNR in order to generate the reverse shock which consequently interacts with the PWN. However, no such SNR has been detected at radio wavelengths (Braun, Goss, & Lyne (1989)), nor do we see any surrounding shell of X-ray emission from such a source in the data presented here.
The lack of detectable SNRs around pulsars with small characteristic ages has long been problematic (e.g. Reynolds & Aller (1985); Frail et al. (1995)). It is thought that such SNRs must exist, as otherwise the PWN would expand freely into the ambient medium, and would produce a highly extended and unobservable “ghost nebula” (Blandford et al. (1973)). In the specific case of Vela-like pulsars such as PSR B1823–13, Braun et al. (1989) interpret the absence of a detectable radio SNR as resulting from the rapid expansion of the SNR blast wave into a low density cavity, followed by a collision with a dense surrounding shell evacuated by the progenitor wind. The SNR’s radio and X-ray emissions then fade rapidly as the SNR’s energy is dissipated through radiative shocks. Simulations of this process clearly show that the SNR/shell interaction drives a reverse shock back towards the center of the system (e.g. Tenorio-Tagle et al. (1990)). Furthermore, either an offset of the progenitor from the center of its wind bubble or pressure variations within the turbulent SNR/bubble interaction region can cause different parts of the reverse shock to collide with the PWN at different times (Różyczka et al. (1993); Dwarkadas (2001)), compressing the PWN in a highly asymmetric fashion as is required here.
We can consider whether such a SNR would be detected by scaling the emission seen from the Vela SNR. Lu & Aschenbach (2000) find that X-rays from the Vela SNR can be modeled as a two-component Raymond-Smith plasma, with temperatures for the two components of keV and keV. The volume-integrated emission measure for the cooler component is times that of the hotter component, and the total unabsorbed luminosity (0.1–2.5 keV) is erg s-1 for a distance of 250 pc. Scaling to a distance of 4 kpc, the expected unabsorbed 0.1–2.5 keV flux densities for the two components are erg cm-2 s-1 and erg cm-2 s-1.
Using the W3PIMMS tool,666http://asc.harvard.edu/toolkit/pimms.jsp we can determine that the expected EPIC MOS count rate from such a source is 0.18–0.29 cts s-1 for absorbing columns in the range cm-2. Again scaling from the Vela SNR, we expect this emission to be distributed around a shell of diameter . Assuming a shell thickness 20% of its radius, the expected surface brightness for EPIC MOS would be cts s-1 arcsec-2, several times below the observed background level off-axis of cts s-1 arcsec-2 (after correction for vignetting). We can make similar calculations for archival observations of this source with ROSAT and ASCA: for ROSAT PSPC we expect a SNR surface brightness cts s-1 arcsec-2 against an observed background in these data of cts s-1 arcsec-2, while for ASCA GIS we expect a SNR surface brightness cts s-1 arcsec-2 against the observed background of cts s-1 arcsec-2. Thus we expect that any emission from a Vela-like SNR associated with PSR B1823–13 would not be detectable in any of these observations. This conclusion is strengthened by the fact that the characteristic age of PSR B1823–13 is approximately twice that of the Vela pulsar; if this indicates a similar difference in these pulsars true ages, any associated SNR would most likely be even fainter than considered here.
For the radio observations carried out in this direction by Braun et al. (1989), we estimate a 1-GHz surface brightness sensitivity for a SNR of this extent of W m-2 Hz-1 sr-1 (3 ), where we have assumed a typical radio photon index and have accounted for primary beam attenuation. There are certainly many SNRs fainter than this, including relatively young SNRs such as G266.2–1.2 (Duncan & Green (2000)). Thus, the failure to detect a SNR associated with PSR B1823–13 is not inconsistent with the possibility that a rapidly expanding, rapidly fading SNR has produced the pressure which has confined and distorted the PWN.
5. Conclusions
We have carried out a deep X-ray observation of the Vela-like pulsar B1823–13 with XMM-Newton. We find that all the detected X-ray emission results from the interaction between the relativistic pulsar wind and its environment: a bright elongated core immediately surrounding the pulsar most likely represents the wind termination shock, while a surrounding faint region with a softer spectrum corresponds to a pulsar wind nebula with a mean magnetic field of G. Emission from the pulsar itself, either in the form of a central point source or as pulsations at the 101-ms pulsar period, is not detected.
The nebula, which we designate G18.0–0.7, is distinctly one-sided: most of its emission is distributed in a region of extent restricted to the southern side of the pulsar. We interpret this morphology as resulting from the compression and distortion of the pulsar wind by the asymmetric reverse shock produced by an unseen surrounding supernova remnant. Deeper observations of PSR B1823–13 and other young pulsars at meter wavelengths, carried out with the Very Large Array and with LOFAR, are probably the most promising way to directly detect these associated SNRs. The reverse shock interaction between a pulsar nebula and its surrounding supernova remnant is expected to occur 10–20 kyr after the supernova explosion, suggesting that many Vela-like pulsars might be in this phase of evolution. Future observations of other such pulsars and their nebulae with XMM-Newton can explore this possibility.
References
- Arnaud et al. (2002) Arnaud, M. et al. 2002, A&A, 390, 27.
- Bałucińska-Church & McCammon (1992) Bałucińska-Church, M. & McCammon, D. 1992, ApJ, 400, 699.
- Becker & Trümper (1997) Becker, W. & Trümper, J. 1997, A&A, 326, 682.
- Blandford et al. (1973) Blandford, R. D., Ostriker, J. P., Pacini, F., & Rees, M. J. 1973, J. Astrophys. Astr., 23, 145.
- Blanton & Helfand (1996) Blanton, E. L. & Helfand, D. J. 1996, ApJ, 470, 961.
- Blondin, Chevalier, & Frierson (2001) Blondin, J. M., Chevalier, R. A., & Frierson, D. M. 2001, ApJ, 563, 806.
- Braun, Goss, & Lyne (1989) Braun, R., Goss, W. M., & Lyne, A. G. 1989, ApJ, 340, 355.
- Buccheri et al. (1983) Buccheri, R. et al. 1983, A&A, 128, 245.
- Bucciantini (2002) Bucciantini, N. 2002, A&A, 387, 1066.
- Chevalier (1998) Chevalier, R. A. 1998, Mem. Soc. Astron. It., 69, 977.
- Clifton et al. (1992) Clifton, T. R., Lyne, A. G., Jones, A. W., McKenna, J., & Ashworth, M. 1992, MNRAS, 254, 177.
- Cordes & Lazio (2002) Cordes, J. M. & Lazio, T. J. W. 2002, . astro-ph/0207156.
- Duncan & Green (2000) Duncan, A. R. & Green, D. A. 2000, A&A, 364, 732.
- Dwarkadas (2001) Dwarkadas, V. V. 2001, J. Korean Astr. Soc., 34, 243.
- Finley, Srinivasan, & Park (1996) Finley, J. P., Srinivasan, R., & Park, S. 1996, ApJ, 466, 938.
- Frail et al. (1995) Frail, D. A., Kassim, N. E., Cornwell, T. J., & Goss, W. M. 1995, ApJ, 454, L129.
- (17) Gaensler, B. M., Arons, J., Kaspi, V. M., Pivovaroff, M. J., Kawai, N., & Tamura, K. 2002a, ApJ, 569, 878.
- Gaensler & Frail (2000) Gaensler, B. M. & Frail, D. A. 2000, Nature, 406, 158.
- Gaensler, Jones, & Stappers (2002) Gaensler, B. M., Jones, D. H., & Stappers, B. W. 2002b, ApJ, 580, L137.
- Gaensler et al. (2000) Gaensler, B. M., Stappers, B. W., Frail, D. A., Moffett, D. A., Johnston, S., & Chatterjee, S. 2000, MNRAS, 318, 58.
- Gotthelf & Vasisht (1997) Gotthelf, E. V. & Vasisht, G. 1997, ApJ, 486, L133.
- Helfand, Gotthelf, & Halpern (2001) Helfand, D. J., Gotthelf, E. V., & Halpern, J. P. 2001, ApJ, 556, 380.
- Høg et al. (1998) Høg, E., Kuzmin, A., Bastian, U., Fabricius, C., Kuimov, K., Lindegren, L., Makarov, V. V., & Roeser, S. 1998, A&A, 335, L65.
- (24) Kaspi, V. M., Gotthelf, E. V., Gaensler, B. M., & Lyutikov, M. 2001a, ApJ, 562, L163.
- (25) Kaspi, V. M., Roberts, M. S. E., Vasisht, G., Gotthelf, E. V., Pivovaroff, M., & Kawai, N. 2001b, ApJ, 560, 371.
- Kennel & Coroniti (1984) Kennel, C. F. & Coroniti, F. V. 1984, ApJ, 283, 694.
- Koyama et al. (1995) Koyama, K., Petre, R., Gotthelf, E. V., Hwang, U., Matsura, M., Ozaki, M., & Holt, S. S. 1995, Nature, 378, 255.
- Kuster et al. (1999) Kuster, M., Benlloch, S., Kendziorra, E., & Briel, U. G. 1999, Proc. SPIE, 3765, 673.
- Leahy, Elsner, & Weisskopf (1983) Leahy, D. A., Elsner, R. F., & Weisskopf, M. C. 1983, ApJ, 272, 256.
- Lu & Aschenbach (2000) Lu, F. J. & Aschenbach, B. 2000, A&A, 362, 1083.
- Lu et al. (2002) Lu, F. J., Wang, Q. D., Aschenbach, B., Durouchoux, P., & Song, L. M. 2002, ApJ, 568, L49.
- Lumb et al. (2002) Lumb, D. H., Warwick, R. S., Page, M., & De Luca, A. 2002, A&A, 389, 93.
- Manchester et al. (2002) Manchester, R. N. et al. 2002, in Neutron Stars in Supernova Remnants, ed. P. O. Slane & B. M. Gaensler, (San Francisco: Astronomical Society of the Pacific), 31.
- Murray et al. (2002) Murray, S. S., Slane, P. O., Seward, F. D., Ransom, S. M., & Gaensler, B. M. 2002, ApJ, 568, 226.
- Pavlov & Zavlin (2000) Pavlov, G. G. & Zavlin, V. E. 2000, in Pulsar Astronomy — 2000 and Beyond, IAU Colloquium 177, ed. M. Kramer, N. Wex, & R. Wielebinski, (San Francisco: Astronomical Society of the Pacific), p. 613.
- Pavlov et al. (2001) Pavlov, G. G., Zavlin, V. E., Sanwal, D., Burwitz, V., & Garmire, G. P. 2001, ApJ, 552, L129.
- Pivovaroff et al. (2001) Pivovaroff, M., Kaspi, V. M., Camilo, F., Gaensler, B. M., & Crawford, F. 2001, ApJ, 554, 161.
- Possenti et al. (2002) Possenti, A., Cerutti, R., Colpi, M., & Mereghetti, S. 2002, A&A, 387, 993.
- Raymond & Smith (1977) Raymond, J. C. & Smith, B. W. 1977, ApJS, 35, 419.
- Reynolds & Aller (1985) Reynolds, S. P. & Aller, H. D. 1985, AJ, 90, 2312.
- Reynolds & Chevalier (1984) Reynolds, S. P. & Chevalier, R. A. 1984, ApJ, 278, 630.
- Reynolds & Keohane (1999) Reynolds, S. P. & Keohane, J. W. 1999, ApJ, 525, 368.
- Różyczka et al. (1993) Różyczka, M., Tenorio-Tagle, G., Franco, J., & Bodenheimer, P. 1993, MNRAS, 261, 674.
- Sakurai et al. (2001) Sakurai, I., Kawai, N., Torii, K., & Shibata, S. 2001, in New Century of X-ray Astronomy, ed. H. Inoue & H. Kunieda, (San Francisco: Astronomical Society of the Pacific), p. 408.
- Slane et al. (2000) Slane, P., Chen, Y., Schulz, N. S., Seward, F. D., Hughes, J. P., & Gaensler, B. M. 2000, ApJ, 533, L29.
- Slane et al. (1999) Slane, P., Gaensler, B. M., Dame, T. M., Hughes, J. P., Plucinsky, P. P., & Green, A. 1999, ApJ, 525, 357.
- Slane et al. (2001) Slane, P., Hughes, J, P., Edgar, R. J., Plucinsky, P. P., Miyata, E., Tsunemi, H., & Aschenbach, A. 2001, ApJ, 548, 814.
- Slane, Helfand, & Murray (2002) Slane, P. O., Helfand, D. J., & Murray, S. S. 2002, ApJ, 571, L45.
- Stappers et al. (2003) Stappers, B. W., Gaensler, B. M., Kaspi, V. M., van der Klis, M., & Lewin, W. H. G. 2003, Science, . in press.
- Strickman, Harding, & de Jager (1999) Strickman, M. S., Harding, A. K., & de Jager, O. C. 1999, ApJ, 524, 373.
- Tenorio-Tagle et al. (1990) Tenorio-Tagle, G., Bodenheimer, P., Franco, J., & Różyczka, M. 1990, MNRAS, 244, 563.
- van der Swaluw et al. (2001) van der Swaluw, E., Achterberg, A., Gallant, Y. A., & Tóth, G. 2001, A&A, 380, 309.
- Wang, Li, & Begelman (1993) Wang, Q. D., Li, Z.-Y., & Begelman, M. C. 1993, Nature, 364, 127.
- Weisskopf et al. (2000) Weisskopf, M. C. et al. 2000, ApJ, 536, L81.
| Date of Observation | Length of Observation (ks) | Effective Exposure (ks) | ||
|---|---|---|---|---|
| MOS1 | MOS2 | pn | ||
| 2001 October 16 | 30.5 | 17.8 | 18.3 | 10.2 |
| 2001 October 18 | 29.8 | 23.0 | 23.2 | 12.6 |
| TOTAL | 60.3 | 40.8 | 41.5 | 22.8 |
| RA (J2000) | |
|---|---|
| Dec. (J2000) | |
| Frequency (Hz) | 9.85564535524(1) |
| Frequency derivative (Hz s-1) | |
| Frequency second derivative (Hz s-2) | |
| Epoch of Ephemeris (MJD) | 50750.000000 |
| Range of Validity (MJD) | 49156 to 52359 |
| Region | Total Counts | Model | ||||||
|---|---|---|---|---|---|---|---|---|
| MOS1 | MOS2 | pn | ( cm-2) | —/(keV)/(keV) | ( erg cm-2 s-1)aaFlux densities are for the energy range 0.5–10 keV, and have been corrected for interstellar absorption. | |||
| CorebbCounts and flux densities listed here for the core correspond only to of the total for this region (see text for details). | PL | |||||||
| PL | 1.0 (fixed) | |||||||
| PL | 1.4 (fixed) | |||||||
| BB | ||||||||
| Diffuse | PL | |||||||
| Component | PL | 1.0 (fixed) | ||||||
| PL | 1.4 (fixed) | |||||||
| Brem | ||||||||
| SRCUT | ||||||||
| RS | ||||||||
| MEKAL | ||||||||
| NEI | ||||||||