The dynamics of the nebula M1-67 around the run-away Wolf-Rayet star WR 124
(The image quality has been reduced to submit this paper to astro-ph. To get a full resolution version, please visit http://www.astro.uu.nl/~sluys/m1-67/ .)
A new point of view on the dynamics of the circumstellar nebula M1-67 around the run-away Wolf-Rayet (WR) star WR 124 is presented. We simulated the outbursts of nebulae with different morphologies, to compare the results to the observed dynamical spectra of M1-67. We found that it has been interacting with the surrounding ISM and has formed a bow shock due to its high velocity of about relative to the local ISM. The star is about 1.3 parsec away from the front of this bow shock. The outbursts that are responsible for the nebula are assumed to be discrete outbursts that occurred inside this bow shock. The ejecta collide with this bow shock shortly after the outburst. After the collision, they are dragged away by the pressure of the ISM, along the surface of the bow shock. The bow shock is oriented in such way that we are looking from the rear into this paraboloid, almost along the main axis. Evidence for this is given firstly by the fact that the far hemisphere is much brighter than the near hemisphere, secondly by the fact that there is hardly any emission found with radial velocities higher than the star’s radial velocity, thirdly by the fact that the star looks to be in the centre of the nebula, as seen from Earth, and finally by the asymmetric overall velocity distribution of the nebula, which indicates higher radial velocities in the centre of the nebula, and lower velocities near the edges. We find evidence for at least two discrete outbursts that occurred inside this bow shock. For these outbursts, we find expansion velocities of and dynamical timescales of about 0.8 and yr, which are typical values for LBV outbursts. We therefore conclude that M1-67 originates from several outbursts that occurred inside the bow shock around WR 124, during an LBV phase that preceded the current WR phase of the star.
Key Words.:
Stars: circumstellar matter – Stars: individual: WR 124 – Stars: mass-loss – Stars: Wolf-Rayet – ISM: individual objects: M1-67 – ISM: jets and outflows1 Introduction
In this article, we describe our research on the dynamics of the Wolf-Rayet ring nebula M1-67. M1-67 is a bright nebula around the Wolf-Rayet (WR) star WR 124. The star has a high heliocentric velocity of almost 200 and is also known as Merrill's star (Merrill 1938) and 209 BAC. The star is classified as a population I WN8 star (Bertola 1964) and is located in the constellation Sagittarius. Distance estimates vary from about 4.5 kpc (Pismis & Recillas-Cruz 1979) to 6.5 kpc (Nugis & Lamers 2000). The star has a terminal wind velocity of 710 and a mass loss of . Its mass is estimated to be about and its luminosity (Nugis & Lamers 2000).
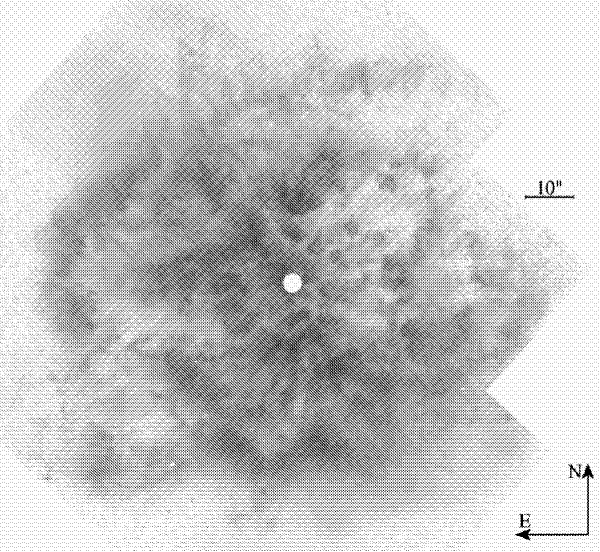
The nebula M1-67 around WR 124 shows a clumpy structure, and most of the gas is concentrated in knots and filaments (Sirianni et al. 1998). An HST image of the nebula is displayed in Fig. 3. The nebula was first classified as an H ii region. After the discovery that the nebula has about the same radial velocity as WR 124, it was suggested that the nebula might be a planetary nebula (Minkowski 1946). However, the presence of a WR star and the N-enhancement and O-deficiency of the nebula suggest a WR ring nebula (Sirianni et al. 1998). The distance estimates also point in the direction of an ejected nebula, so that M1-67 is now generally accepted as a Wolf-Rayet ring nebula.
Though WR ring nebulae are not necessarily ring-shaped, they often exhibit a structure of arcs or rings. This suggests that the nebulae may be created by discrete outburst events. It is generally thought that WR ring nebulae originate from a Luminous Blue Variable (LBV) stage of the central star, which is supposed to precede the WR phase.
More than half of the LBVs have circumstellar nebulae (Nota & Clampin 1997). The different nebulae are very similar in terms of physical properties. The expansion velocities are in the order of 50 to , their sizes about 1 parsec, and the dynamical ages are in the order of yr. The densities of the nebulae are generally found to be low (500 to 1000 cm-3) and the temperatures are in the range of 5000 to 10 000 K (Lamers et al. 2001).
It is still a point of debate whether the LBV outbursts occur during a Red Supergiant (RSG) or a Blue Supergiant (BSG) phase. The RSG scenario is proposed by Stothers & Chin (1993, 1996), who suggest that the ejection of mass occurs only as a single event during a brief RSG phase. They explain the enhanced abundances of heavy elements of the ejecta by convective mixing in the RSG envelope (Stothers & Chin 1993, 1996).
On the other hand, Langer et al. (1994) suggest that after the star has left the main sequence, it moves red-ward in the Hertzsprung-Russel diagram (HR diagram) and the expanding envelope becomes unstable, so that the star starts to develop extreme mass loss. This mass loss may be as high as 5 10-3 M☉ yr-1 and is observed as the LBV ejecta. They explain the chemically enriched ejecta by rotation induced mixing. These eruptions therefore take place when the star is a BSG and prevent it from becoming a RSG (Langer et al. 1994; Lamers et al. 2001).
The research of the chemical composition of LBV-ejecta by Lamers et al. (2001) also indicates that the LBV eruptions occur during a BSG phase. They suggest that the LBV outbursts are induced by the rapid, near-critical rotation of the star. In their scenario, the star is also being prevented from becoming a RSG by the mass loss. However, they point out that if a massive, optically thick shell is being expelled from the star, it will cool as it expands and the physical conditions will temporarily be similar to that in the outer layers of a RSG, so that the formation of dust can also happen in this case. This mechanism explains the observed Humphreys-Davidson limit, that depicts the lack of RSGs with luminosities higher than 6 105 L☉.
The goal of our research is to disentangle the geometry and dynamics of the nebula M1-67. In order to do so, we create different numerical models, of which the output is compared to available observations. Firstly, we present the observational data we use for this study in Sect. 2. We will then discuss our models for freely expanding outbursts in Sect. 3. The reason why we let these models expand freely is that the O-star that precedes a WR star blows a bubble of typically 30 pc in the ISM during its lifetime (Lamers & Cassinelli 1999). It will take an outburst of more than yr to cross this distance, so that it can indeed be considered to expand without any disturbance. We will find that no satisfying fit can be made, so that the assumption of a freely expanding outburst is wrong. We show that the cause for this is that the star has a high velocity relative to the ISM. This causes a paraboloid-like bow shock instead of a more or less spherical bubble. The star is about 1 pc away from the front of this bow shock, so that an outburst of needs only yr to cross it. Once it has done so, part of the outburst will collide with the bow shock, and will possibly be dragged away along the bow shock surface. We discuss the bow shock models for the case of a constant wind velocity in Sect. 4. In Sect. 5 we compare the theoretical bow shock models for a constant stellar wind with the observations and find a remarkable resemblance. Sect. 6 discusses the results of impacts of outbursts on the bow shock surface. In Sect. 7 we summarise the results and present the conclusions of this study.
2 Observations
For this research, we used the following three sets of observational data.
2.1 Long-slit spectra
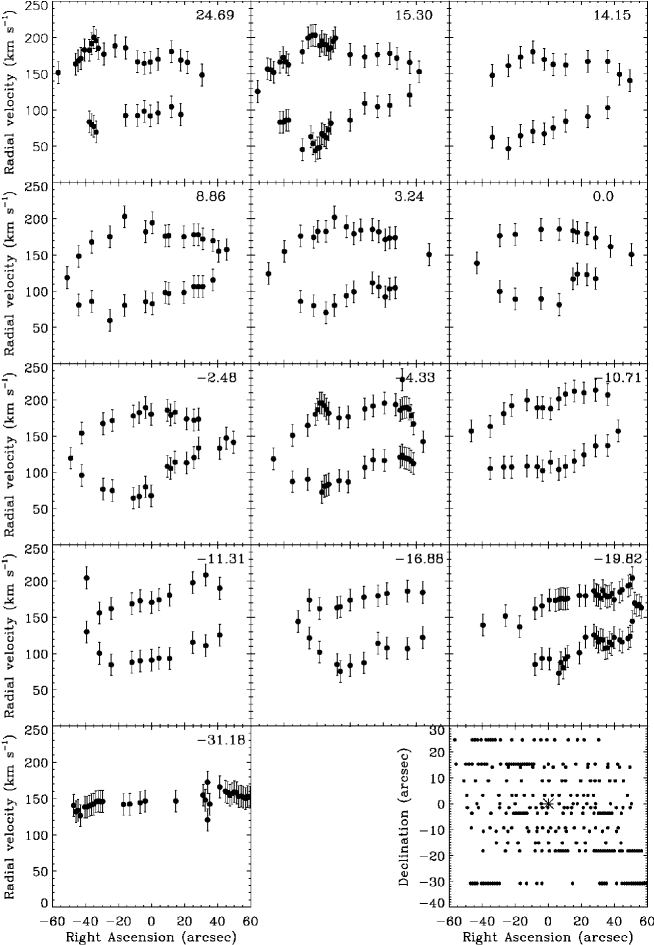
The first dataset we used, is velocity information from long slit spectra we obtained from A. Nota, published in Sirianni et al. (1998). These data consist of 13 long slit spectra, taken with the ESO Multi Mode Instrument (EMMI) at the 3.5m NTT in La Silla. Each slit is positioned over the nebula in the east-west direction, at constant declination. The declinations of the slits lie between -30.82″and +24.69″relative to the star’s declination. In total, 413 good data points (right ascension, declination and radial velocity) were derived from the spectra, which formed the input for our study. These data points have been plotted in Fig. 1.
2.2 Fabry-Pérot images
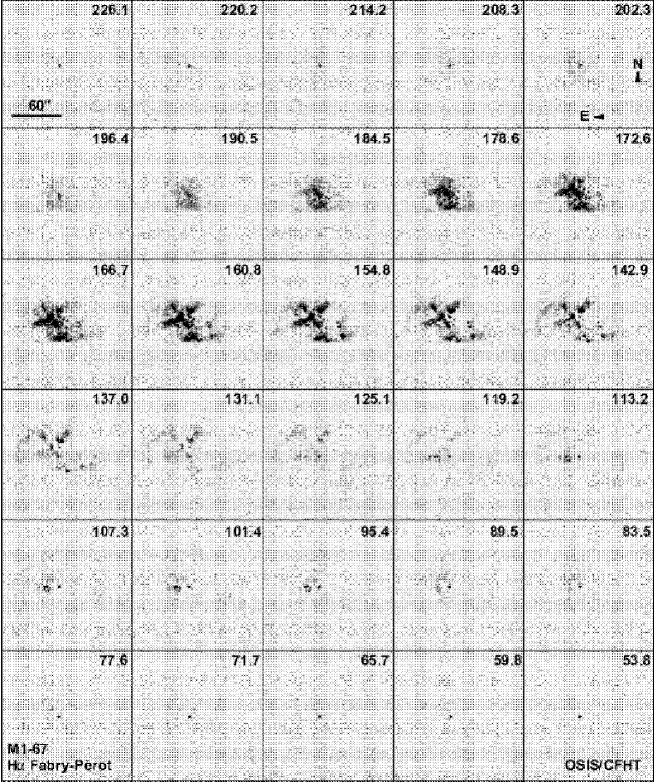
The second dataset are Fabry-Pérot (FP) images obtained from Grosdidier et al. (1999). The FP images are shown in Fig. 2. These 30 images were made in August 1996, using CFHT-SIS, with the étalon of the Université Laval, Québec, Canada. Each image was taken in H, at a slightly different wavelength, so that it displays the emission at a certain radial velocity. These observations give a much more detailed view of the velocity distribution than the long slit spectra. Each image consists of 100 100 pixels. From the darkest points, we used the coordinates (, , ) in the same way as the data points from the long slit spectra. A few thousand points were used. Note that the southern part of the nebula, more than approximately 20″south of the star, is missing (compare to Fig. 3 and see Fig. 8(b)) due to deteriorating seeing during the observations (Grosdidier et al. 1999).
2.3 HST image
For reference, we also used the Hubble Space Telescope image taken by Grosdidier et al. (1998), for example to identify structures found in the Fabry-Pérot images.
The image is a composite image of four WFPC2 images with a total exposure time of 10 000 seconds, taken in March 1997, using the narrow band F656N H filter. In the same way, four images of the same field were taken through the broadband F675W filter and combined to obtain a ’continuum’ image close to H. The continuum image was flux-scaled and subtracted from the first composite image to obtain the deep continuum-subtracted H image with the field stars removed, of which a negative version is shown in Fig. 3.
In this image different distinct arcs are visible. However, although these arcs are clearly seen locally, it is very difficult to find a global system of rings. The fact that the arcs are so clear, indicates that they are probably formed during different, discrete outbursts, whereas the deficit of a global pattern may tell us that the history of the nebula is less straightforward than we might think a first.
3 Models of freely expanding outbursts
We have developed models to simulate ejected nebulae numerically and calculate spectra from them at different slit positions. The velocity information of the part of the nebula in the slit is then converted to a position-velocity plot (PV-plot), which can be compared to observational data. The purpose of these models is to give insight in the relation between features in PV-plots and the geometry of the nebulae that cause them. Hence we have modelled the most common and most likely structures for ejected nebulae: spheres, ellipsoids and cones.
3.1 The geometry of the nebulae
We start with creating a geometry in the computer. Our structures are hollow and made up of single dots that represent the surface of the nebula. Solid or partially filled structures can be made by nesting different shells into each other. For each dot, that represents a small volume, the three rectangular coordinates with respect to the star are calculated.
For spheres we use:
| (1) |
where is the radius of the nebula, ranges from to and from to , in such way that the dots are evenly spread over the spherical surface.
Ellipsoids are made in the same way. We only consider axially symmetric ellipsoids. Their geometry is then defined by the oblateness , with and the polar and equatorial radius respectively. The and coordinates are then similar to that of the sphere in Eq. (1) and the coordinate is given by:
| (2) |
Bipolar cones are characterised by a semi-opening angle (SOA). The nebulae with this geometry can be created using the equations:
| (3) |
where varies between and and between and .
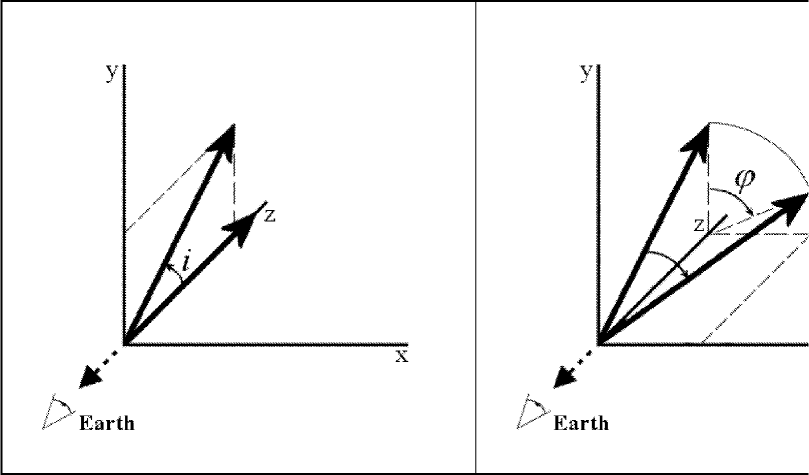
The ellipsoids and cones can be made either elongated to simulate jets, or flat to create disks. All structures have axial symmetry and are created with the line of sight as their symmetry axis ( axis). They are then rotated around a line perpendicular to the line of sight ( axis) to change the inclination and subsequently rotated around the line of sight (which is then no longer the symmetry axis) to change the position angle . This is illustrated in Fig. 4.
3.2 The velocity models
After choosing the orientation of a structure, we overlay slits of finite width and transform the radial coordinates of the underlying points to radial velocities. We assume the velocity-distance relation for the nebula to be
| (4) | |||||
| (5) |
Here, is the radius of the nebula, is the expansion velocity, is the distance to the star and is the radial distance to the star, measured along the line of sight. For we can choose a suitable radius-velocity dependence: for braking after the outburst, for a continuous outflow with constant velocity, for a single, short burst with no further interaction and for acceleration of the material after the outburst. For our models of freely expanding outbursts, a thin nebular shell with is used. Since all our structures are made up of single dots, the transformations can be carried out point by point.
For each slit, our models produce one PV-plot, in which the radial velocity information under the slit is plotted against the position along the slit. We took all slits parallel to the axis, so that they have a constant coordinate. The PV-plots thus show the radial velocity plotted against the position . All plots are scaled to arbitrary units in position and velocity, because we are only interested in the shape of a structure. In actual observations, the structures may therefore appear stretched out in either direction (position or velocity). The result of this whole exercise is a ’reference guide’ that we used to determine the origin of certain structures in observed long slit spectra.111The simulated long-slit spectra for various geometries and velocities are available from the first author via e-mail.
3.3 Freely expanding outbursts for WR 124
We tried to fit the different geometries described above and combinations of them to the long slit spectra data of M1-67, shown in Fig. 1. The clumpy and chaotic structure of the nebula made it hard to fit. We then also tried to fit parts of the nebula. However, we never found a convincing solution. We therefore questioned our assumption that the outburst around WR 124 is expanding freely and concluded that this may not be the case. The Fabry-Pérot data of Fig. 2, which we obtained afterwards, supported this conclusion. The following features in the velocity data of M1-67 particularly convinced us:
-
•
There is hardly any nebular emission seen at radial velocities higher than +208 km s-1, though the star has a radial velocity of about +199 km s-1. In case of a continuous outflow by a wind or discrete LBV-like outbursts, one would expect to find nebular emission with radial velocities of tens, or even hundreds of kilometres per second higher than that of the star.
-
•
Emission is seen at radial velocities from about +78 to , of which the average is . However, the bulk of this emission is found at velocities higher than about (See Fig. 2). This means that the high-velocity part of the nebula shows much more emission than the low-velocity part. This was already mentioned by Solf & Carsenty (1982).
-
•
There is an asymmetry in the emission distribution. When looking at the different panels in Fig. 2, starting at the highest velocity and skipping down, it is clearly seen that the emission appears close to the star and becomes increasingly broader. When skipping from the lowest velocity panel upward, it is seen that (except for some small patches at lower velocities) the emission ’starts’ at about 120– as a very broad pattern. The far hemisphere is thus narrower than the near hemisphere and the bright emission region between +140 and looks like a triangle that is pointing away from us.
The explanation that can be found in literature is that the nebula as a whole is braked by the ISM, so that the star is displaced from the centre of expansion toward the leading edge (Chu & Treffers 1981; Solf & Carsenty 1982). This means that the far and near hemisphere are braked equally, which is in contradiction with the asymmetry in the emission distribution. Instead, we think that the reason that the model of a freely expanding nebula does not hold for M1-67, is that there is indeed a strong interaction between the stellar wind and the ISM and that this interaction produces a bow shock around the stellar surface. As we will point out in Sect. 6, the bow shock model is also qualitatively able to explain the chaotic structure of the nebula, which is much more difficult to do with a freely expanding nebula.
4 The bow shock models
The failure of fitting a freely expanding shell to the velocity data of M1-67, the high radial velocity of WR 124 and the global picture from the more detailed Fabry-Pérot data show that our assumption of the freely expanding shell is incorrect. Instead, the high velocity of the star is responsible for the formation of a paraboloid-shaped bow shock. The possibility of a bow shock was already mentioned by Grosdidier et al. (1999). The bow shock model allows the star to be much closer to the ISM, which makes it easier for outbursts to collide with it. We will discuss the models for such a bow shock in this section. We start with a two-dimensional model and convert it to a rotationally symmetric three-dimensional model, which can be tilted to any wanted orientation, before obtaining the radial velocity information.
4.1 2D models for continuous mass loss
The models we use here are published by Canto et al. (1996). They derive analytical expressions to describe wind-wind interactions in general. They also discuss the special case where one wind is plane-parallel and the other spherical, as is the case when a star with spherical wind is ploughing through a homogeneous ISM. In our models we assume the interstellar medium to be homogeneous. We also assume that the stellar wind is constant over a long period ( yr) compared to the timescale of LBV-outbursts (usually on the order of yr), except during these outbursts. The wind-ISM interaction is responsible for the geometry and dynamics of the bow shock, while all emission comes from the material that is ejected during the outbursts and its collision into the bow shock surface. This implies the assumption that the momentum that is carried along with the outbursts is lower than the momentum in the wind-ISM interaction.
The distance between the star and the front of the bow shock is called the stagnation point distance and can simply be derived by momentum equilibrium:
| (6) |
where is the velocity of the ISM relative to the star (we will observe the situation from the rest frame of the star for simplicity). The geometry of the bow shock is expressed in terms of , the distance between the star and a point on the bow shock, as a function of the angle that is defined in Fig. 5(a):
| (7) |
(Canto et al. 1996). The velocity of the material along the surface of the shock is split in a component parallel to the symmetry axis ( axis, ) and a component perpendicular to it (). They are given by:
| (8) | |||||
| (9) | |||||
| (10) |
(Canto et al. 1996), where is the total velocity along the bow shock surface. In Fig. 5 the geometry and the total velocity along the surface are displayed.

4.2 3D models for continuous mass loss
The model of Canto et al. (1996) is two-dimensional and can easily be converted into a 3D-model by
| (11) |
where is defined in Fig. 5(a) and takes evenly spread values between 0 and around the symmetry axis. Thus, the 3D surface is obtained by rotating Fig. 5(a) around the horizontal axis. The velocity components are given by
| (12) |
and by Eq. (8).
The three-dimensional bow shock model is now complete and oriented in such a way that the observer is looking into the hollow shock from the rear. We can now rotate the shock to any orientation we like, about the angles and as indicated in Fig. 4. The velocity components are rotated the same way, and we can use the celestial coordinates and and the radial velocity to compare the predicted radial velocity maps to the observations.
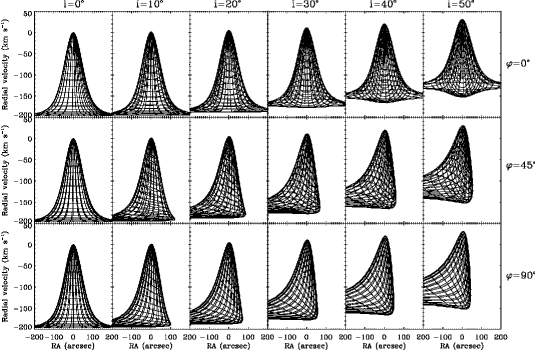
Fig. 6 displays the Right Ascension against the radial velocity of a number of bow shocks with different orientations. From these plots, two effects of the orientation of the bow shock can easily be seen. Firstly, when looking at the different columns from the left to the right, the inclination of the bow shock increases. The most important result of this is that the maximum radial velocity observed shifts from (which is the radial velocity of the star) for to more than for . This means that the velocity difference between the maximum radial velocity where nebular emission is seen and the radial velocity of the star puts an upper limit to the inclination. As we have seen in Sect. 3.3, in the case of M1-67 this difference is approximately , which gives a strong indication for a small inclination of the main axis of the bow shock. Secondly, when one looks through the different rows from the top to the bottom, the position angle changes. The result is that the axial symmetry around disappears. We will later see that for the case of M1-67, only about the upper in radial velocity are observed, so that this effect manifests itself as a steep drop in radial velocity at one side of the maximum and a slower drop at the other side. The side of the steep drop indicates the direction where the top of the bow shock points at. For example, at the lower right plot of Fig. 6, the steep side is at the right, which means that the top of the bow shock is pointing to this side, so that the star is moving, with respect to its local ISM, toward higher Right Ascension.
4.3 Orientation of the bow shock

It is possible to roughly say something about the orientation of a bow shock of a given star with respect to the line of sight (LOS). This way, we can limit the total number of possible orientations of the bow shock in M1-67 appreciably. In order to do so, we need to know the velocities of both the star and the ISM surrounding the star. The orientation of the main axis of the bow shock is simply the orientation of the vector that is the difference of the spatial velocity of the star and that of the local ISM. The spatial velocity of the star can be derived from the measured radial velocity and proper motion. For the ISM we will assume that it follows the laws of galactic rotation and derive its velocity relative to the sun. After subtracting the ISM velocity from that of the star, we can calculate the total velocity difference and the inclination and position angle of the main axis of the bow shock. We will derive these quantities here for the general case of a star with galactic longitude and latitude and respectively and distance from the sun, and then apply this to M1-67 in Sect. 5.
In the observations of the radial velocity and proper motion of the star the motion of the sun is already taken into account, so that we indeed need to correct for the motion of the sun when calculating the velocity of the ISM. First, we will correct for the motion of the local standard of rest (LSR), that moves with a velocity of around the galactic centre (GC) and subsequently the peculiar motion of the sun with respect to the LSR will be taken into account. This peculiar velocity is calculated from Hipparcos observations for different classes of stars in the galactic plane by Mignard (2000). We will use the averages of the values given in that article:
| (13) |
for the direction toward the GC, the direction of galactic rotation and toward the north galactic pole (NGP) respectively.
When looking along the line of sight (LOS) defined by the galactic coordinates and , we can calculate for a point at any distance from the sun , the distance from that point to the GC, which we will call (see Fig. 7):
| (14) |
where is the standard value for the distance from the sun to the GC: kpc. We can then calculate the angle , defined in Fig. 7, by
| (15) |
The circular velocity for a distance with 3 kpc is given by Burton (1988):
| (16) |
The components of the ISM velocity in the radial direction and the direction of galactic longitude and latitude, are then given by:
| (17) |
In these expressions, we have neglected the velocity component of the ISM perpendicular to the plane of the galaxy.
The proper motion of the star can be expressed in terms of galactic coordinates ( and ). The proper motion gives rise to spatial velocity components that are dependent of the distance. We thus have:
| (18) |
We can now calculate the velocity difference between the star and the local ISM in the three components, where we also correct for the motion of the sun:
| (19) |
The total velocity of the star with respect to the local ISM is what we called in Sect. 4.1:
| (20) |
Furthermore, we can also find an expression for the inclination and position angle :
| (21) | |||||
| (22) |
where denotes the angle between the line of constant declination and the line of constant galactic latitude at the position of the star.
The uncertainties in the distance and in the proper motion of the star introduce a range of possible values for , and , which is a constraint that we can use to reduce the total number of possible orientations drastically. This makes it easier to compare our models to the observations, as we will do in the next section.
5 Comparison of bow shock models for continuous mass loss with observations
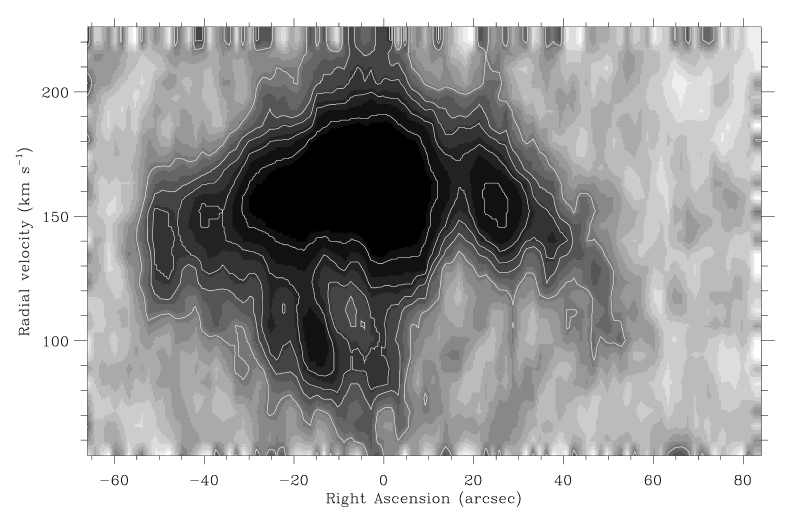
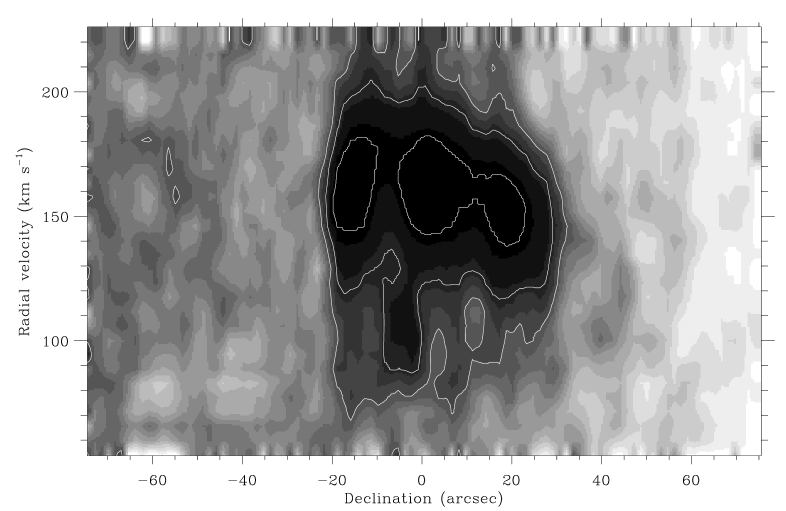
In this section we will use the bow shock model discussed in Sect. 4 to explain the distribution of emission as observed in the Fabry-Pérot images. In order to do this properly, we transformed the observational data in Fig. 2 to an image that displays the emission distribution in the Right Ascension – radial velocity plane. This was done by stacking the 30 different FP images on top of each other to create a 3D body, with two spatial dimensions and one radial velocity dimension. Then we summed all layers with constant declination to get the image that is shown in Fig. 8(a). Fig. 8(b) shows the same image, but here the Right Ascension is replaced by the declination. These are the images we will compare our bow shock models with different parameters to.
We apply the properties of WR 124 to the results that we derived in Sect. 4.3. The star has galactic coordinates , . At this position, the angle has the value of . The proper motion of WR 124 was measured by Hipparcos and can be converted to galactic coordinates:
| (23) |
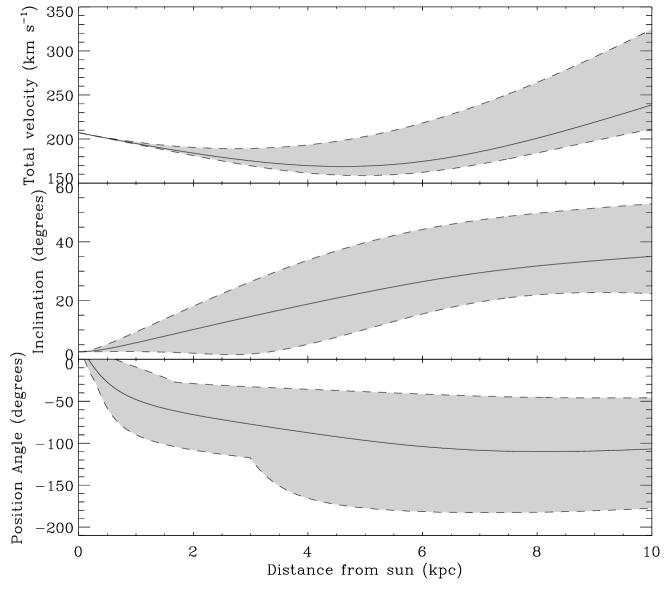
We can then use Eqs. (20), (21) and (22) to calculate the velocity difference between the star and the ISM (), as well as the inclination () and position angle () of the main axis of the bow shock (as defined in Fig. 4), as a function of the distance () of WR 124 from the sun. The results are plotted in Fig. 9, where the most probable value, the upper and lower limit of the proper motion of M1-67 are depicted in the solid and dashed lines respectively. Because of the great distance to the star, the uncertainties in the proper motion are quite large, so that the resulting uncertainties in the velocity components perpendicular to the LOS are also large and increase with the distance.
Next, we apply the results from Sect. 4.1. For kpc, Eq. (20) gives and we find from Eq. (6) that pc, where we used , (Nugis & Lamers 2000) and .
We can now build the 3D models as described in Sect. 4.2 and rotate them according to the angles found in Fig. 9. Because of the large uncertainty in the proper motion, we calculate three different models for each distance , with the three different values found at each line in Fig. 9 for , and and plot a contour of the model output over Fig. 8. The result is displayed in Fig. 10, for distances of 6.0, 6.5, 7.0, 7.5, 8.0, and 8.5 kpc.
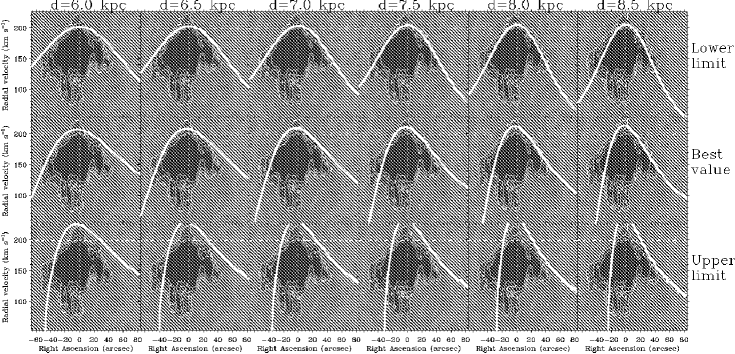
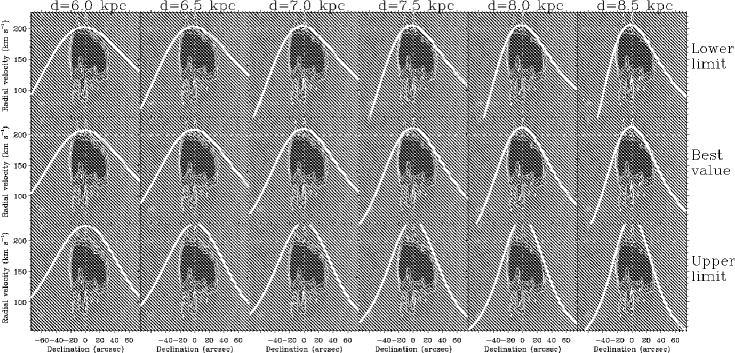
The resemblance between the models and the data is remarkable. It is clear that the best model can be found somewhere in the first row and the third or fourth column of Fig. 10. From that, it can be inferred that the best values for the parameters are , and , so that the star is moving south, under a very small inclination with respect to the line of sight. The resemblance between the data and the model indicates that the values for these three parameters fit well, not that this distance is better than other values. The distance was only used to obtain likely values for these parameters. As can be seen from Fig. 9, there are more distances that can explain this combination of the three parameters. We conclude that the bow shock model with the parameters given above is successful in explaining the overall features of the two velocity versus position ( or ) plots of Fig. 8 and Fig. 10.
There are of course also differences between the model output and the observations. Part of these differences can be attributed to the fact that we assume a continuous mass loss from the star, which is in reality unlikely to be the case. In fact, in Sect. 6 we will argue that the mass loss occurred in outbursts. Also, we assume the ISM to be homogeneous. Inhomogeneities in the ISM will cause a less smooth bow shock surface, as indeed seen in the observations. The largest disagreement between model and observations is of course seen in the lower panel of Fig. 10. This is due to the lack of observational data for declinations less than about -20″(see Sect. 2.2 and Fig. 8).
6 The effect of outbursts on the bow shock
So far, we have looked at a bow shock that is formed due to a continuous wind. However, as we have already noted in Sect. 1 and 2.3, the distinct arcs that can be seen in the HST image are likely to originate from discrete outbursts. Since these kinds of outbursts only take place after the star has moved from the main sequence and since the O-star that preceded WR 124 must already have had a strong wind, these outbursts must have occurred inside the bow shock. In this section we will describe what the effects of a short outburst on the bow shock is.
In the first phase the outburst will expand freely and both the geometrical and velocity structure are undisturbed, apart from the extra radial velocity due to the velocity of the star. Typical timescales for this phase are derived from division of the distance of a few parsec by a typical LBV outburst velocity of , which gives a few times yr. After this time, the outburst will impact onto the bow shock surface, which will affect the observed nebula in different ways. Firstly, the outburst will be braked or possibly even be halted by the surface of the bow shock. This means that the radial velocity will change drastically and that the nebula will brighten. Even in the case of a spherical outburst, the different parts of the outburst will reach the bow shock at different times, so that these effects of braking and brightening will propagate through the nebula, starting at its top. Secondly, the gas of the outburst will be dragged along the surface of the bow shock and eventually adopt its velocity. This means again a difference in the velocity pattern and a distortion in the (thus far possibly symmetric) geometry of the outburst.
Because the magnitude of the effect described above will depend strongly on the relative momenta of the matter in both the bow shock and the outburst, we divide the outbursts in three simple categories:
-
1.
Spherical outbursts where the momentum of the outburst is smaller than that of the wind-ISM shock
-
2.
Spherical outbursts where the momentum of the outburst is larger than that of the wind-ISM shock
-
3.
Non-spherical outbursts that may be a combination of the two cases above: in some directions , in others .
In the first case, the geometry and dynamics of the bow shock will not be changed too much by the impact of the outburst. Those of the outburst, however, will change appreciably. The freely expanding gas will impact onto the bow shock, brighten and be dragged along the surface layer of the bow shock. The outburst will adopt the geometry and dynamics of the bow shock quickly, so that it is eventually only recognisable as a bright, distorted ellipse in the diffuse, weak, if at all visible, background of the gas that resides in the bow shock.
In the second case, the steady bow shock is distorted by the impact. The outburst will be brightened and slowed down at the moment of impact, but will continue its motion for a while. Eventually, the outburst will be halted by the ongoing ram-pressure of the ISM, but this will happen at a larger distance from the star than where it first hit the bow shock. This situation can be described in the same way as the situation before the outburst, only with a stronger wind (with lower velocity but a much higher mass loss). This will result in a larger stagnation point distance , as given by Eq. (6). The outburst will change the shape of the bow shock temporarily, because the different parts of the outburst will impact at different times. The distortion will thus propagate through the bow shock, starting at its top. Eventually, this results in a bow shock with the same geometry, but a different size and different dynamics. The size simply scales with , but the velocities in Eq. (8) and Eq. (9) depend on the mass loss and terminal wind velocity in a more complex way. After the outburst, the momentum of the quiet wind will drop back to its old value, because the outburst itself lasts only very short compared to the evolutionary timescale of the star in this phase. Because of this, the old value of may be reinstalled after some time.
In the third case a non-spherical outburst occurs. Many LBV outbursts are known to be bipolar, the best known example being Carinae. Bipolarity of an LBV outburst can result from binarity, or from fast rotation. Since an interacting spherical outburst as described above can at best result in an elliptical ring, the structures in this case are already more complex. This complexity will increase when the impact occurs. In the case of a non-spherical outburst, it is likely that the outburst will not hit the bow shock at its top first, but somewhere on the side, where the surface velocity of the shock is much higher. Thus the resulting drag will be stronger and will decrease symmetry even further.

In all cases, part of the outburst will move toward the rear end of the bow shock. Because this end is open, it will never interact with the bow shock surface and keep expanding freely. This part of the outburst can therefore be used to derive a dynamical timescale directly. In the velocity data of M1-67, we find a freely expanding structure that is labelled as A in Fig. 11. From comparison with Fig. 10 it is clear that this structure is not located on the bow shock surface. We fitted the structure A to an ellipse, assuming that WR 124 is at the centre of expansion. From the fit, we found and ( pc at kpc), which gives a dynamical timescale of or about yr for for the estimated distance of 6.5 kpc for WR 124. This timescale is typical for LBV outbursts and therefore a strong hint that the nebula M1-67 may indeed be the result of LBV-like eruptions. It is very unlikely that the structure A is the only result of the outburst that caused it, which we will refer to as outburst A. The structure is clearly expelled toward us, and one would expect to find a counterpart of this structure that was caused by the same outburst, but directed away from us. This counterpart should be clearly visible, as long as it hasn’t reached the bow shock surface yet, because it should have a much higher radial velocity than the star (up to ). Since we do not see this counterpart, it must have collided with the bow shock surface already. Given the expansion velocity derived above () and the stagnation point distance of pc (Sect. 5), it would take the part of outburst A that is directed away from us about yr to reach the bow shock surface. Within the accuracy of the fit, this time agrees with the fitted dynamical timescale of yr. This means that the counterpart of the freely expanding structure A might have collided with the bow shock just a short time ago. It is therefore very likely that the structure A originates from the most recent outburst that occurred on WR 124.
The interactions between parts of an outburst and the steady bow shock can cause a very chaotically looking nebula, just as is the case for M1-67. In particular, it will generate elliptical structures of which many can be seen in Fig. 3. Another result of the impact of an outburst onto the bow shock, is that it is no longer possible to simply fit an undisturbed, freely expanding nebula to this part and derive its dynamical timescale. However, we may still be able to estimate the dynamical timescales of parts of the outburst that have been interacting.
The majority of the emission of M1-67 seems to originate from the surface of the bow shock in the position-velocity diagram of Fig. 10. Consider the structure that we labelled B in Fig. 11. From the Fabry-Pérot images, we derive its velocity, as shown in Fig. 11(c). This figure, compared to the first row, fourth column image of Fig. 10(a), shows that the structure lies on the bow shock surface. We do not know the exact path that it travelled to get to its current position, but we do know that this path must be in the plane that is defined by the main axis of the bow shock and the current position of this structure B. We can therefore characterise the path by a single angle , that is the angle between the line that joins the front of the bow shock and the star and the direction in which the structure was expelled, as depicted in Fig. 12(a). After the outburst B, that caused the structure B, occurred, the ejecta first crossed the distance between the star and the bow shock surface in a straight line and at a constant velocity. After having reached the bow shock surface, the ejecta collided with it and were eventually dragged away along the bow shock surface toward the rear, until they reached their current position. The angle can have values ranging from (expelled exactly toward the front of the bow shock) to about , the angle at which the structure is observed now, which would mean that it moved from the star straight to its current position. If we assume that the structure B was expelled at the same outburst as the freely expanding structure A discussed above, it should have crossed the distance to the bow shock surface with a velocity of . The velocity on the bow shock, along its surface, is given by Eq. (10). If we then integrate over the path, we find a dynamical timescale as a function of . The results are displayed in Fig. 12(b). From this, we find that the dynamical timescale for structure B must be greater than yr, for the case where this structure has moved directly from the star to its current position, and that it is very likely that the dynamical timescale is in the order of yr (for ). For this , the timescale would even increase to about yr, if the expansion velocity would be . For very small , the dynamical timescale goes to infinity, because the velocity along the bow shock surface drops to zero near the front (See Fig. 5(b)).
One could debate whether the ejecta can survive the harsh stellar environment for a few times yr. Indeed, we see that blobs of gas around young, hot stars are photoionised by the strong radiation field of the star, after which the ionised gas is blown away by the stellar wind. Being a Wolf-Rayet star, WR 124 clearly has such a strong radiation field. However, the gas cannot been blown away by the wind, since there is an equilibrium on the surface of the bow shock between the stellar wind and the ram pressure of the ISM. The gas therefore cannot escape, other than in the direction toward the back of the bow shock, as we described. In fact, the emission from M1-67 that we see in Fig. 3 is in H, which indicates that the gas is already ionised. Since we only consider the dynamics of the gas here, it is not important what exactly happens to the gas, as long as it does not affect its global motion.
For structure C in Fig. 11, roughly the same scenario holds as for structure B. It is very likely to be located on the bow shock surface. However, this structure it spread out much more and therefore it is hard to define its exact location. Furthermore, it is positioned at the southern cutoff limit of our velocity data. For these reasons, we do not discuss its dynamical properties here. We labelled it in Fig. 11 for completeness, because it is another feature that is clearly visible in the different datasets.


Although there are still large uncertainties in the rough calculations presented here, it seems very likely that the dynamical timescales of the freely expanding structure A and the shocked structure B do not match. The explanation that both structures originate from the same bipolar outburst, with an expansion velocity that is different in different directions seems unlikely, since the directions to these two structures as seen from the star do not differ too much. This means that the two features are likely to originate from different outburst events. This result strongly suggests a multiple-outburst scenario, with typical outburst timescales of a few times yr. This scenario favours an LBV phase rather than an RSG phase that is responsible for the nebula M1-67.
7 Summary and conclusions
We tried to fit different freely expanding models to the nebula M1-67 and find that M1-67 is not expanding freely, but that the outbursts that formed the nebula have been interacting with the ISM. Evidence for this is given by the fact that the nebula has a radial velocity that is lower than the radial velocity of the star, in particular the fact that there is no nebular emission with a significantly higher radial velocity than that of the star. The asymmetry in the amount of emission between the high-velocity and low-velocity sides of the nebula and the asymmetry in the velocity distribution of the nebula seem to confirm the fact that there are interactions between the outbursts and the ISM.
We find that the central star WR 124 has a velocity of about with respect to the surrounding ISM, moving roughly away from us, which causes a paraboloid-like bow shock around the star. Because the star is moving away from us, we are looking into the hollow bow shock from the rear. Using the simple assumption of momentum conservation, we can model the geometry of the bow shock and the velocity of the gas that is moving along its surface. This way we can roughly derive the orientation of the bow shock, which is determined by the spatial velocities of the star and that of the ISM surrounding it. The inclination of the main axis of the bow shock with respect to the line of sight is about , where the arrow that points from the star to the front of the bow shock is mainly pointed away from us and slightly to the south. This small inclination is responsible for the fact that we cannot distinguish the bow shock in the HST image in Fig. 3 and that we see the star projected in the centre of the nebula. The star sits inside this bow shock, at about 1.3 pc from its front. As input for our bow shock models, we used the observed properties of the stellar wind (, ) and assumed an ISM density of . These values obviously have quite some uncertainty in them. We therefore once more explicitly mention the rough nature of these calculations. The assumptions of a continuous wind and a homogeneous ISM for our models are very likely to be incorrect. In fact, an ISM with inhomogeneities could explain why the observed bow shock does not have a smooth surface.
In general, a run-away star with a wind will form a bow shock. The LBV eruptions during the late stages of the evolution of massive stars will partly collide with the bow shock surface, brighten up and be dragged away by the ram pressure of the ISM, along the surface of the bow shock. In this way, irregular, or even chaotic nebulae with arcs and rings can be formed by intrinsically nicely behaving, possibly even spherical, discrete outbursts. The interactions with the ISM make the derivation of dynamical timescales for the outbursts much more difficult than in the case of low-velocity stars, which blow voids of tens of parsecs in the interstellar medium during their O-star phase, so that outbursts occurring in a later stage will indeed expand freely. However, also in the case of a bow shock, a part of each outburst will move toward the rear end of this bow shock and remain expanding freely forever. This part might still be fitted in the straightforward way.
For M1-67 we were able to fit the freely expanding part of the outburst A in Fig. 11 to and , which gives the rough dynamical timescale of yr, assuming a distance of 6.5 kpc. This dynamical timescale is of the same order as the time it would take this outburst to cross the distance of pc from the star to the front of the bow shock, which means that the far part of this particular outburst might just have collided with the bow shock. In fact, the collision of this part of the nebula is required in order to explain the lack of nebular emission with significantly higher radial velocities than that of the star.
Part of the nebular emission is found to be on the bow shock surface. In order to get there, this matter could have followed different paths, because we do not know in which direction the material has been ejected from the star. We can calculate the amount of time for this matter to have reached its observed location, as a function of the path. We did so for the arc that is labelled B in Fig. 11, assuming that the expansion velocity was the same as for the freely expanding structure A, . We then find that the age of structure B must be greater than yr, probably in the order of yr, so that this arc most likely originates from a different outburst than structure A.
The multiple outbursts, the expansion velocity of about and the dynamical timescales in the order of yr are all typical for LBVs. We therefore conclude that an LBV phase preceded the current Wolf-Rayet phase. The outbursts that occurred during this LBV phase seem to be the most likely explanation for the creation of the Wolf-Rayet ring nebula M1-67 around WR 124.
Acknowledgements.
We thank Thierry le Fèvre for his contribution to the freely expanding wind models, Antonella Nota for the long-slit spectra and Yves Grosdidier for the Fabry-Pérot images.References
- Bertola (1964) Bertola, F. 1964, PASP, 76, 241+
- Burton (1988) Burton, W. B. 1988, in Galactic and Extragalactic Radio Astronomy, 295–358
- Canto et al. (1996) Canto, J., Raga, A. C., & Wilkin, F. P. 1996, ApJ, 469, 729+
- Chu & Treffers (1981) Chu, Y.-H. & Treffers, R. R. 1981, ApJ, 249, 586
- Grosdidier et al. (1998) Grosdidier, Y., Moffat, A. F. J., Joncas, G., & Acker, A. . 1998, ApJ, 506, L127
- Grosdidier et al. (1999) Grosdidier, Y., Moffat, A. F. J., Joncas, G., & Acker, A. 1999, in ASP Conf. Ser. 168: New Perspectives on the Interstellar Medium, 453+
- Lamers & Cassinelli (1999) Lamers, H. J. G. L. M. & Cassinelli, J. P. 1999, Introduction to stellar winds (Introduction to stellar winds / Henny J.G.L.M. Lamers and Joseph P. Cassinelli. Cambridge ; New York : Cambridge University Press, 1999. ISBN 0521593980)
- Lamers et al. (2001) Lamers, H. J. G. L. M., Nota, A., Panagia, N., Smith, L. J., & Langer, N. 2001, ApJ, 551, 764
- Langer et al. (1994) Langer, N., Hamann, W.-R., Lennon, M., et al. 1994, A&A, 290, 819
- Merrill (1938) Merrill, P. W. 1938, PASP, 50, 350+
- Mignard (2000) Mignard, F. 2000, A&A, 354, 522
- Minkowski (1946) Minkowski, R. 1946, PASP, 58, 305+
- Nota & Clampin (1997) Nota, A. & Clampin, M. 1997, in ASP Conf. Ser. 120: Luminous Blue Variables: Massive Stars in Transition, 303+
- Nugis & Lamers (2000) Nugis, T. & Lamers, H. J. G. L. M. 2000, A&A, 360, 227
- Pismis & Recillas-Cruz (1979) Pismis, P. & Recillas-Cruz, E. 1979, Revista Mexicana de Astronomia y Astrofisica, 4, 271
- Sirianni et al. (1998) Sirianni, M., Nota, A., Pasquali, A., & Clampin, M. 1998, A&A, 335, 1029
- Solf & Carsenty (1982) Solf, J. & Carsenty, U. 1982, A&A, 116, 54
- Stothers & Chin (1993) Stothers, R. B. & Chin, C. 1993, ApJ, 408, L85
- Stothers & Chin (1996) —. 1996, ApJ, 468, 842+