The nuclear accretion in the FR I radio
galaxy IC4296
from CHANDRA and VLBA observations
Abstract
A high angular resolution study of the nucleus of the FR I galaxy IC4296 using ACIS-S and VLBA observations is presented, with the aim of studying the nature of the accretion process. Pointlike and hard X-ray emission is found, well described by a moderately absorbed power law of ; no iron fluorescence line from cold material is detected. The 0.3–10 keV luminosity is erg s-1, that is times lower than the accretion luminosity resulting from the estimated Bondi mass accretion rate and a radiative efficiency of 10%. On the parsec scale a jet and a counter-jet extend out from a central unresolved “core” in the 8.4 GHz image. Their orientation is in good agreement with that of the large scale jets and their bulk speed is relativistic. The parsec scale spectrum is convex over 2–22 GHz. The observed nuclear luminosity is not likely to be reconciled with the accretion luminosity by assuming that Compton thick material surrounds the nucleus. Low radiative efficiency accretion flow models (ADAF and its variants) cannot account for the observed emission and spectral shape of the nucleus in the radio band. The power in the jets accounts for a sizable fraction (%) of the accretion luminosity; therefore the mass accretion rate needs not to be much different from the estimate obtained using Bondi’s theory. A jet dominated origin also for the observed radiative losses of the nucleus is suggested. This could also explain the finding that a nuclear luminosity orders of magnitude lower than that of “normal” radio loud AGNs is accompanied by a relatively higher radio emission.
1 Introduction
In recent years, increasing evidence has accumulated for a widespread presence of central dark objects, most likely massive black holes (MBHs), in nearby galaxies (Magorrian et al. 1998). A possible relationship between these galaxies and the relics of the “quasar era” has therefore been suggested (Richstone et al. 1998). Most nearby galaxies, though, exhibit little or no nuclear activity in the optical band (e.g., Kormendy and Ho 2000). Also, their MBHs appear to be starving. For example, early-type galaxies frequently host hot gaseous halos that, if accreting onto the central MBHs, should give rise to active nuclei with luminosities exceeding erg s-1 in standard accretion theories (Fabian and Canizares 1988; Di Matteo et al. 2001a). Instead, recent imaging of elliptical galaxies with a massive hot interstellar medium showed nuclear luminosities orders of magnitude lower than those expected from the estimated Bondi mass accretion rates, for a radiatively efficient accretion process (Loewenstein et al. 2001, Di Matteo et al. 2002). Therefore, the question arises of how accretion proceeds at the present time. This is also interesting in relation with the discovery of a number of hard X-ray sources associated with otherwise “normal” early-type galaxies in Deep surveys (Mushotzky et al. 2000, Fiore et al. 2000). These could give a non negligible contribution to the X-ray background (Barger et al. 2001).
In this paper the nature of accretion in the elliptical galaxy IC4296 is investigated, using ACIS-S and VLBA observations. This target is suitable for this study thanks to its proximity coupled with the presence of a hot gaseous halo, very weak signs of activity in the optical and an excess of hard X-ray emission over the expected contribution from stellar sources, suggested by previous observations (Sect. 2). The combination of sensitivity, angular resolution and spectral capabilities of ACIS-S allows us to determine whether the excess of hard X-ray emission is nuclear in origin and what its spectral properties and environmental conditions are. We also conducted milliarcsec resolution VLBA observations of the nuclear region to derive the radio emission properties on the parsec scale. The X-ray and radio results are jointly used to shed light on the accretion process.
In Sect. 2 we briefly describe the general properties of IC4296, in Sect. 3 we present the X-ray data analysis with particular emphasis on the nuclear emission, in Sect. 4 we present the results of the VLBA observations, and in Sect. 5 we discuss the implications of the observational results; in Sect. 6 our conclusions are summarized.
2 Target properties
IC4296 is a giant elliptical in the group of galaxies HG22 (Huchra and Geller 1982; Table 1), at a distance of 49 Mpc. Diffuse X-ray emission at a temperature of keV around IC4296 had been detected by the PSPC (Mulchaey et al. 1996). showed a soft thermal component (of keV and abundance close to solar at the best fit) coupled with a harder one, of roughly the same fluxes in the 0.5–2 keV band (Matsumoto et al. 1997). The soft component was better described by a cooling flow model rather than a single temperature model, according to Buote and Fabian (1998). The harder component was modeled as bremsstrahlung emission with a temperature ranging from 5 keV (Buote and Fabian 1998) to 10 keV (Matsushita et al. 2000), or as a power law with photon index (Sambruna et al. 1999). The latter authors also place an upper limit of 740 eV on the equivalent width of a 6.4 keV iron emission line. Matsumoto et al. (1997) noted that the ratio between the X-ray luminosity of the hard component and the optical luminosity of the galaxy was higher than the average value found for their sample of early-type galaxies. Finally, IC4296 was detected in the 5–10 keV band by the BeppoSAX High Energy Large Area Survey (Fiore et al. 2001).
In the optical band, the continuum spectrum is typical of early-type galaxies. No [O III] and weak [O II] emission lines were detected (Wills et al. 2002). A B–R color map shows large dust patches around the center (Colbert et al. 2001). The galaxy was detected by at 60 and 100 m with flux densities presumably coming from cool interstellar dust (Knapp et al. 1990).
IC4296 is also the optical counterpart of an extended FR I (Fanaroff and Riley 1974) radio galaxy, PKS 1333-33, whose total power is logP408MHz (W Hz-1) = 25.41 (Wright and Otrupcek 1990). VLA observations show a radio nucleus coincident with the optical one, on the arcsecond scale, and two radio jets, almost symmetric in brightness and extending in the sky for a total of 35′ (Killeen et al. 1986). A 2.3 GHz image obtained with the southern hemisphere Long Baseline Array at the resolution of a few tens of mas (i.e., a few parsecs) shows a marginally resolved source with a total flux density on this scale of mJy (Venturi et al. 2000). The radio spectral properties of the nucleus are presented in Sect. 4 together with the results of the high frequency VLBI observations conducted by us.
3 X-ray observation and data analysis
IC4296 was observed on 2001 December 15 with the ACIS-S camera (Garmire et al. 2002) on board the X-ray observatory (Weisskopf et al. 2000). The pointing placed the galaxy center in the S3 chip and the total exposure was 24,835 s. The 1/2 subarray mode was used, to avoid possible pile-up. The present data analysis was done with the analysis package CIAO v2.2.1 and followed the Data Analysis Threads111http://cxc.harvard.edu/ciao/documents_threads.html, using the updated calibration files as of August 2001. Level-2 event files were considered.
Background flares are often seen in BI chips (S1 and S3). Therefore we inspected the lightcurve of the exposed chip area after removal of point sources, in the 2.5–7 keV band (which is most sensitive to the most common flare species; Markevitch 2002). High background flares were not found and the average count rate per square arcsec is consistent with that in the blank field datasets (see the CIAO documents and http://cxc.harvard.edu/contrib/maxim/acisbg/). It is also times lower than that of a central circle of radius (which is the extraction region used for the spectral analysis of the nucleus, Sect. 3.2).
3.1 Image analysis
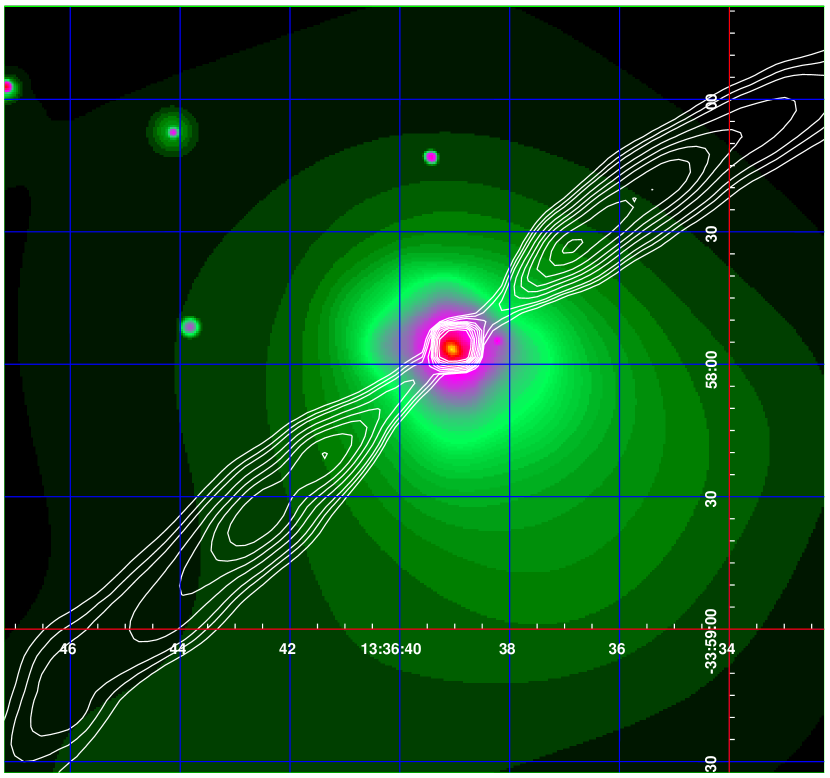
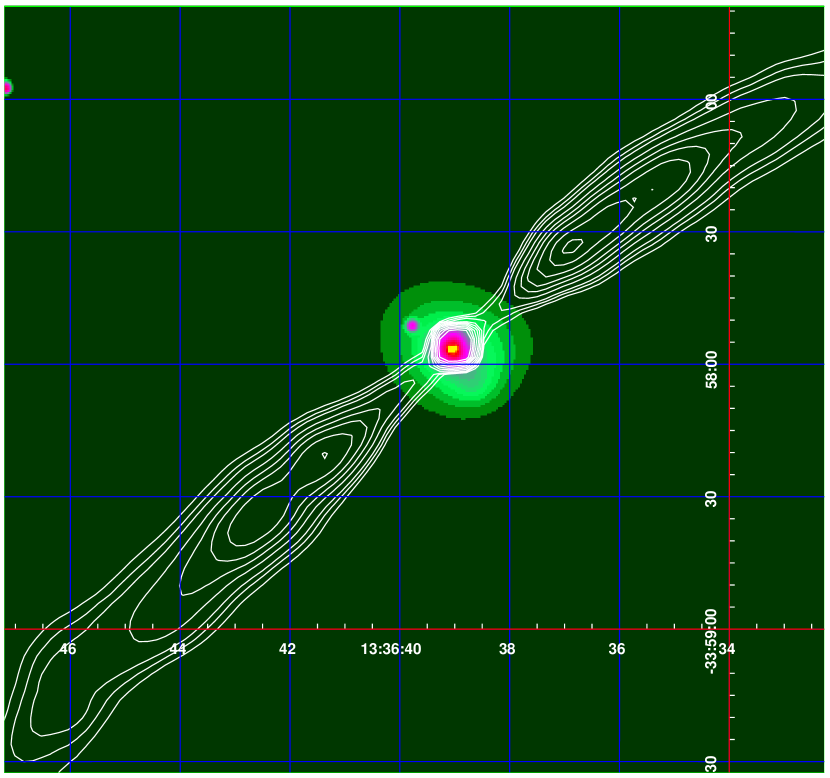
The adaptively smoothed images of the central region of IC4296 are shown in Figs. 1 and 2 for the 0.3–2 keV and 2–5 keV bands (the hard band has been restricted to 5 keV to limit the background contribution). These images were produced using the tool with the S/N ratio set to be between 2.5 and 5. Figs. 1 and 2 also show the radio morphology of the source derived from a VLA image obtained at 20 cm with a resolution of 3.2 arcsec (Killeen et al. 1986).
The nuclear region is very bright both in the soft and in the hard band. As can be judged also from the brightness profiles (Figs. 3 and 4), in the central few arcsec the soft band emission is much broader than that of the PSF, while an unresolved source dominates in the hard band. Diffuse hard emission appears only at radii larger than a few arcsec, and is likely to be accounted for by the unresolved X-ray binary population of the galaxy. Much of the soft emission in the central region likely comes from the ’cooling flow’ (Buote and Fabian 1998). From Fig. 1 the emission seems to be more elongated in the direction perpendicular to that of the radio jets and no enhancement is seen coincident with the jet positions. A more detailed study of the morphology of the emission over the whole chip area is in preparation.
A number of point sources are clearly detected; a study of the properties of the X-ray point source population in the field is also in preparation. A wavelet detection algorithm (the program in CIAO) locates the X-ray center of the galaxy at RA=13h36m39s.05, Dec=–33∘57′56′′.7, in good agreement with the position of the radio center (RA=13h36m39s.02, Dec=–33∘57′56′′.2 from the VLA image in Figs. 1 and 2).
3.2 Spectral Analysis of the Nucleus
The spectrum of the nuclear region was derived by extracting counts
from a central circle of radius (95% encircled
energy radius for 1.5 keV photons from a point source). The response
matrix and the effective area file were created using the mkrmf and
mkarf tools in the CIAO v.2.2.1 package with the N0002 (August 2001)
release of the response calibration files (FEF files). The effective
area file was corrected
to account for the quantum efficiency degradation of ACIS at low energies
222See http://cxc.harvard.edu/cal/Links/Acis/acis/Cal_prods/qeDeg/index.html and
http://www.astro.psu.edu/users/chartas/xcontdir/xcont.html..
Since the diffuse soft X-ray emission fills the entire S3 chip, the
background was estimated from the blank sky observations,
for the same detector region considered for the
nucleus. This background contributes less than a count to the total
spectrum, in the 2.5–7 keV band. In order to use the
statistics, the data were grouped to include at least 20 counts per
spectral bin. Events with energies below 0.3 keV were excluded, since
the spectral calibrations are more uncertain at the lowest energies,
while the spectrum does not have enough source counts to be included
in the analysis above keV. The results of the spectral
analysis are given in Table 2.
As expected, the spectrum is not well fitted by a single power law (this leaves residuals below 1 keV) or a single thermal component (this leaves residuals above 1 keV); in fact from the image analysis the nuclear emission appears embedded within diffuse soft emission (e.g., Fig. 1). An acceptable fit is obtained with two components: a power law with photon index , absorbed by a column density cm-2, and soft thermal emission of keV and (Figs. 5 and 6). The thermal emission could also be a little absorbed (Fig. 7). Some residuals appear between 0.7 and 1 keV in Fig. 5; these are possibly due to line emission not accounted for in a simple modeling of the thermal emission with a one temperature plasma. The 2–10 keV intrinsic luminosity of the hard component is erg s-1. Replacing the power law component with thermal bremsstrahlung produces a fit of the same quality; the best fit temperature is keV, with keV at 90% confidence level. A 6.4 keV (rest frame) Fe K emission line is not detected; the 90% confidence upper limit on the equivalent width of a narrow ( keV) line at this energy is 460 eV.
4 Radio observations
PKS 1333–33 was observed at milliarcsecond ( parsec) scale resolution with an array of 11 telescopes [the full VLBA (Very Long Baseline Array) and one VLA antenna] on 13 February 2001. The observations were carried out simultaneously at 8.4 GHz, 15 GHz and 22 GHz, cycling among the three frequencies in order to ensure a good u–v coverage. Given its low declination, the source was visible only for 5 hours, so the total on source time was 1.5 hr/. The standard data reduction and image analysis were carried out using the NRAO AIPS package. Details on the observations, including the restoring beam (FWHM) and noise level in the final images, are given in Table 3. Residual calibration errors are of the order of 4% at each frequency.
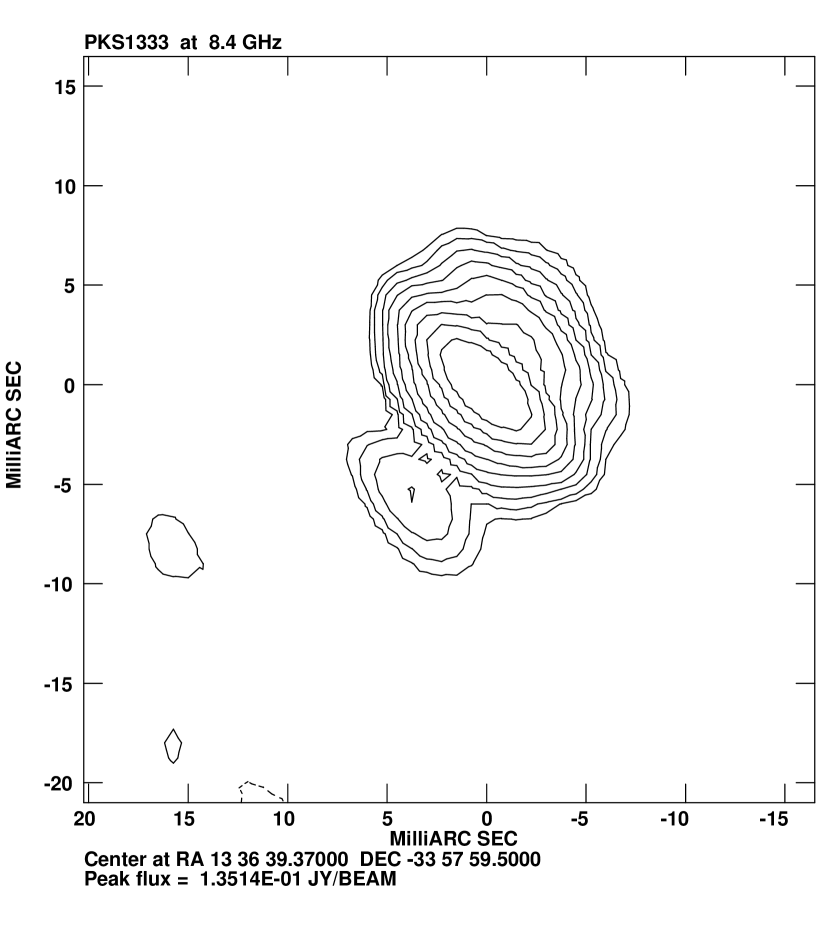
PKS 1333–33 is asymmetric on the parsec scale, as shown by the 8.4 GHz image in Fig. 8. At this frequency the source is characterised by a central component, containing a flux density of 155 mJy (% of the total on this scale), and two short jets. These are aligned with a position angle of ; the orientation of the parsec scale structure is in good agreement with that of the large scale one, where the two jets show an average position angle of (Killeen et al. 1986). The parsec scale jets extend out to 5 mas (1.2 pc) from the central peak. The northwestern jet is brighter and aligns with the brighter kiloparsec scale jet, as is usually found for low-to-intermediate luminosity radio galaxies (e.g., Giovannini et al. 2001). The source is unresolved at 15.4 GHz and 22.2 GHz.
4.1 Parsec scale jet velocity
If the asymmetric parsec scale morphology of PKS 1333–33 is attributed to Doppler boosting in an intrinsically symmetric source, we can constrain the viewing angle and the bulk speed () of the jet. At 1.2 pc from the peak, assumed to be the core of the radio emission, the jet-to-counterjet brightness ratio is , which implies . This relation leads to a maximum viewing angle , which is consistent with the viewing angle estimated on the basis of the core dominance (, Venturi et al. 2000). If we assume that actually , we obtain that the jet is relativistic on this scale, with a bulk speed . This value is in the range expected for a FR I radio galaxy (Giovannini et al. 2001).
4.2 The nuclear radio spectrum
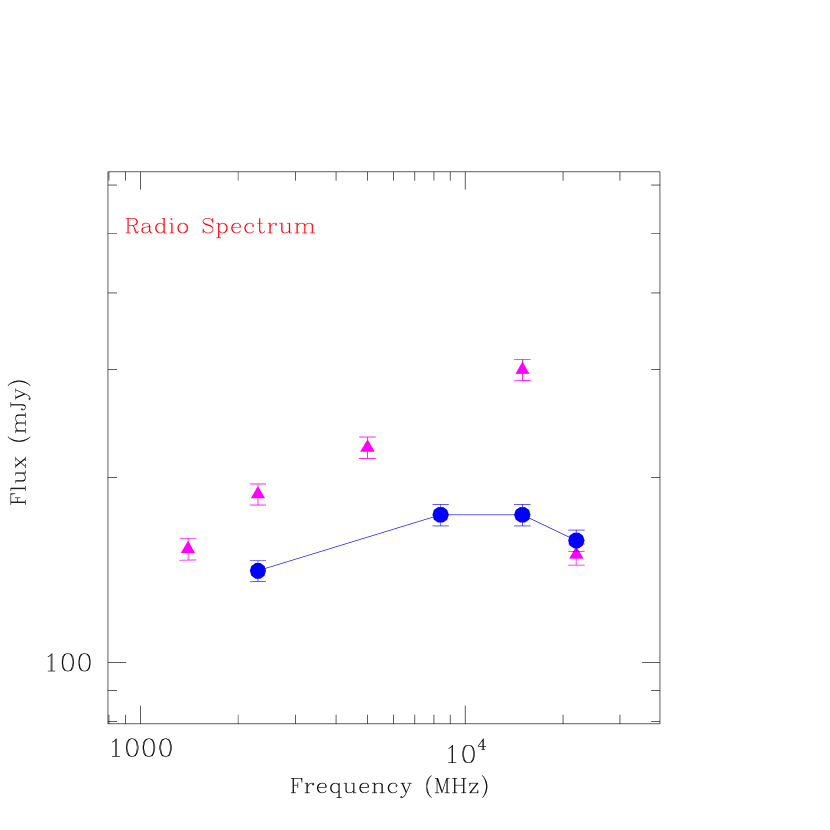
VLA observations show that the spectrum of the arcsecond (kiloparsec) scale nucleus is convex: it is self-absorbed for 5 GHz and peaks at GHz (Killeen et al. 1986; Morganti et al. 1997). The spectral index is for GHz and steepens dramatically after the turnover, with (). In Fig. 9 the radio spectrum of the kiloparsec scale nucleus is plotted, together with that of the parsec scale emission; the latter comes from the flux densities derived here (Table 3) and the 2.3 GHz data given in Venturi et al. (2000). The parsec scale spectrum is also convex: it is self absorbed up to GHz, with , and for GHz. From the parsec scale spectrum a 2–22 GHz luminosity of erg s-1 is derived.
There is a difference between the kiloparsec and parsec core flux densities, and this steadily increases from 2.3 GHz to 15 GHz (the ratio goes from 0.75 to 0.58). Given the long time gap between the kiloparsec scale observations and ours, flux density variability in the nucleus of PKS 1333–33 might at least in part be responsible for the discrepancy. However, the most likely explanation is the existence of extended flux density resolved out by our observations.
5 Discussion
The ACIS-S observation of IC4296 reveals pointlike and hard X-ray emission at the galaxy nucleus; this is well described by a moderately absorbed ( cm-2) power law of . Its 0.3–10 keV luminosity is erg s-1 (Table 2). The 2–22 GHz luminosity on the parsec scale is of the order of erg s-1 (Sect. 4.2). In the IR, only data whose angular resolution includes most of the galaxy body are available (Sect. 2); observations of the nucleus in the optical and UV bands are lacking. If we conservatively assume a ratio [the X-ray band has % of the bolometric luminosity in Seyfert 1’s, dropping to % in the most luminous quasars, Mushotzky et al. (1993)], then erg s-1. The correlation of MBH mass with central stellar velocity dispersion of the host galaxy (Merritt and Ferrarese 2001, Gebhardt et al. 2000) gives a black hole mass of M⊙ for the observed central stellar velocity dispersion of IC4296 (310 km s-1, Saglia et al. 1993). From the numbers above, an Eddington ratio of is derived for the nuclear emission of IC4296.
If a standard accretion disk is present, and the X-rays come from Comptonization in a hot corona as devised for brighter AGNs (Haardt and Maraschi 1991), this very sub-Eddington nuclear luminosity could be explained by Compton thick material surrounding the nucleus and heavily absorbing the X-ray emission. Then, similarly to what happens in Seyfert 2 galaxies, only residual scattered emission is seen and a strong 6.4 keV iron fluorescent line, of equivalent width keV, is predicted (as in NGC1068; e.g., Matt et al. 1997). This line has not been detected in the nucleus of IC4296 and the upper limit on its equivalent width is 460 eV (Sect. 3.2). The value intrinsic to IC4296 derived here is not very high ( cm-2) and consistent with that determined from a search for HI absorption intrinsic to the IC4296 nucleus with the ATCA (Morganti et al. 2001). The presence of moderate absorption and, though at a lower confidence level, the lack of a large equivalent width iron fluorescent line from cold material are not new for FR I’s nuclei: they have been found already in a few cases studied with (Hardcastle et al. 2002 and references therein; Chiaberge et al. 2002). The suggestion that thick tori are not present in FR I sources had also found support from observations of their optical nuclei (Chiaberge et al. 1999).
The low X-ray luminosity in presence of a supermassive black hole has therefore to be explained in alternative ways. One possibility is that the mass supply rate to the central MBH is low. Alternatively, a frequently suggested idea is that accretion occurs at low radiative efficiencies, as in an advection dominated accretion flow (ADAF) and its variants (e.g., Narayan 2002); this has been applied also to low luminosity AGNs, “normal” ellipticals, and FR I galaxies (e.g., Di Matteo et al. 2000, Di Matteo et al. 2001a). The other possibility would be that the central region of this galaxy is not in a steady state, as for example in feedback modulated accretion models (Binney and Tabor 1995, Ciotti and Ostriker 2001, Di Matteo et al. 2002). In these models the interstellar medium is heated by the impact of collimated outflows or by inverse Compton scattering of hard photons, which stop or decrease recursively the accretion on the central MBH. Which of the above options applies is investigated below with the help of our high resolution X-ray and radio observations.
5.1 Is the accretion rate low?
The mass supply rate for accretion onto a black hole is usually estimated adopting the Bondi accretion theory for spherical accretion (Bondi 1952). This requires the calculation of the density and temperature of the gas at “infinity” (in practice, near the accretion radius , defined as the point where the gravitational potential of the MBH begins to dominate the dynamics of the hot gas; , where is the sound speed). For IC4296, pc, corresponding to arcsec. With ACIS-S data we can therefore derive the gas distribution very close to the accretion radius.
The spectral analysis of a central radius region shows the presence of a hard component in addition to soft thermal emission from the surrounding hot gaseous halo. Therefore we modeled the central part of the 0.3–2 keV surface brightness profile (of radius, Fig. 3) as unresolved nuclear emission, with a shape following that of the PSF for 2 keV photons, plus a -model profile (). The -model flattens within , where the nuclear point source dominates, and has at the best fit. The number of counts within a radius of given by this profile decomposition for the unresolved nuclear emission and for the -model agrees with that resulting from the spectral analysis for the hard component and the soft thermal emission respectively. The gas density profile is derived by deprojection of the -model used for the decomposition of the surface brightness profile (e.g., Ettori 2000). Adopting the cooling function value for the hot gas temperature and abundance derived from the spectral analysis, the resulting central gas density is g cm-3. From the Bondi (1952) analysis, the mass accretion rate cannot exceed the value , with in the adiabatic case and the gas density at “infinity” [see eq. (19) of Bondi 1952]. The value yr-1 is then derived, when using the best fit gas temperature keV (Sect. 3.2). This corresponds to an accretion luminosity erg s-1, for a canonical radiative efficiency of 10%, as assumed in a standard, radiatively efficient thin accretion disk. Therefore, radiative losses from the nuclear region account for just % of . We must conclude that either accretion is indeed stationary but takes place with a low radiative efficiency (Sect. 5.2), and possibly there is another process into which a significant fraction of is channeled (Sect. 5.3), or the galaxy center is out of equilibrium and Bondi’s theory does not apply.
5.2 Is the radiative efficiency low?
We explore here the possibility that much of the energy in the accretion flow cannot be radiated and is carried through the event horizon of the MBH, as in an ADAF. The Eddington ratio of the nucleus of IC4296 lies well within the required value for ADAFs (). In these models the majority of the observable emission is in the X-ray and in the radio bands (e.g., Narayan 2002). In the X-rays it comes from thermal bremsstrahlung with a flat power law ( in the band) or inverse Compton scattering of soft synchrotron photons by the flow electrons (this produces a steeper X-ray spectral shape). In the radio band, synchrotron emission arises from the strong magnetic field in the inner parts of the accretion flow. The self-absorbed synchrotron spectrum rises up to high radio frequencies, above which it abruptly drops. If a wind develops from the inner regions the synchrotron emission in the radio band and the Compton emission in the X-ray band are drastically reduced.
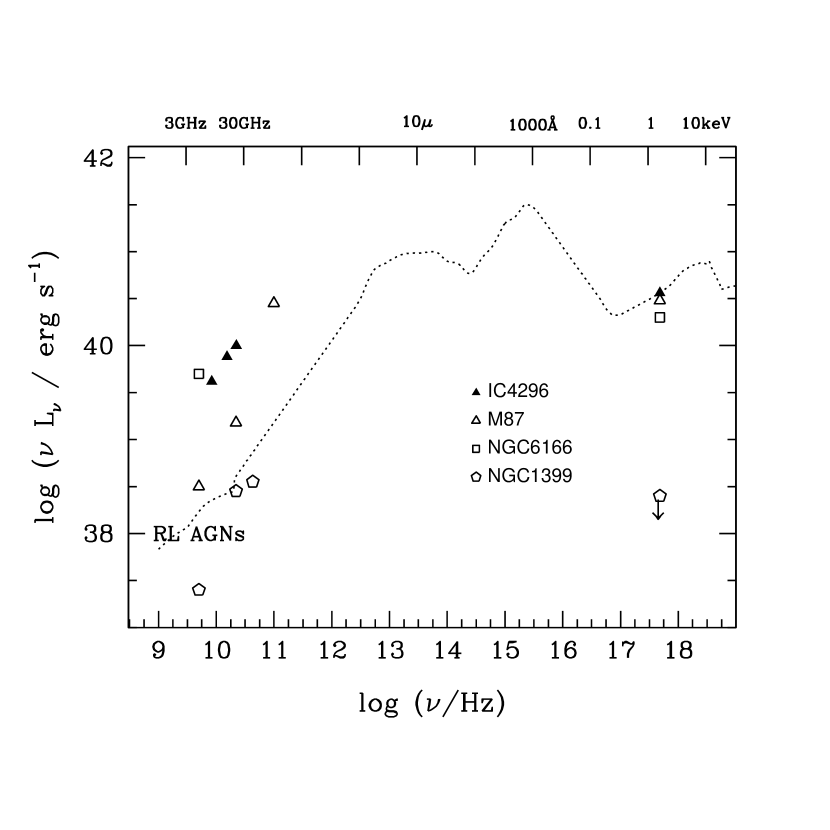
We can compare the case of IC4296 to those of NGC1399, NGC6166, M87, for which ADAF modeling has been attempted recently (Loewenstein et al. 2001; Di Matteo et al. 2001b, 2002). Like IC4296 these are low power (FR I type) radio galaxies all with nuclear X-ray luminosities times lower than the estimated accretion luminosity, as determined from observations. Pure inflow ADAFs accreting close to the Bondi rate with a low radiative efficiency have been constructed and compared to the overall spectral energy distribution. The models are normalized using the observed X-ray luminosities, while the two major parameters on which the predicted spectrum depends are the accretion rate and the MBH mass (e.g., Di Matteo et al. 2002). The parameters of NGC6166 are close to those of IC4296 ( yr-1 and ). A pure inflow ADAF for NGC6166 has 2 keV)22 GHz) (Di Matteo et al. 2001b), while this ratio is for IC4296 (Fig. 10). Therefore the X/radio luminosity ratio of the IC4296 nucleus is much lower than in this model. Note that the radio emission from an ADAF cannot be increased by appealing to variants including outflows or convection, because these suppress the radio emission with respect to the X-ray one (Quataert and Narayan 1999). Therefore the presence of an accretion flow with low radiative efficiency cannot be excluded, but most of the radio emission should come from another source. The same conclusion was reached also for NGC6166, due to its high VLBI emission (similar to that of IC4296, Fig. 10). In the case of M87, yr-1 and . Again it was found that pure inflow ADAFs can explain the observed X-ray emission, but the majority of the radio emission must be accounted for by a source different from the accretion flow (Di Matteo et al. 2002).
In addition to being too radio loud for ADAF models, the nucleus of IC4296 has also a different spectral shape in the radio band: while in pure inflow ADAFs the radio emission continues to rise at frequencies larger than 22 GHz, since the radio spectral index between 1–100 GHz is inverted with (Yi and Boughn 1999), the nucleus of IC4296 turns over after 15 GHz (Fig. 9). This turn over is shown also by NGC1399, whose radio emission peaks between GHz (this feature is visible in Fig. 10 if luminosities are divided by frequencies). This turn over is typical also of the nuclei of other few ellipticals, whose nuclear radio emission was best modeled by self absorbed synchrotron emission from small-scale jets (Di Matteo et al. 2001a).
5.3 Jet dominated energy budget
We examine here the possibility that energy is carried off in an outflow. In fact, two jets are visible on the parsec scale (Sect. 4). Does the jet power amount to a sizable fraction of the accretion luminosity estimated in Sect. 5.1?
The total energy flux carried by a jet can be estimated as , with being the jet radius, pressure, Lorentz factor, and velocity (e.g., Owen et al. 2000). We can derive the jet minimum power by inserting the minimum pressure derived specifically for the jets in IC4296: dyne cm-2 at a distance of , where the jet radius is and the jet velocity km s-1 (Killeen and Bicknell 1988). Then erg s-1, that is erg s-1 for two jets. Therefore . could be larger if the jet velocity at is higher, which depends on the age of the source (the canonical age of yrs has been assumed by Killeen and Bicknell, who leave open the possibility for the source to be younger). Given also that the calculation above gives the minimum power of the jets, and that plausibly the jets have spent energy (e.g., doing work against the interstellar medium) during their propagation from the nuclear region to a distance of , we consider safe to conclude that the power required by the jets at the parsec scale is % of . Therefore the mass supply rate to the MBH needs not to be much lower than .
A correlation has been found between jet kinetic power and narrow line luminosity for radio sources (Rawlings and Saunders 1991). When inserting the line luminosities observed for IC4296 [log(erg cm-2 s, log(erg cm-2 s, Wills et al. 2002], the resulting jet kinetic power is few erg s-1, similar to (but somewhat lower than) the value estimated above (see Sect. 6 for a caveat concerning possible underluminosity in line emission of the nucleus of IC4296).
Note that the jet could dump energy into the ISM and stifle the accretion in the innermost part, thus reducing the accretion rate with respect to , as described by Di Matteo et al. (2002) for the nucleus of M87. In that case the estimated decrease in the mass accretion rate is more than enough to relax the requirement for low radiative efficiency of the accreting gas.
5.3.1 Jet dominated nuclear emission
We suggest that a large fraction of the nuclear radiative losses are also due to the very inner jets. This seems reasonable for the parsec–scale radio emission: its spectral shape (Sect. 4.2) can be explained with nonthermal synchrotron emission from the base of a self-absorbed jet, as is typical of jet models for powerful AGNs (e.g., Zensus 1997). A jet origin for the nuclear X-ray emission is consistent with its spectral shape of a power law, similar to that found in the radio band ( in the X-rays and for GHz). If we extrapolate the optically thin part of the radio synchrotron spectrum of IC4296 to the X-ray band, we obtain an X-ray emission much higher than observed. Therefore, in a jet dominated model the spectral index should steepen between the radio and X-ray frequencies and inverse Compton processes (such as synchrotron self-Compton) should account for the X-ray emission. For example, a jet dominated model has been elaborated recently to explain the spectral energy distribution of low luminosity AGNs (i.e., sources with few erg s-1; see, e.g., Yuan et al. 2002 for the modeling of NGC4258 and Fabbiano et al. 2002 for that of IC1459). In this model the X-ray spectrum is produced by self-Comptonized emission of the radio jet plus an extrapolation of the radio synchrotron emission. IC1459 is, similarly to IC4296, a bright radio elliptical with a nuclear X-ray emission times lower than the estimated accretion luminosity, from a pointing (Fabbiano et al. 2002). In the model elaborated for its nucleus, the jets are by far the dominant sink of power: they carry times the energy that is radiated by the nucleus in the X-ray band, as kinetic and internal energy.
Previous studies of low power radio galaxies with and showed a correlation between the X-ray luminosity of a nuclear unresolved component and that of the radio core, giving support to a jet-related origin for at least some of the nuclear X-ray emission (Fabbiano et al. 1984, Canosa et al. 1999). The few observations of FR I sources performed so far reveal the presence of a nuclear power law component of at the best fit, consistent with both an inverse-Compton and a synchrotron origin for the X-ray emission (e.g., Hardcastle et al. 2002 and references therein). A synchrotron origin has been suggested also for the nuclear emission of FR I sources in the optical band, since images revealed a correlation between the nuclear optical luminosity and that of the radio cores (Chiaberge et al. 1999).
6 Conclusions and final remarks
ACIS-S and VLBA observations of the nucleus of the FR I galaxy IC4296 have been analyzed, with the aim of studying the nuclear accretion process. The following results have been obtained:
hard and pointlike emission has been detected at the galaxy center, that can be described by a power law of , only moderately obscured ( cm-2), with 2–10 keV luminosity of erg s-1. A 6.4 keV (rest frame) emission line is not detected and the upper limit on its equivalent width is 460 eV. The bolometric luminosity of this unresolved source is of the Eddington luminosity for a MBH (that is supposed to be present at the center of IC4296).
the nuclear region is also bright in the soft band, with a radial profile much broader than that of the PSF. Most of this soft emission comes from hot gas at a temperature of keV and solar abundance (in a simple modeling with a one temperature plasma).
the 8.4 GHz image shows on the parsec scale a jet and a counter-jet extending out from a central unresolved “core”, with an orientation that is in good agreement with that of the large scale jets. The northwestern jet is brighter; from Doppler boosting in an intrinsically symmetric source, we constrain the jet viewing angle and the bulk speed, which turns out to be relativistic (). Both are found in the range expected for a FR I radio galaxy.
the parsec scale spectrum is convex: it is self absorbed up to GHz, with spectral index , and it has for GHz. On this scale the radio luminosity is erg s-1.
Compton thick material surrounding the nucleus is not likely to explain the very sub-Eddington nuclear luminosity observed, because a strong 6.4 keV iron fluorescent line has not been detected. The moderate value of the hydrogen column density intrinsic to IC4296 derived here is consistent with that determined from a search for nuclear HI absorption with the ATCA.
the mass accretion rate close to the accretion radius has been derived using Bondi’s spherical accretion formula. This is yr-1 and corresponds to an accretion luminosity of erg s-1 for a radiative efficiency of 10%, as assumed in a standard, radiatively efficient thin accretion disk. Therefore, radiation losses from the nucleus account for % of this estimate of the accretion luminosity.
the high radio/X luminosity ratio and the spectral shape in the radio band resulting from our observations are not consistent with the predictions of accretion flow models with low radiative efficiency as ADAFs and their variants. These flows cannot be the only component of the system.
the large scale radio jets require a power input that is a significant fraction %) of the estimated accretion luminosity. Therefore it is likely that a power comparable to this luminosity is channeled into the nuclear jets observed on the VLBA scale, that are the base of the large scale jets. The mass accretion rate needs not to be much different from the estimate obtained using Bondi’s theory.
the alternative possibility to account for a discrepancy between the accretion luminosity and the observed power output would be that the system is out of equilibrium, therefore Bondi’s theory does not apply. This is the case described by feedback modulated accretion flow models where the central engine undergoes on-off activity cycles.
it is suggested that the radiative losses from the nucleus are also jet dominated. The radio emission can be ascribed to synchrotron emission from the base of a self-absorbed jet and the X-ray emission may have a synchrotron self-Compton origin.
nuclear luminosities orders of magnitude lower than the estimated accretion luminosity and the likely absence of an obscuring torus have been found recently in a few other FR I’s nuclei observed with and with .
The results above suggest some final considerations. This nucleus is orders of magnitude less luminous than that of “normal” radio loud AGNs, but is relatively more powerful in the radio band, as revealed by the comparison of the respective spectral energy distributions (Fig. 10). If we assume that the nuclear radio luminosity of IC4296 is jet dominated, then this finding could be the result of a larger importance of the jet in the nuclear radiation losses. In addition, bright AGNs follow correlations between nuclear X-ray luminosity and emission line luminosities, which are explained by photoionization of the gas surrounding the nucleus. Is this source as efficient as bright AGNs in producing line emission? In the extension to low luminosities of the correlation between [OIII] line emission and keV for radio loud AGNs (Sambruna et al. 1999), the nucleus of IC4296 turns out to be underluminous in [OIII] for the 2–10 keV luminosity measured here. The power required to sustain the jets in IC4296 could then be underestimated using the Rawlings and Saunders (1991) relation, as done in Sect. 5.3. In conclusion, there is clear evidence that in IC4296 the central engine works in a different way than in radio loud AGNs.
References
- (1)
- (2) Barger, A.J., Cowie, L.L., Mushotzky, R.F., Richards, E.A. 2001, AJ, 121, 662
- (3)
- (4) Binney, J.J., Tabor, G. 1995, MNRAS, 276, 663
- (5)
- (6) Bondi, H. 1952, MNRAS, 112, 195
- (7)
- (8) Buote, D.A., Fabian, A.C. 1998, MNRAS, 296, 977
- (9)
- (10) Canosa, C.M., Worrall, D.M., Hardcastle, M.J., Birkinshaw, M. 1999, MNRAS, 310, 30
- (11)
- (12) Chiaberge, M., Capetti, A., Celotti, A. 1999, A&A, 349, 77
- (13)
- (14) Chiaberge, M., Gilli, R., Macchetto, F.D., Sparks, W.B., Capetti, A. 2002, ApJ, in press (astro-ph/0205156v2)
- (15)
- (16) Ciotti, L., Ostriker, J.P. 2001, ApJ, 551, 131
- (17)
- (18) Colbert, J.W., Mulchaey, J.S., Zabludoff, A.I. 2001, AJ, 121, 808
- (19)
- (20) de Vaucouleurs, G., de Vaucouleurs, A., Corwin, H.G., Jr., Buta, R.J., Paturel, G., Fouque, P. 1991, Third Reference Catalogue of Bright Galaxies
- (21)
- (22) Di Matteo, T., Carilli, C.L., Fabian, A.C. 2001a, ApJ, 547, 731
- (23)
- (24) Di Matteo, T., Johnstone, R.M., Allen, S.W., Fabian, A.C. 2001b, ApJ, 550, L19
- (25)
- (26) Di Matteo, T., Allen, S.W., Fabian, A.C., Wilson, A.S., Young, A.J. 2002, astro-ph/0202238
- (27)
- (28) Ettori, S. 2000, MNRAS, 311, 313
- (29)
- (30) Fabbiano, G., Trinchieri, G., Elvis, M., Miller, L., Longair, M. 1984, ApJ, 277, 115
- (31)
- (32) Fabbiano, G., et al. 2002, submitted to ApJ
- (33)
- (34) Fabian, A.C., Canizares, C.R. 1988, Nature, 333, 829
- (35)
- (36) Fanaroff, B.L., Riley, J.M., 1974, MNRAS, 167, 31
- (37)
- (38) Fiore, F., et al. 2000, New Astronomy, 5, 143
- (39)
- (40) Fiore F., et al. 2001, MNRAS, 327, 771
- (41)
- (42) Gebhardt, K., et al. 2000, ApJ, 539, 13
- (43)
- (44) Garmire, G.P., Bautz, M.W., Ford, P.G., Nousek, J.A., Ricker, G.R. 2002, Proc. SPIE, 4851, in press
- (45)
- (46) Giovannini G., Cotton W.D., Feretti L., Lara L., Venturi T., 2001, ApJ, 553, 508
- (47)
- (48) Haardt, F., Maraschi, L. 1991, ApJ, 380, L51
- (49)
- (50) Hardcastle, M.J., Worrall, D.M., Birkinshaw, M., Laing, R.A., Bridle, A.H. 2002, MNRAS, 334, 182
- (51)
- (52) Huchra, J.P., Geller, M.J. 1982, ApJ, 257, 423
- (53)
- (54) Killeen, N.E.B., Bicknell, G.V., Ekers, R.D., 1986, ApJ, 302, 306
- (55)
- (56) Killeen, N.E.B., Bicknell, G.V. 1988, ApJ, 324, 198
- (57)
- (58) Knapp, G.R., Bies, W.E., van Gorkom, J.H. 1990, AJ, 99, 476
- (59)
- (60) Kormendy, J., Ho, L.C. 2000, astro-ph/0003268
- (61)
- (62) Loewenstein, M., Mushotzky, R.F., Angelini, L., Arnaud, K.A., Quataert, E. 2001, ApJ, 555, 21
- (63)
- (64) Magorrian, J., et al. 1998, AJ, 115, 2285
- (65)
- (66) Markevitch, M. 2002, astro-ph/0205333
- (67)
- (68) Matsumoto, H., Koyama, K., Awaki, H., Tsuru, T., Loewenstein, M., Matsushita, K. 1997, ApJ, 482, 133
- (69)
- (70) Matsushita, K., Ohashi, T., Makishima, K. 2000, PASJ, 52, 685
- (71)
- (72) Matt, G., et al. 1997, A&A, 325, L13
- (73)
- (74) Mei, S., Silva, D., Quinn, P.J. 2000, A&A, 361, 68
- (75)
- (76) Merritt, D., Ferrarese, L. 2001, ApJ, 547, 140
- (77)
- (78) Morganti R., Oosterloo T.A., Reynolds J.E., Tadhunter C.N., Migenes V., 1997, MNRAS, 284, 541
- (79)
- (80) Morganti, R., Oosterloo, T.A., Tadhunter, C.N., van Moorsel, G., Killeen, N., Wills, K.A. 2001, MNRAS, 323, 331
- (81)
- (82) Mulchaey, J., Davis, D.S., Mushotzky, R.F., Burstein, D. 1996, ApJ, 456, 80
- (83)
- (84) Mushotzky, R.F., Cowie, L.L., Barger, A.J., Arnaud, K.A. 2000, Nature, 404, 459
- (85)
- (86) Mushotzky, R.F., Done, C., Pounds, K.A. 1993, ARA&A, 31, 717
- (87)
- (88) Narayan R., 2002, astro-ph/0201260
- (89)
- (90) Owen, F.N., Eilek, J.A., Kassim, N.E. 2000, ApJ, 543, 611
- (91)
- (92) Quataert, E., Narayan, R. 1999, ApJ, 520, 298
- (93)
- (94) Rawlings, S., Saunders, R. 1991, Nature, 349, 138
- (95)
- (96) Richstone, D., et al. 1998, Nature, 395, 14
- (97)
- (98) Saglia, R.P., et al. 1993, ApJ, 403, 567
- (99)
- (100) Sambruna, R.M., Eracleous, M., Mushotzky, R.F. 1999, ApJ, 526, 60
- (101)
- (102) Smith J.R., Lucey J.R., Hudson M.J., Schlegel D.J., Davies R.L. 2000, MNRAS, 313, 469
- (103)
- (104) Stark, A.A, Gammie, C.F., Wilson, R.W., Bally, J., Linke, R.A., Heiles, C., Hurwitz, M. 1992, ApJS, 79, 77
- (105)
- (106) Venturi T., Morganti R., Tzioumis T., Reynolds J.E., 2000, A&A, 363, 84
- (107)
- (108) Weisskopf, M.C., Tananbaum, H.D., Van Speybroeck, L.P., O’Dell, S.L. 2000, SPIE, 4012, 28
- (109)
- (110) Wills, K.A., Morganti, R., Tadhunter, C.N., Robinson, T.G., Villar-Martin, M. 2002, submitted to MNRAS
- (111)
- (112) Wright A., Outrpcek R., 1990, Parkes Catalogue, Australia Telescope National Facility
- (113)
- (114) Yi, I., Boughn, S.P. 1999, ApJ, 515, 576
- (115)
- (116) Yuan, F., Markoff, S., Falcke, H., Biermann, P.L. 2002, A&A, 391, 139
- (117)
- (118) Zensus, J.A. 1997, ARA&A, 35, 607
- (119)
| Type | RAaaFrom de Vaucouleurs et al. (1991). is the effective radius. | DecaaFrom de Vaucouleurs et al. (1991). is the effective radius. | zbbThe redshift z is from Smith et al. (2000). D is the distance derived with the surface brightness fluctuations method (Mei, Silva & Quinn 2000). | DbbThe redshift z is from Smith et al. (2000). D is the distance derived with the surface brightness fluctuations method (Mei, Silva & Quinn 2000). | aaFrom de Vaucouleurs et al. (1991). is the effective radius. | aaFrom de Vaucouleurs et al. (1991). is the effective radius. | Log | ccFrom Stark et al. (1992). |
| (J2000) | J(2000) | (Mpc) | (arcsec) | (mag) | () | (cm-2) | ||
| E0 | 13h36m39s.37 | -33∘57′59′′ | 0.012465 | 49 | 41 | 11.42 | 11.0 |
| pow : | |
|---|---|
| cm-2) | 1.1 (0.6–1.9) |
| 1.48 (1.14–1.90) | |
| F0.3-2keV(erg cm-2 s-1) | 4.5 |
| F2-10keV(erg cm-2 s-1) | 5.1 |
| L0.3-2keV( erg s-1) | 7.7 |
| L2-10keV( erg s-1) | 15.9 |
| mekal : | |
| cm-2) | 0.06 (0.01–0.15) |
| (keV) | 0.56 (0.53–0.59) |
| 1.0 () | |
| F0.3-2keV (erg cm-2 s-1) | 1.7 |
| F2-10keV (erg cm-2 s-1) | 3.8 |
| L0.3-2keV( erg s-1) | 7.5 |
| L2-10keV( erg s-1) | 0.1 |
| Freq. | FWHM | rms | Stot |
|---|---|---|---|
| GHz | mas, p.a. | mJy/b | mJy |
| 8.4 | 5.02.0, 45∘ | 0.068 | 173.5 |
| 15.4 | 5.21.3, | 0.25 | 174.0 |
| 22.2 | 5.02.0, 0∘ | 1.4 | 157.9 |