Radio asymmetry in 3C99
The N-galaxy 3C99, a Compact Steep-spectrum Source showing a triple asymmetric structure, has been observed with several arrays of radio telescopes at sub-arcsecond resolution. New images from MERLIN, European VLBI Network and the Very Long Baseline Array show that the source components detected in the central region of 3C99 have steep spectral indices, making it difficult to determine which of them is the core. The asymmetric radio structure of 3C99 is explained using the Scheuer-Baldwin continuous streaming model with a rather large difference in the interstellar medium density on the two sides of the central region. The age of 3C99 has been estimated; the source is found younger than years.
Key Words.:
Compact Steep-spectrum Sources: general; individual: 3C991 Introduction
1.1 Radio properties of 3C 99
The radio source 3C99 (0358004) is a powerful, Watt/Hertz at 408 MHz N-galaxy at a redshift 0.426. On the arcsecond scale, imaged with the VLA and MERLIN, it shows a triple asymmetric structure (Mantovani et al. 1990, 1997). The outer components are located rather asymmetrically relative to the nuclear region and show quite different luminosities and surface brightness. Along the major axis, 3C99 has an angular size of 6 arcsec and a linear size of 21 kpc ( Km sec-1 Mpc-1; q) almost fitting the selection criteria to be classified as Compact Steep-spectrum Source (CSS; see Fanti et al. 1995). The VLA images (Mantovani et al. 1997) show that 3C 99 has a rather asymmetric structure, with 4.9% and 9.5% of polarized emission at 5 GHz and 8.4 GHz respectively. The polarized emission comes mainly from the bright hot spot 0.8 arcsec North-East to the central component. The jet region (i.e. the region between these two components) is also slightly polarized, with the electric vector perpendicular to the jet axis. In the hot spot region, a depolarization ratio of 0.52 between 8.4 GHz and 5 GHz is seen. The position angle of the electric vectors is the same to within the errors at the two frequencies, although there are ambiguities.
The source 3C 99 was observed with the European VLBI Network plus Green Bank and Haystack in 1984 at 18cm (Mantovani et al. 1990), with an angular resolution of 113 mas along a PA of 169∘. The central component was resolved into several components of emission and shows a distorted structure. A compact feature was also detected in the hot spot, at 0.8 arcsec from the central component.
1.2 IR, Optical and X-ray properties of 3C 99
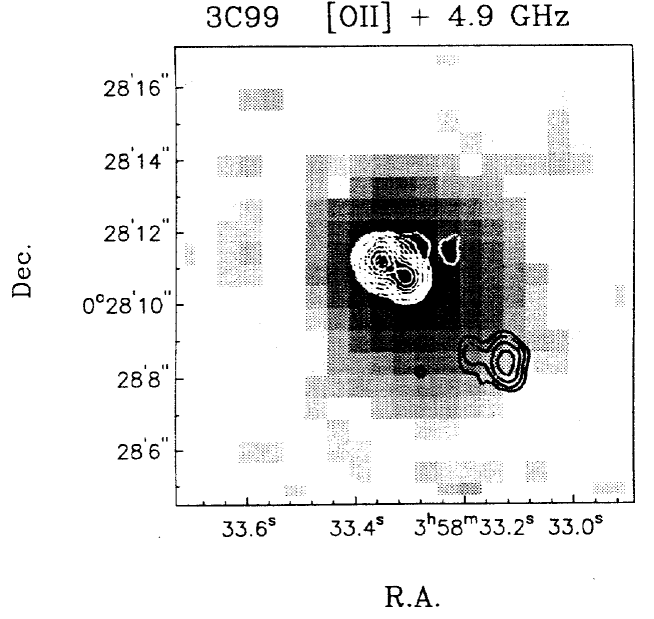
The N-galaxy associated with 3C 99 (Spinrad et al. 1985) lies close to the central radio component labelled in Mantovani et al. (1990), which is expected to contain the nucleus of the source. Observations with the IDS spectrograph of the Isaac Newton Telescope with the slit of the spectrograph aligned along the radio source major axis, have shown strong [OIII] emission and weak Hβ. The [OIII] emission extends 1 arcsecond above and below the nuclear region, with a higher redshift in the South-West direction, suggesting that thermal plasma in the North-East region is moving towards the observer, with (Mantovani et al. 1990). 3C 99 has been observed again in 1993 with the ESO 2.2 metre telescope. The spectrum shows only narrow Hα and Hβ lines. While most of the N-galaxies are actually classified BLRG, 3C 99 is classified as a NLRG (Hes et al. 1996). Of particular interest is the superposition of the [OII]3727 distribution, from which the continuum has been subtracted (Hes, PhD Thesis, University of Groningen, 1996), on the VLA A-array image at 4.9 GHz (Mantovani et al., 1990). The [OII] nebular emission is about 7 arcsec in extent, roughly centered on the nuclear radio region. The image shows that the north–east radio components are completely embedded in the gas, while the south–west components are mostly outside the emitting gas (see Fig. 1). Hes et al. (1996) also suggest that the emission lines are due to photoionization by the central source and that, if the B-model is adopted for photoionization, it is possible to infer from the Hβ luminosity an electron density n cm-3 with a filling factor .
N-galaxies are occasionally much brighter at 25 m (van Bemmel & Barthel 2001). The high IR luminosity would classify 3C 99 as an unusually FIR-bright AGN. In addition certain CSS radio galaxies tend to be unusually FIR luminous (Hes et al. 1995), although this has not been found for the population as a whole (Fanti et al. 2000). On the other hand the X-ray luminosity is rather faint; it was not detected by ROSAT (L ergs-1; Crawford and Fabian 1996). Together with the absence of broad lines, this seems to exclude a quasar classification. Table 1 summarizes the observed properties of 3C 99 at the various wavelengths.
| Optical Class | N-galaxy |
|---|---|
| Red-shift | 0.426 |
| Radio Class | CSS |
| Angular size | 6 arcsec |
| Linear size | 21 kpc |
| Polarization % S5GHz | 4.9 |
| Polarization % S8.4GHz | 9.5 |
| Radio Luminosity (408 MHz) | 1028 Watts/Hz |
| IR Luminosity (60 m) | 1045.4 ergs/sec |
| X Luminosity | 1043 ergs/sec |
1.3 The present paper
It has been suggested that the strong IR emission found in N-galaxies is mainly due to the interstellar medium (Hes et al. 1995), which in the case of CSSs sources might also be responsible for the radio plasma confinement. The asymmetry cannot be due to relativistic effects only, because the closer lobe is also the brighter one, and the enhanced emission in the northern lobe is also probably caused by a denser interstellar medium. We have carefully investigated the structure of 3C 99 with high resolution interferometric polarization observations. Polarization observations could be a sensitive probe of the effects of compression or shocks on the structure of the magnetic field.
In the following we will present observations done with the MERLIN and the European VLBI Network 111The European VLBI Network is a joint facility of European and Chinese radio astronomy institutes funded by their national research Councils at 5 GHz, and with the VLBA 222The Very Long Baseline Array and the Very Large Array are facilities of the National Radio Astronomy Observatory, USA, operated by Associated Universities Inc., under cooperative agreement with the National Science Foundation. at 1.6 GHz and at 5 GHz.
2 Observations and data analysis
The observations of 3C 99 are summarized in Table 2. The content of Table 2 is as follows: column 1, array name; column 2, observing stations; column 3, observing date; column 4, observing frequency; columns 5, 6 and 7, beam major axis, minor axis and position angle respectively; column 8, total intensity rms noise; column 9, polarized intensity rms noise.
| Array | Stationsa | Date | Freq. | Beam | ||||
|---|---|---|---|---|---|---|---|---|
| MHz | mas | mas | deg | mJy/beam | mJy/beam | |||
| EVN | Ef,Mc,Nt,On-60,Jb-2,Wb | 1990.87 | 4975 | 7.1 | 4.4 | 65 | 0.15 | |
| EVN | Ef,Mc,Nt,On-60,Jb-2,Wb,Sm | 1995.38 | 4975 | 8.4 | 4.5 | 37 | 0.16 | |
| MERLIN | All | 1995.38 | 4994 | 62 | 54 | 33 | 0.3 | |
| MERLIN-Cm | All–Cm | 1995.38 | 4994 | 100 | 100 | 0.5 | 0.5 | |
| VLBA | All–Sc+VLA1 | 1998.74 | 1655 | 17.5 | 4.9 | –21 | 0.9 | 0.2 |
| VLBA | All–Sc+VLA1 | 1998.74 | 4619 | 5.6 | 2.0 | –18 | 0.2 | 0.3 |
| a: The station labels listed are as follows: Ef = Effelsberg (D) 100-m, Mc = Medicina (I) 32-m, | ||||||||
| Nt = Noto (I) 32-m, On-60 = Onsala (S) 20-m, Jb-2 = Jodrell Bank (UK) 25-m, Cm = Cambridge (UK) 32-m, | ||||||||
| Wb = Westerbork array (NL) n25-m, Simeiz (Ukraine) 22-m; VLBA: Sc = St. Croix. | ||||||||
2.1 MERLIN observations
In 1995.38 the source was observed by the EVN+MERLIN array. In order to calibrate the MERLIN data set, initial values for the telescope and correlator gains were determined from a short observation of a bright, unresolved calibration source. The primary calibrator 3C286 was included during the observations in order to fix the position angle of the electric vector. The absolute flux density was scaled assuming a flux density of 2325.6 mJy for OQ208. The source DA193 was used to calculate the leakage term. Images from the MERLIN LHC total intensity and polarization data, the latter without the Cambridge data due to the limits in bandwidth of the radio link, were produced using and shown in Figs 2 and 3 respectively.


The images in Fig.s 2,3 show that the core region (component ) and the North-East hot-spot (component ) are connected by a long, straight, collimated jet. The jet bends and slightly increases in transverse size before reaching the hot-spot region, which is resolved into a triple hot-spot. Component is point-like at this resolution and is not polarized. The first knot along the jet is in fact polarized %, while in the remaining part of the jet, the polarization, if any, is below the detection limit. The region shows % polarized flux density in total. In the south–west region, the weak and extended emission seen with the VLA observations (Mantovani et al., 1990, 1997 and Fig. 1), was not detected by MERLIN.
Mantovani et al. (1997) using VLA observations measured a strong depolarization (0.52) between 8.4 GHz and 5 GHz and no indication of Faraday Rotation of the electric vector. Comparing the MERLIN image with the VLA images a similar percentage of polarized flux density is found at 5 GHz for the component A, confirming the depolarization between 8.4 GHz and 5 GHz. In the MERLIN image, the mean electric vector position angles around the peak of polarized emission are deg in agreement with previous results.
2.2 VLBA observations
The source was observed with 9 VLBA antennas (all but Saint Croix) and 1 VLA antenna for about 10 hours, switching between 1.6 GHz and 5 GHz. We made use of four 8 MHz bands at each frequencies centered at 1651.49, 1659.49, 1667.49 and 1675.49; and 4615.49, 4653.49, 4850.49, 5090.49 respectively. The target source was observed together with the calibrator sources BL Lac, 3C84, 3C138 and OJ287. The data have been analyzed using . The data have been calibrated in amplitude and phase, the LHC-RHC delay difference and the instrumental polarization have been corrected by fringe fitting a segment of the cross-hand data from a strong calibrator (3C 84).
The two data sets were then averaged in frequency over the four IF channels for a total observing bandwidth of 32 MHz. The images obtained at 1.6 GHz are shown in Fig. 4 and Fig. 5. The latter figure is a closeup of the central region of 3C99. The hot-spot region has been resolved into three components which appear resolved and off–axis by with respect to the central region, as also apparent in the MERLIN map.
The central region shows two bright and two weak outer components. At 5 GHz we detected the central component only, which is dominated by the two bright components seen at 1.6 GHz. A similar image is seen at 4.6 GHz in Fig. 6 where they appear extended due to the better resolution. Again the structure is dominated by two bright blobs. It is worth noting that none of the components of Fig. 5 is point–like.
No polarized emission was detected, at the two frequencies, 1.6 GHz and 5 GHz above the rms noise of 0.2 mJy/beam and 0.3 mJy/beam respectively.


2.3 EVN observations
The two EVN observations at 5 GHz were done recording in MarkIII Mode A (56 MHz bandwidth; date 1990.87) and recording in MarkIII Mode B (28 MHz bandwidth; date 1995.38). The data were processed at the Max-Planck-Institut für Radioastronomie Correlator in Bonn. The correlator output was calibrated in amplitude and phase using 333 is the NRAO’s Astronomical Image Processing System and imaged using DIFMAP 444DIFMAP is part of the Caltech VLBI software Package (Shepherd et al. 1995). Total power measurements and gain-curve of the telescopes, were applied in the amplitude calibration process. The self-calibration procedure, which uses closure amplitudes to determine telescope amplitude corrections, gave calibration factors that were within 10% of unity for all the telescopes.


The two images from the two observing sessions are shown in Fig. 7 and Fig. 8 respectively. They look very similar in structure, size and flux density despite almost five years between the two observations. We see two resolved, elongated components, aligned with the source major axis in PA, of almost equal flux density. The properties of 3C 99, from the EVN and the VLBA observations are given in Table 3.
| Array | Date | Freq. | Beam | Comp. | Major | Minor | PA | ||||
|---|---|---|---|---|---|---|---|---|---|---|---|
| MHz | mas | mas | deg | mJy/b | mJy | mas | mas | deg | |||
| EVN | 1990.87 | 4975 | 7.1 | 4.4 | 65 | 27.2 | 44.4 | 7.5 | 1.4 | 52 | |
| 43.6 | 53.1 | 4.9 | 0.7 | 46 | |||||||
| EVN | 1995.38 | 4975 | 8.4 | 4.5 | 37 | 26.2 | 46.6 | 10.1 | 2.4 | 44 | |
| 43.1 | 55.9 | – | – | – | |||||||
| VLBA | 1998.74 | 1655 | 17.5 | 4.9 | –21 | 3.8 | 20.4 | 49.1 | 24.0 | 54 | |
| 4.6 | 84.3 | 95.5 | 29.7 | 178 | |||||||
| 8.5 | 98.8 | 58.5 | 23.0 | 169 | |||||||
| 3.3 | 18.2 | 49.1 | 17.1 | 34 | |||||||
| 62.0 | 138.5 | 8.7 | 5.3 | 51 | |||||||
| 44.7 | 127.3 | 12.9 | 6.6 | 28 | |||||||
| VLBA | 1998.74 | 4619 | 5.6 | 2.0 | –18 | 4.3 | 23.4 | 9.8 | 3.8 | 40 | |
| 10.0 | 26.7 | 5.3 | 2.4 | 32 | |||||||
| 17.5 | 4.9 | –21 | 13.1 | 20.0 | – | – | – | ||||
| 22.4 | 34.9 | – | – | – |
2.4 Comparison of the VLBI images of the central component
The 5 GHz image has been convolved with the 1.6 GHz beam and the flux densities of the two main components compared. A spectral index of is derived for component and for component (S).
To check for any possible change of the relative position of the two components and with epoch, we made use of the images at 5 GHz (their maximum time separation is years), all convolved to the same beam size. The angular separation between the two components of mas did not change within the estimated errors of 0.5 mas. The errors are affected by the discrete size of the components (of the order of the beam size) which are extended in the same direction as the source major axis.
The derived parameters, resolved angular sizes, steep spectral indices, constant separation, suggest that nor neither can be considered as the core of 3C99.
3 Discussion
The arcsecond resolution images of 3C99 show that the source has a triple asymmetric structure. Even if we could not achieve a firm identification of the source core, the core location is doubtlessly in the component region. Also, the position of the optical N-galaxy 3C99 (Spinrad et al. 1985) is close to that component. Thus, we know approximately where the central engine is located and we can confirm the source asymmetry. The ratio between the distances of the hot-spots from the center of component is 4.5, while that of the hot-spots brightnesses is 40. From the optical observations we also know that the North-East side is approaching the observer being less red-shifted than the South-West part (see Mantovani et al. 1990).
Asymmetry in the radio lobe arm length ratio is expected when the hot spots move at a relativistic speed as a consequence of the difference in travel time of the radiation emitted by the approaching and receding hot spot. The approaching lobe should be the one seen at a later stage of evolution and therefore more distant from the core as compared to the receding one. Furthermore some relativistic boosting (de-boosting) should also be expected for the approaching (receding) hot spot, giving rise as well to an asymmetry in luminosity. In 3C99 the lobe closer to the core is the brighter and approaching one. It is clear that relativistic effects alone cannot fully explain the observed asymmetry.
Alternatively, we attribute the asymmetry to an inhomogeneity in the ambient medium on the two sides of the source. The brighter and closer lobe would be the one moving through a more dense medium having a small density gradient, being slowed down and remaining bright as a consequence of a more effective confinement. An indication that this could be the case comes from the image of Fig. 1, a superposition of the radio and [OII] images. If we assume that they actually overlap in space, it follows that the north–east bright component of the source, i.e. the part closest to the core, is completely immersed in the cloud of gas, while the south–west hot–spot lies in a region at the border where the gas density is clearly much lower.
3.1 A model for asymmetry.
To explain the asymmetry in the radio structure of 3C99 we made use of the Scheuer-Baldwin model (Scheuer 1974; Baldwin 1982), one of the so called continuous streaming model. In the model, a relativistic twin-jet propagates in an external medium with a non uniform density.
We assume that the jets carry an energy flux and a thrusts . The advance speed of the jets head (hot spots), , is controlled by the balance between the jet thrust and the ram-pressure of the ambient medium, viz. . Modeling the external density as
where is the distance from the nucleus. By integration of these relations, we get the instantaneous and average advance speed
The energy carried by the jet is assumed to accumulate into the lobe under equipartition conditions. This allows the computation of the lobe luminosity (Begelman 1996) as
where is the lobe age, f(n) a factor accounting for the energy lost in the source expansion (of the order of 0.5) and the lobe volume.
Finally, assuming again equipartition, we evaluate the hot spot luminosity as
where is the hot spot radius, that we assume, for sake of simplicity, proportional to .
We remark that, because of the large advance speeds, the travel time effects would cause the two lobes to be seen at different ages, thus
Therefore, an important item for the following discussion is the orientation of the source with respect to the line of sight.
3.2 Physical parameters from jets, lobes and hot spots
In the above framework, we will interpret the asymmetry in 3C99 making use of the physical quantities, listed in Table 4, derived from the present observations and from those presented in Mantovani et al. (1990).
| Region | Comp. | log | Volume | |||||
| mas | kpc | erg | mGauss | |||||
| LobeNorth | 26.4 | 750470 | 4.12.8 | 17 | 1.8 | 3.5 | 0.2 | |
| LobeSouth | 25.1 | 15001500 | 5.95.9 | 111 | 0.8 | 2.4 | 0.05 | |
| Hot-spotNorth | I | 25.5 | 5242 | 0.320.25 | 0.01 | 2.2 | 7.0 | 0.9 |
| II | 25.7 | 4842 | 0.290.23 | 0.01 | 2.6 | 9.6 | 1.0 | |
| III | 25.2 | 14887 | 0.900.50 | 0.12 | 4.2 | 1.1 | 0.35 | |
| Hot-spotSouth | I | 24.2 | 531290 | 3.151.72 | 4.9 | 5.0 | 3.6 | 0.06 |
| II | 23.9 | 300231 | 1.00.76 | 1.75 | 2.2 | 4.4 | 0.07 | |
| Jet (mas) | 25.3 | 70070 | 4.140.21 | 0.09 | 4.5 | 1.6 | 0.4 | |
| 5 GHz | C1 | 25.0 | 10.44.2 | 0.050.02 | 1.8 | 8.0 | 1.5 | 4.1 |
| 1.6 GHz | C1 | 25.4 | 8.63.1 | 0.030.01 | 1.8 | 1.4 | 2.8 | 5.5 |
| 5 GHz | C2 | 25.3 | 10.53.6 | 0.050.02 | 0.9 | 8.6 | 3.3 | 6.0 |
| 1.6 GHz | C2 | 25.3 | 29.44.3 | 0.180.01 | 5.0 | 1.8 | 1.2 | 3.6 |
| The quantities have been derived assuming equipartition, a filling | ||||||||
| factor of 1, electron to proton ratio of 1 and the behavior of the radio | ||||||||
| spectrum between 10 MHz and 100 GHz. To determine the flux densities of | ||||||||
| the north–east lobe, we subtracted the core, jet | ||||||||
| and hot spot flux densities from images at higher resolutions (for example the MERLIN | ||||||||
| image in Fig. 2). Since those images were also at different frequencies, | ||||||||
| the flux densities were scaled accordingly, adopting a mean spectral | ||||||||
| index 0.5 (S) | ||||||||
| The linear dimensions were derived from the angular dimensions obtained | ||||||||
| using the AIPS task JMFIT, deconvolved from the beam. Table 4 is | ||||||||
| organized as follows: column 1, region; column 2, component (the hot-spot | ||||||||
| north components I, II and III correspond to the components A1, A2 and A3 | ||||||||
| of Fig. 4); column 3, radio power at 1.4 GHz; column 4, linear dimensions | ||||||||
| in kpc; column 5, volume in kpc3; column 6, minimum energy in erg; | ||||||||
| column 7, energy density erg/kpc3; column 8, magnetic field in mGauss. | ||||||||
The ratio of the distances of the lobes at the two opposite sides of the nucleus is:
| (1) |
where and are the distances of the approaching and receding lobe respectively, and their mean velocities relative to the speed of light and the angle between the source major axis and the observer’s line of sight. The second factor accounts for differences in the travel time from the lobes.
The lobe luminosity ratio is given by:
| (2) |
The factor accounts for the fact that the two lobes are seen at different times of their evolution. A similar equation holds for the hot spot luminosity ratio:
| (3) |
where is the Lorenz factor, the hot spot spectral index. The parameters needed to satisfy the above equations can be compared to those derived from the existing observations of 3C99, summarized in Tables 4 and 5.
| Parameter | Image Freq. | Approaching jet | Receding jet | Ratio |
| Distance nucleus-lobe | 1.4 GHz | mas | mas | 0.21 |
| Lobe Flux Density | 0.4 GHz | mJy | mJy | 17.1 |
| Hot-spots Flux Density | 5 GHz | mJy | mJy | 37.9 |
| Jet Brightness | mJy/beam | mJy/beam | ||
| The jet counter-jet brightness ratio in the last row of Table 5 has been | ||||
| derived from the MERLIN image at 5 GHz considering the jet as having a | ||||
| conical structure with longitudinal dimension of 700 mas, a transverse | ||||
| dimension of 70 mas, an angle and a total flux | ||||
| density of 43 mJy. The jet mean brightness mJy/beam is | ||||
| obtained dividing the total flux density by the beam area to jet area | ||||
| ratio. Since the counter-jet is below the detection limit of the | ||||
| MERLIN image, we have mJy/beam, and a | ||||
| ratio between the brightnesses . | ||||
3.3 Search for the unknown parameters
We make use of the above equations to evaluate the unknown parameters , , , and .
We first constrain the range of values for . Assuming a symmetric two-sided jet, the lower limit to the jet to counter-jet brightness ratio implies , which requires . Moreover, in order to fit the unified models scheme (see Saikia et al. 1995) a CSS source optically classified as a N-galaxy is expected to have the radio axis at to the observers line of sight.
In order to maximize the effects due to the asymmetric distribution of the ambient medium, we assume = 0 and = 2. Following the models of Scheuer (1974) modified by Baldwin (1982) and of Begelman (1996), we compute 1.25. Furthermore and .
The observed parameters which the model uses are:
/ = 0.21
/ = 23
/ = 25
/ = 35 10
/ = 8
One of the most uncertain input parameter is the ratio of the lobe volumes, deduced from the 1.7 GHz map of Mantovani et al. (1990), which is the best in order to evaluate the lobe’s luminosity, but suffers from poor angular resolution for a proper measurement of the lobe’s size. On the other hand, the above mentioned source models (Scheuer-Baldwin and Begelman) allow the computation of the volume ratio, which is consistent with the observed one.
An additional uncertainty comes from the identification of the of the north lobe. If we take the brighter one (named I in Tab. 4, labelled A1 in Fig. 4) we get a luminosity ratio of 30, while using the second brightest (named II in Tab. 4, labelled A2 in Fig. 4) we get a ratio of 20. The previous equations allow a search over a range of parameters to account for the observed asymmetry of the radio source. For , the first two equations require and .
The above numbers allow the computation of the ratio of hot spot luminosities, with equation (3). We get: . This range of values is somewhat lower than the one we have from the observations (). In order to increase the computed ratio, one should increase the s, which in turns implies an increase of the ratio .
3.4 The age of 3C99
The radio source age can be derived from the age of the emitting relativistic electrons providing we know the break frequency in the spectral index of the source. From the existing images, we derive straight steep spectral indices for the two lobes (), thus we cannot infer any value for break frequencies. The only suggestion we can made is that MHz. For the equipartition magnetic fields of Table 4, following Carilli et al. (1991) and Murgia et al. (1999) we have years for the North lobe, which accounts for most of the total radio luminosity.
A second way to determine the age of 3C99 is a dynamical approach via the following relation:
| (4) |
and for example for , and dynamical ages of and for each lobe respectively, are derived. The two ages differ due to the time delay in the propagation of the radiation.
4 Conclusions
The present observations confirm the asymmetry of 3C99. A one-sided long, thin jet was detected with MERLIN. The 5-GHz MERLIN observations show that the source is polarized in the hot spot region and confirm the depolarization previously measured, and a PA of the electric vector in agreement to previous results. The hot spot region contains three compact features detected by the 1.6 GHz VLBA observations, the jet was resolved out and the central area shows a double structure in both 1.6 GHz and 5 GHz VLBA images. The observations did not allow us to detected polarized emission from any components in 3C 99 above the detection limit of the VLBA observations (0.3 mJy/beam at 5 GHz). The comparison between the 1.6 GHz and the 5 GHz shows that the detected source components do show a steep spectral index, making it difficult to suggest which of them is the core. We suggest that the two components detected in the central region of 3C 99, are co-moving jet components along the north–east side of the source.
The asymmetry in the radio structure of 3C 99 can be explained with the Scheuer-Baldwin model requiring a rather large difference in the interstellar medium density on the two sides of the central component. Such an assumption makes the model predictions consistent with the observational parameters. We have assumed that in the south–west direction, where the hot-spot is less bright and more distant, the ambient gas density goes as , where is the radial distance from the source nucleus . On the opposite side, i.e. in north–east direction, we have assumed that the ambient gas density is constant with , with a stronger interaction with the advancing jet. This should also explain the strong far infrared emission detected. The interaction of the radio plasma with the interstellar medium may trigger the star formation and the heating of dust will generate strong infrared emission. However, relativistic effects were also required to fit the parameters derived from the observations. An angle of between the source major axis and the observers line of sight is needed.
The age of 3C 99 has been derived using both the age of the emitting relativistic electrons with a dynamical approach. The source is found younger than years.
A time scale of has been suggested recently by Baker et al. (2002) for the ionization cone to emerge from their dusty cocoons in quasars which is comparable to those of many CSS and, of course, to that of 3C99. They show that the stronger C IV absorbers are found in small steep-spectrum radio sources and argue that the absorption column density changes with time. Since it is unlikely that CSS sources are confined by dense clouds of gas and since the environmental density cannot account for the full range of radio source size in quasars, they suggest that the age must be important. Models of dust grains in the vicinity of powerful radio sources requires special conditions for grain survival up to years. According to such interpretation, 3C99 can be understood to be in a phase in which the jets are emerging from the clouds of dense gas.
We note that, though 3C 99 has been classified as a N-galaxy, an overview of the spectroscopy available at several wavelength rises new puzzling questions about its nature in the light of the unified models. Its high infrared luminosity, which is a factor of 20 greater than that of a typical radio galaxy, and its optical spectrum which shows high luminosity narrow lines, would classify 3C 99 as FIR-bright AGN. The lack of broad band optical emission and the rather weak X-ray emission, on the other hand, are against such interpretation. New observations are needed to confirm the alternative suggestion for the star formation process as origin of the infrared emission.
Acknowledgements.
The author whish to thank the referee for valuable comments on the manuscript.References
- (1) Baker J.C., Hunstead R.W, Athreya R.M. et al 2002 ApJ, 568, 592
- (2) Baldwin J.E., 1982, in Extragalactic Radio Sources, Proceeding IAU Symposium No. 97, eds. D.S. Heeschen & C.M. Wade, Dordrecht, Reidel, p. 21
- (3) Begelman M.C. 1996, Cyg A: Study of a Radio Galaxy, eds. C. Carilli & D. Harris, Cambridge University Press, p. 209
- (4) Carilli C.L., Perley R.A., Dreher J.W. et al. 1991 ApJ, 383, 554
- (5) Crawford C.S. & Fabian A.C. 1996, MNRAS 282, 1483
- (6) Fanti C., Fanti R., Dallacasa D. et al. 1995, A&A 231,333
- (7) Fanti C., Pozzi F., Fanti R. al. 2000, A&A 358,499
- (8) Hes R. 1994, PhD Thesis
- (9) Hes R., Barthel P.D. & Hoekstra H. 1995, A&A 303,8
- (10) Hes R., Barthel P.D. & Fosbury R.A.E. 1996, A&A 313,423
- (11) Kaiser C.R. & Alexander P. 1997, MNRAS 286,215
- (12) Mantovani F., Saikia D.J., Browne I.W.A. et al. 1990, MNRAS 245,427
- (13) Mantovani F., Junor W., Fanti R. et al. 1997, A&AS 125,573
- (14) Murgia M., Fanti C., Fanti R. et al. 1999, A&A 345, 769
- (15) Saikia D.J., Jeyakumar S., Wiita P.J. et al. 1995, MNRAS 276, 1215
- (16) Saikia D.J., Jeyakumar S., Wiita P.J. et al. 1996, The Second Workshop on Gigahertz Peaked Spectrum and Compact Steep Spectrum Radio Sources, Leiden, 30 September - 1,2 October 1996 Eds. I.A.G. Snellen, R.T. Schilizzi, H.J.A. Röttgering and M.N. Bremer
- (17) Scheuer P.A.G. 1974, MNRAS 166, 513
- (18) Shepherd, M.C., Pearson, T.J., Taylor, G.B. 1995, BAAS 26, 987
- (19) Spinrad H., Djorkovski S., Marr J. & Aguilar L. 1985, PASP 97,932
- (20) van Bemmel I. & Barthel 2001, A&A 379,L21