DOGS THAT DON’T BARK?
(The Tale of Baryonic Dark Matter in Galaxies)
Abstract
This article reviews the nature and distribution of baryonic dark matter in galaxies, with a particular emphasis on the Milky Way. The microlensing experiments towards the Large Magellanic Clouds, the Andromeda Galaxy and the bulge provide evidence on the characteristic mass and abundance of baryonic dark matter, as do direct searches for local counterparts of dark halo populations.
1 Introduction
Fifteen years or so ago, it was commonly argued; “If we want to believe the observations rather than our prejudice, we should take as our best bet that dark haloes are baryonic.” [1] Such a viewpoint is not often heard today. This change-of-mind has been enforced upon us largely by the microlensing experiments. Particle dark matter differs from (most types of) baryonic dark matter in that it does not produce microlensing events. The familiar parade of baryonic candidates has now been whittled down, and perhaps only one remains as a possible substantial contributor to the dark matter in the Galaxy’s halo. This review assesses the distribution of missing matter in the Galaxy (Section 2), the likely baryonic dark matter suspects (Section 3), the evidence from microlensing (Section 4) and from the halo white dwarf searches (Section 5).
2 Missing Mass in the Galaxy
2.1 The Inner Parts
It is now clear [2] that there is little dark matter in the inner parts of big galaxies like the Milky Way. Here, the mass budget is dominated by the baryons in the luminous disk and the bulge.
There are three strong pieces of evidence. First, models of the Milky Way in which the dark halo makes little contribution within the central kpc are already strongly supported by simulations of the gas flow in the Galactic bar [3]. To reproduce the terminal velocities of the HI gas, the bar and disk must provide almost all of the gravity force field within the inner few kpc. Second, bars in galaxy models having halos of moderate or high central density all experience strong drag from dynamical friction. The bar in the Milky Way is able to maintain its observed high pattern speed only if the halo has a central density low enough for the disk to provide most of the central attraction in the inner Galaxy [4]. Third, for the Milky Way, there are extremely high microlensing optical depths towards Baade’s Window in the bulge. Almost all the matter in the inner parts of the Galaxy must be capable of causing microlensing (and hence probably baryonic) [5]. The central kpc of the Milky Way contain little particle dark matter.
2.2 The Outer Parts

The total mass of the Milky Way galaxy is not known very well. This is because the gas rotation curve cannot be traced beyond kpc, leaving only distant globular clusters and satellite galaxies as tracers of the dark matter potential. The dataset of positions and radial velocities (sometimes proper motions as well) of satellite galaxies and distant globular clusters is sparse. Thus, most investigators [6] have chosen to make strong assumptions about the underlying halo model, using Bayesian likelihood methods to estimate the total mass and the eccentricity of the orbits. Typical recent results are shown in Figure 1. The solid (dotted) contours in the left panel of Figure 1 show the likelihood including (excluding) one of the most distant and troublesome of the satellite galaxies (Leo I) from the dataset. The most likely total mass of the Milky Way galaxy is including Leo I and excluding Leo I. For comparison, the right panel of Figure 1 shows likelihood contours for the M31 halo, using the dataset of projected positions and velocities of globular clusters and satellite galaxies. The most likely mass of M31’s halo is . Given the large uncertainties in the estimates, a reasonable conclusion is that both the Milky Way galaxy and M31 have equally massive dark haloes. The total mass in dark matter is about ten times greater than the total mass in stars. The outer parts of both the Milky Way galaxy and M31 are overwhelmingly dominated by dark matter.
2.3 The Solar Neighbourhood
For all direct detection experiments, the crucial question is: how much dark matter is there in the solar neighbourhood? By analyzing the line-of-sight velocities and distances of K dwarf stars seen towards the south Galactic pole, Kuijken & Gilmore [7] showed that at the solar radius there is of material within of the Galactic plane. Measurements of the proper motions and parallaxes of stars that lie within of the Sun have yielded estimates of the local density of all matter [8]. For example, Crézé et al. found ; Pham found ; Holmberg & Flynn found .
By counting disk M dwarfs in Hubble Space Telescope fields, the vertical profile of these objects is known to be well modelled by [9]
| (1) |
The effective thickness of the disk’s stellar mass is [5]
| (2) |
By counting stars within of the Sun (which can be detected through their large proper motions) and using Hipparcos parallaxes Jahreiß & Wielen [10] found that stars contribute to the mass density at the plane. Multiplying this density by the effective disk thickness , we have that stars contribute to the of matter that lies within of the plane. Gas (primarily hydrogen and helium) contributes . Thus, of the mass within of the plane can be accounted for by stars and gas, and the remaining should be contributed by dark matter [5]. The overall error on this last number could easily be as large as each way.
3 The Usual Suspects
This Section lines up the baryonic dark matter suspects, which could make up some of the copious amounts of missing matter in the Galaxy.
3.1 Red and Brown Dwarfs
Red dwarfs (M dwarfs) have masses between and . They shine due to hydrogen burning in their cores. Judging from local samples, red dwarfs are about 4 times more common than all other stars combined. About of all the stars in the solar neighbourhood are red dwarfs [11]. The local number density of red dwarfs [12] as reckoned from surveys such as the 8-parsec sample is per cubic pc.
Brown dwarfs are objects lighter than . They are too light to ignite hydrogen. They are brightest when born and then continuously cool and dim. Since 1997, near-infrared surveys (DENIS and 2MASS) have been steadfastly uncovering brown dwarfs [13]. There are over good candidates now (as well as two new spectral classes, L and T dwarfs). The local number density of brown dwarfs [14] is very uncertain but it may be as high as per cubic pc. In which case, the total number of brown dwarfs may exceed the total number of stars in the Galaxy.
Both red and brown dwarfs are seemingly very common in the Galactic disk (and probably the bulge and spheroid too). But, it is now clear that most of the missing mass in the Galactic halo cannot be ascribed to either red or brown dwarfs.
Red dwarfs are ruled out because they are not seen in sufficient abundance in long exposures of high Galactic latitude fields using the Hubble Space Telescope Wide Field Camera. More specifically, less than 1% of the mass of the halo can be in the form of red dwarfs [15]. Brown dwarfs are ruled out because they produce microlensing events towards the Magellanic Clouds with typical timescales days. This is much shorter than the timescales of the observed events, which are days. Let us recollect that the only parameter in a microlensing event providing any physical information is the timescale. This encodes the mass with the velocities and distances of both the source star and the microlens. Hence, the masses of the microlenses cannot be deduced on an event by event basis, but typical masses can be deduced using models of the Galactic halo. To minimise the mass, the transverse velocity of the microlens with respect to the line of sight must be reduced. In the outer halo, radial anisotropy is best for doing this; closer to the Solar circle, tangential anisotropy is best. By using a constraint on the total kinetic energy of the lensing population, the microlens mass can be minimised over all orientations of the velocity dispersion tensor. This minimum mass is , which lies above the hydrogen-burning limit [16]. So, the microlenses cannot be brown dwarfs.
3.2 White and Beige Dwarfs
White dwarfs are objects with mass , the remnants of stars with masses in the range 1-8 . The local number density of white dwarfs [17] is per cubic pc. This is reckoned from samples believed complete to 13 pc. If so, then white dwarfs are about 100 times rarer than red dwarfs and brown dwarfs.
For many years, white dwarfs were regarded as very improbable candidates for the dark matter in galactic haloes. The main problem is that the progenitor stars are like filthy furnaces, disgorging metals into the ISM. Carbon, nitrogen, helium and deuterium are seriously overproduced, as judged by the present abundances of stars in the Galactic halo [18]. Even if all the ejecta of a population of white dwarfs are removed by Galactic winds, the mass budget is enormous, exceeding that of the entire Local Group. It needs a contrived IMF so as to avoid leaving large numbers of visible main sequence precursors still burning today in the halo. These problems [19] remain largely unsolved. But, the microlensing results (with their preferred typical mass of the microlenses of ) have sparked a lot of activity in the area of white dwarf searches – without success so far.
Beige dwarfs have masses up to . These objects are supposed to form by slow accretion of gas onto planets or brown dwarfs. Provided the accretion energy is radiated away, the temperature in the core never rises high enough to ignite hydrogen [20]. As beige dwarfs are envisaged as primordial objects rather than the end-points of stellar evolution, this ingeniously circumvents the problem of pollution by metals. Unhappily, the most recent calculations suggest that the accretion rate needs to be Gyr-1 – too slow to allow their manufacture in this Universe.
3.3 Neutron Stars and Black Holes
Neutron stars are the remnants of stars with initial masses in the range 8-20 , while black holes are the remnants of stars larger than 20 . However, neutron stars and black hole remnants less than cannot make up the bulk of the dark matter as their precursors generate unacceptable metal production or background light [21].
Stars larger than collapse directly to black holes without excessive nucleosynthetic or background light production. They cause microlensing events with timescales yr, which are too long to be detectable by current surveys. There are some noticeable dynamical effects. For example, stellar encounters with such black holes produce a power-law tail in the energy distribution. Accordingly, Lacey & Ostriker’s original paper [22] correctly predicted the existence of the (then unknown) thick disk. Hence, supermassive black holes remain genuine suspects.
4 The Evidence from Microlensing
Microlensing towards the Large Magellanic Cloud and the Andromeda galaxy provides direct evidence on the fraction of dark matter in haloes that is baryonic. Microlensing towards the bulge provide indirect evidence on the structure of the Galactic dark halo.
4.1 Microlensing towards the Magellanic Clouds
The original motivation [23] of the microlensing experiments was to detect the effects of baryonic dark objects in the Galactic halo on background stars in the nearby satellite galaxies, the Large and Small Magellanic Cloud. From 5.7 years of data, the MACHO collaboration [24] found between 13 to 17 microlensing events towards the Large Magellanic Cloud (LMC) and reckoned that the optical depth (or probability of microlensing) was . They argued that, interpreted as a dark halo population, the most likely mass of the microlenses is between 0.15 and 0.9 , seemingly implicating white dwarfs. The total mass in the objects out to 50 kpc is . This is of the mass of the halo. In stark contrast, after 8 years of monitoring the Magellanic Clouds, the EROS collaboration [25] secured just a “meagre crop of three microlensing candidates towards the LMC”. EROS monitor a wider solid angle of less crowded fields in the LMC. So, blending and contamination by lenses in the LMC itself (so-called “self-lensing”) are much less important. EROS do not report their results in terms of optical depth, but their experiment seemingly implies a lower value than that preferred by MACHO.
One possibility is that the lenses lie in or close to the Large Magellanic Cloud or in some intervening population, rather than being true denizens of the dark halo. A number of ingenious suggestions [26] have been made – the LMC disk, tidal debris, the warped Milky Way disk, an intervening satellite galaxy. For one reason or another, none of these ideas have gained a concensus, although some contain ingredients of merit. What we do know for sure is that some of the lenses do not lie in the dark halo. There are now four exotic events [27] (two binary caustic crossing events, one long timescale event with no detectable parallax, one xallarap event) for which the location of the event can be more or less inferred. In all four cases, the lens almost certainly lies in the Magellanic Clouds. Most recently of all, there has been the direct imaging of one the microlenses by Alcock et al. [28], revealing it to be a nearby low-mass star in the disk of the Milky Way. At first glance, all this seems strong evidence that most of the lenses do not lie in the dark halo; however, there are biases in exotic events that favour the discovery of events in which the lens and source are close together. In other words, there is no compelling evidence either for or against a Galactic halo origin of the microlenses. They may equally well lie in the dark halo or they may lie in the Magellanic Clouds or in intervening populations.
A final possibility that deserves serious consideration is that some microlensing events may have been misidentified. For example, there are expected to be supernovae in background galaxies behind the LMC and brighter than MACHO’s limiting magnitude during the experiment’s lifetime; this number may be larger by at least a factor of two, depending on the supernova contribution from faint galaxies. So, supernova contamination is a serious problem [24]. The bumps do no repeat and rise up from a flat baseline. They differ from microlensing curves in that they are asymmetric, but such asymmetry may not be obvious in noisy or sparsely sampled data. In fact, MACHO’s data are taken at a site where the median seeing is arcsec so the quality of the data is sometimes poor. An interesting recent breakthrough by Belokurov and co-workers [29] has been the development of neural networks to identify microlensing events in massive variability surveys. This replaces judgements made by human experts with judgements based on strict statistical criteria. This technique has thus far been applied only towards the Galactic bulge, but it already hints that some events may have been misclassified. An analysis of the events towards the LMC can be expected from this group soon.
Parameters for the 4 POINT-AGAPE candidates. Here, is the magnitude (Johnson/Cousins) of the maximum source flux variation, is the Einstein timescale, is the full-width half-maximum and is the maximum amplification. All these events have very high amplification and short full-width half-maximum timescale. [From Paulin-Henriksson et al. 2002] . reference (mags) (days) (days) PA-99-N1 1.9 PA-99-N2 25.0 PA-00-S3 2.3 PA-00-S4 2.1
4.2 Microlensing towards M31
Microlensing experiments towards M31 have the potential to clarify the ambiguous results towards the LMC. This is because M31 is highly inclined (). Lines of sight to disk stars in the north or near side of M31 are shorter than those to the south or far side. Microlensing by a spheroidal dark halo will have a characteristic signature with an excess of events on the far side of the M31 disk [30]. This signal is absent when the microlenses lie in the stellar disk or bulge of M31. A number of groups [31] are now carrying out large-scale surveys of M31 to look for this near-far disk asymmetry. In M31, the individual stars are not resolved, so that the flux on the detector elements (pixels or superpixels) is monitored. Novel techniques have been developed to monitor flux changes of unresolved stars in the face of seeing variations [32].
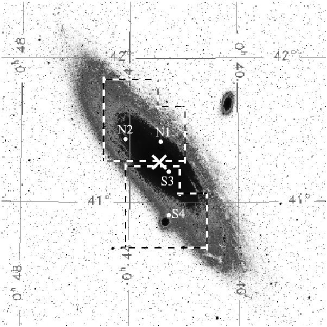
Recently, the POINT-AGAPE collaboration [33, 34] has reported results from two years of data taken with the Wide Field Camera on the 2.5m Isaac Newton Telescope. The fields are shown in Figure 2; they are deg2 and located north and south of the centre of M31. Two years of data are not yet sufficient to look for any gradient signal, but they are enough to identify a sample of some convincing high signal-to-noise candidates. Table 1 lists the characteristics of four such events, designated PA-99-N1, PA-99-N2, PA-00-S1 and PA-00-S4. Here, N (or S) tells us whether the event occurs in the northern or southern field, while 99 or (00) tells us whether the event peaks in 1999 (or 2000). The events are selected on the basis of a set of severe selection criteria. There are candidates with a single, substantial, symmetric bump which is a good fit to the standard Paczyński form. Many of these are variable stars and a longer baseline is needed to provide discrimination. Accordingly, Paulin-Henriksson et al. insist upon a short full-width half-maximum timescale ( days) and a flux variation exceeding the flux of a 21st magnitude star (). The rationale for this is that microlensing is the only astrophysical process that can cause such huge fluctuations on such very short timescales. This cut leaves eight microlensing candidates [35], of which the four listed in Table 1 are the most convincing.
These early results are tantalizing. Microlensing events in the inner few arcminutes are overwhelmingly due to stellar lenses in the bulge [36]. Hence, PA-99-N1 and PA-00-S3 are likely to be caused by low mass stars in the bulge. PA-00-S4 lies about from the centre of M31, but it is only from the centre of the foreground dwarf elliptical galaxy M32. Although the lens could be a dark object in M31’s halo, the closeness to M32 suggests that a stellar lens in M32 is more probable [33]. The fourth event PA-99-N2 lies far out in the M31 disk and there are no obvious concentrations of stellar lenses along the line of sight. At first glance, this looks a good candidate for a lens in the dark halo of either of our Galaxy or M31. However, the self-lensing optical depth (that is, the probability that an M31 disk star is lensed by another M31 disk star) is [34]
| (3) |
where is the disk column density, is its exponential scale height and we have normalised the formula to likely values. In fact, is comparable to the halo optical depth at this location for a baryon fraction. However, the disk self-lensing hypothesis makes a reasonably model-independent prediction about the event timescales, namely
| (4) |
which is in good agreement with the of days for PA-99-N2.
These arguments are teasingly suggestive rather than conclusive. Certainly, the notion that dark halo lenses are responsible for all of these events is not especially favoured, although it is cannot be rejected right now [33]. In the cases where halo lenses may be responsible (PA-99-N2, PA-00-S4 and perhaps PA-99-N1), stellar lensing is equally likely. Had one or several of these events been projected against the far side of the M31 disk, well away from the M31 bulge and from M32, then halo lensing would have been the likely culprit.
4.3 Microlensing towards the Bulge
Lines of sight towards the bulge do not probe the halo dark matter directly, as almost all the lensing events are probably caused by low mass stars in the disk and the bulge. Rather surprisingly, however, we do learn something concerning the structure of the Galaxy’s dark halo from these experiments.
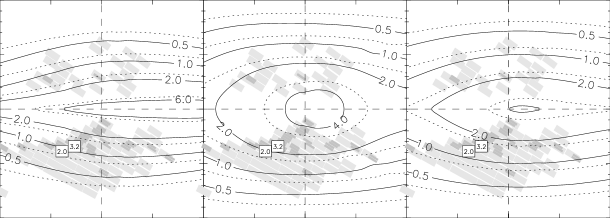
Table 2 shows the measurements of the optical depth to microlensing to the red clumps stars in the bulge [37]. Red clump stars are bright stars that are known to reside in the bulge. The experiments have remained very consistent with an optical depth of . Figure 3 shows contours of optical depth in three barred models of the inner Galaxy [38]. All three models have been derived from the same dataset, namely the infrared surface photometry measured by the DIRBE instrument on the COBE satellite, but made different corrections for absorption and emission by dust. Models such as those based on constant mass-to-light deprojections of the infrared photometry [39] are not able to reproduce these high optical depths. Freudenreich’s model [40] does come closer (as Figure 3 shows), although it too has some difficulties with the highest values, such as the most recent results from Sumi et al. (the MOA collaboration).
The microlensing optical depth recorded by various experimental groups towards locations in the Galactic bulge. Collaboration Location Optical Depth Udalski et al. (1994) Baade’s Window Alcock et al. (1995) () Alcock et al. (1997) () Alcock et al. (2000) () Popowski et al. (2000) () Sumi et al. (2002) ()
A crucial difference between baryonic and particle matter is that the former can cause microlensing events, while the latter cannot. To get these high optical depths, almost all the matter permitted by the rotation curve must be baryonic within the inner kpc. Figure 4 shows a fit to the tangent-velocity data (short dashed line) originally derived by Binney et al. [41]. Any model must lie below this curve. The dotted curve shows the contribution to the rotation curve from a bulge and disk judged to reproduce an optical depth of towards Baade’s Window (itself a conservative value, lower than most of the measurements in Table 2). The long-dashed curve shows the contribution of the dark halo to the rotation curve using the local column densities of dark matter derived in Section 2.3, assuming the cusped Navarro-Frenk-White (NFW) model [42] currently favoured by cosmological simulations. The total rotation curve always lies above the data. The high optical depths to microlensing seen towards the bulge are enough to rule out cusped dark halo models like Navarro-Frenk-White for the Milky Way [5].

5 The Evidence from White Dwarf Surveys
There have been a number of searches for local examples of high velocity, very cool white dwarfs that might be representatives of the halo population causing the microlensing towards the LMC.
First, Ibata et al. [43] claimed the detection of 5 faint objects with significant proper motion in the Hubble Deep Field. They argued that the observations were consistent with old white dwarfs with hydrogen atmospheres. They claimed that this provided a local mass density which, if extrapolated, was sufficient to account for the microlensing results. Strictly speaking, Ibata et al. found 5 faint objects whose light centroids shifted between the first and second epoch of exposures (separated by 2 years). For point sources, such centroid shifts might be indicative of proper motions; however, they also can arise easily enough for extended or variable sources. Richer [44] withdrew the results after an analysis of the third epoch data, taken 5 years after the original Hubble Deep Field. None of the 5 objects possessed a statistically significant proper motion. Whatever the objects are, they are not moving and so certainly not high velocity white dwarfs.
Second, Oppenheimer et al. [45] also claimed “direct detection of galactic halo dark matter”. They identified candidates with sub-luminosity and with high intrinsic proper motions from SuperCOSMOS Sky Survey Plates. They followed this up with spectroscopy to discover 38 cool white dwarfs. Oppenheimer et al. derive and velocities for each target by setting , where () are the components towards the Galactic Centre, in the direction of Galactic rotation and perpendicular to the Galactic plane respectively. Systems with are identified as members of the halo. They derive a halo white dwarf density of stars per cubic pc. This is a factor of 10 higher than the expected density of white dwarfs in the stellar halo. However, this result has been contested by Reid et al. [46], who question the validity of the kinematic discriminant. For example, there is a significant excess of prograde rotators in Oppenheimer et al.’s sample: 34 out of 38. This is exactly the behaviour expected if a substantial number of the white dwarfs are drawn from the thick disk rather than the halo. Most true halo populations are only weakly rotating.
Despite false alarms, such halo white dwarf surveys are clearly worth pursuing. The discovery of a local counterpart to the putative microlensing population would be a substantial breakthrough.
6 Conclusions
Evidence from dynamics and particularly microlensing has made many baryonic dark matter candidates unlikely as components of galaxy haloes. The constraints on stellar baryonic dark matter are especially harsh, with brown, red, beige and white dwarfs ruled out as dominant contributors. Only at the very high mass end (supermassive black holes) do possibilities remain for building the Galactic halo entirely from dark baryonic objects.
It is curious that none of the microlensing events towards the Magellanic Clouds or Andromeda can be ascribed to lenses in the dark halo with surety. Some of the events have been almost certainly identified with stellar populations. This includes the exotic lenses towards the Magellanic Clouds and some of the events towards M31. This need not have been the case. Unambiguous halo candidates could have been found – for example, binary caustic crossing events implicating a halo lens in the experiments towards the Magellanic Clouds or short timescale events far out in the M31 disk. Similarly, local searches could have identified a convincing counterpart to any halo baryonic dark matter population – but did not!
The dogs could have barked three times in the night [47] (during the MACHO experiment, in the POINT-AGAPE datasets, in the white dwarf searches). Each time, the dogs stayed silent.
References
- [1] Distinguished Participants, In IAU Symposium 117: Dark Matter in the Universe, eds J. Kormendy, G. Knapp, Reidel, Dordrecht, p 551 (1985)
- [2] N.W. Evans, In IDM 2000: Third International Workshop on the Identification of Dark Matter, ed N. Spooner, V. Kudryavtsev, p. 85 (2000); J.A. Sellwood, ApJ 540, L1 (2000)
- [3] B. Weiner, J.A. Sellwood, ApJ 524, 112 (1999); P. Englmaier, O.E. Gerhard, MNRAS 304, 512 (1999)
- [4] M. Weinberg, MNRAS 213, 451 (1985); V. Debattista, J.A. Sellwood, ApJ 493, L5 (1998)
- [5] J.J. Binney, N.W. Evans, MNRAS 327, L27 (2001)
- [6] B. Little, S. Tremaine, ApJ 320, 493 (1987); M.I. Wilkinson, N.W. Evans, MNRAS 310, 645 (1999); M.I. Wilkinson, J.T. Kleyna, N.W. Evans, G. Gilmore, In: The Masses of Galaxies at Low and High Redshift, Eds R. Bender, A. Renzini, Springer-Verlag, New York, in press.
- [7] K.Kuijken, G. Gilmore, ApJ 367, L9 (1991)
- [8] M. Crézé, E. Chereul, O. Bienaymé, C. Pichon, A&A 329, 920 (1998); H. Pham, In Hipparcos - Venice ’97 (ESA SP-402), p. 559 (1997) ; J. Holmberg, C. Flynn, MNRAS 313, 209 (2000)
- [9] Z. Zheng, C. Flynn, A. Gould, J.N. Bahcall, S. Salim, ApJ 555, 393 (2001)
- [10] H. Jahreiß, R. Wielen, In Hipparcos - Venice ’97, (ESA SP-402), p. 675 (1997)
- [11] I.N. Reid, S.L. Hawley, New Light on Dark Stars, Springer-Praxis, London (2000)
- [12] I.N. Reid, S.L. Hawley, J.E Gizis, AJ 110, 1838 (1995)
- [13] X. Delfosse et al., A&A 327, L25 (1997);J.D. Kirkpatrick et al., ApJ 519, 802 (1999)
- [14] I.N. Reid et al., ApJ 521, 613 (1999)
- [15] J.N. Bahcall, C. Flynn, A. Gould, S. Kirhakos ApJ 435, L51 (1995); D.S. Graff, K. Freese ApJ 456, L49 (1996)
- [16] G. Gyuk, N.W. Evans, E.I. Gates ApJ 502, L29 (1998)
- [17] J.B. Holberg, T.D. Oswalt, E.M. Sion ApJ 571, 512 (2001)
- [18] B. Gibson, J. Mould, ApJ 482, 98 (1997); B. Fields, K. Freese, D. Graff ApJ 534, 265 (2000)
- [19] K. Freese, B. Fields, D.S. Graff, In IDM 2000: Third International Workshop on the Identification of Dark Matter, ed N. Spooner, V. Kudryavtsev, p. 213 (2000)
- [20] E.E. Salpeter, ApJ 393, 258 (1992); B.M.S. Hansen ApJ 517, L39 (1999);D. Lynden-Bell, C.A. Tout ApJ 558, 1 (2001)
- [21] B.J. Carr, ARAA 32, 531 (1994); B.J. Carr, M. Sakellariadou, ApJ 516, 195 (1999)
- [22] C. Lacey, J. Ostriker, ApJ 299, 633 (1985)
- [23] B. Paczyński, ApJ 304, 1 (1986); M. Petrou, Ph. D. thesis, University of Cambridge (1983).
- [24] C. Alcock et al., ApJ 542, 281 (2000)
- [25] T. Lasserre et al., A&A 355, L39 (2000)
- [26] K. Sahu, Nature 370, 275 (1994); N.W. Evans, G. Gyuk, M.S. Turner, J.J. Binney, ApJ 501, L45 (1998); H.S. Zhao, MNRAS 294, 139 (1998); H.S. Zhao, N.W. Evans, ApJ 545, L35 (2000)
- [27] D.P. Bennett et al.,Nucl. Phys. B 51B, 131 (1996); N. Palanque-Delabrouille et al., A&A 332, 1 (1998); E.J. Kerins, N.W. Evans, ApJ 517, 734 (1999); C. Afonso et al., ApJ 532, 340 (2000); C. Alcock et al., ApJ 552, 259 (2001)
- [28] C. Alcock et al., Nature 414, 617 (2001)
- [29] V. Belokurov, N.W. Evans, Y. Le Du., MNRAS, submitted (astro-ph/0211121)
- [30] A.P.S. Crotts, ApJ 399, L43 (1992); P. Baillon, A. Bouquet, Y. Giraud-Héraud, J. Kaplan, A&A 277, 1 (1993)
- [31] M. Aurière et al., ApJ 553, L137 (2001); A.P.S. Crotts et al., In Microlensing 2000: A New Era of Microlensing Astrophysics, eds. J.W. Menzies, P.D. Sackett, ASP Conference Series, vol. 239, p. 318; A. Riffeser et al., A&A 379, 362 (2001); S. Calchi-Novati et al., A&A 381, 848 (2002); E.J. Kerins et al., this proceedings.
- [32] A.P.S. Crotts, A.B. Tomaney, ApJ 473, L87 (1996); R. Ansari et al., A&A 324, 843 (1997); R. Ansari et al., A&A 344, L49 (1999)
- [33] S. Paulin-Henriksson et al., ApJ 576, L121 (2002)
- [34] S. Paulin-Henriksson et al., A&A, in press (astro-ph/0207025)
- [35] S. Paulin-Henriksson, Ph.D. thesis, Collège de France, Paris.
- [36] E.J. Kerins et al., MNRAS 323, 13 (2001)
- [37] A. Udalski et al., Acta Astron 44, 165 (1994); C. Alcock et al., ApJ 445, 133 (1995); C. Alcock et al., ApJ 479, 119 (1997); C. Alcock et al., ApJ 541, 734 (2000); P. Popowski et al., In Microlensing 2000: A New Era of Microlensing Astrophysics, eds J.W. Menzies, P.D. Sackett, ASP Conference Series, vol. 239, p. 244; P. Popowski, MNRAS, submitted (astro-ph/0205044); T. Sumi et al. ApJ, submitted (astro-ph/0207604)
- [38] N.W. Evans, V. Belokurov, ApJ 567, L119 (2002)
- [39] J.J. Binney, O.E. Gerhard, D.N. Spergel, MNRAS 288, 365 (1997); E. Dwek et al., ApJ 445, 716 (1995)
- [40] H.T. Freudenreich, ApJ 492, 495 (1998)
- [41] J.J. Binney, O.E. Gerhard, A.A. Stark, J. Bally, K.I. Uchida, MNRAS 252, 210 (1991)
- [42] J. Navarro, C.S. Frenk, S.D.M. White, ApJ 490, 493 (1997)
- [43] R. Ibata, H.B. Richer, R.L. Gilliland, D. Scott, ApJ 524, L95 (1999)
- [44] H.B. Richer, In The Dark Universe: Matter, Energy and Gravity, in press (astro-ph/0107079)
- [45] B. Oppenheimer, N.C. Hambly, A.P. Digby, S.T. Hodgkin, D. Saumon, Science 292, 680 (2001)
- [46] I.N. Reid, K.C. Sahu, S.L. Hawley, ApJ 559, 942 (2001)
- [47] A. Conan-Doyle, Silver Blaze in Memoirs of Sherlock Holmes (1894). “Is there any point to which you wish to draw my attention?”.“To the curious incident of the dog in the night-time”.“The dog did nothing in the night-time.” “That was the curious incident” remarked Sherlock Holmes …