Properties of the Brightest Cluster Galaxy and Its Host Cluster
Abstract
We investigate the relation between the properties of Brightest Cluster Galaxies (BCGs) and those of their host clusters. To quantify the properties of cluster hot gas, we employ the parameter of the fundamental plane of X-ray clusters. It is found that the offset of the BCG from the peak of cluster X-ray emission is larger for smaller clusters. The parameter (not the redshift z), which mainly depends on virial density , is considered to represent the formation epoch of a cluster. We thus consider that the offset of the BCG is correlated with the dynamical equilibrium state of its host cluster. On the contrary, no significant correlation is found between the absolute optical magnitude of the BCG and the parameter . If the extreme brightness of the BCG is mainly acquired in the course of cluster evolution by environmental effect, BCGs are expected to be brighter in large clusters. Our result is not consistent with this simplified view. On the contrary, it is possible that the extreme brightness of the BCG is likely to be determined in the early history of cluster collapse.
1 Introduction
Formation and evolution of galaxies are affected by their environment, particularly when they are embedded in clusters. We may see such effect strikingly in brightest cluster galaxies (BCGs), which are defined as the brightest galaxies among the member galaxies in a cluster. The luminosities of BCGs are 10 times larger than those of typical normal field galaxies, and the masses of BCGs are about M⊙, comparable to those of galaxy groups. BCGs are not drawn from the same luminosity function as other cluster member galaxies, suggesting that they have a distinctive formation history (Dressler, 1978).
According to Dubinski (1998), the following three models are proposed to explain the origin of BCGs: (1) star formation from cooling flows expected in the centers of clusters (Fabian, 1994); (2) galactic cannibalism or the accretion of existing galaxies through dynamical friction and tidal stripping (Ostriker & Hausman, 1977); and (3) galaxy merging in the early history of the formation of clusters (Merritt, 1985). In the cooling flow model, intra-cluster gas gradually condenses at the high density center of clusters and form BCGs, creating a large number of new stars. Therefore, the evolution of BCGs follows that of their host clusters. We would distinguish the galactic cannibalism model and the galaxy merging model mentioned above by the formation epoch of BCGs. A number of small galaxies existing within an evolved cluster form a BCG in the galactic cannibalism model. On the other hand, in the galaxy merging model, BCGs are formed during collapse of clusters as expected in hierarchical cosmological models and have earlier origin than their host clusters, contrary to the other two models.
The observational properties of BCGs and their host clusters were studied by Schombert (1987) and Edge & Stewart (1991). They found that the optical luminosity of a BCG is positively correlated with the X-ray luminosity and hot gas temperature of its host cluster. Schombert (1988) observed faint envelopes around 27 cD galaxies, and found that the luminosity of a cD envelop is correlated with the X-ray luminosity of its host cluster. These correlations are evidence of a close connection between a BCG and its host cluster. In this paper, we explore correlations between observational parameters of BCGs and clusters, using recent X-ray data and focusing on new types of parameters with particular interest on their evolutionary link.
We adopt , , and km s-1 Mpc-1 for our study.
2 Fundamental plane of X-ray clusters
Besides using observed X-ray parameters of clusters directly, we employ the parameters defined in the fundamental plane of X-ray clusters proposed by Fujita & Takahara (1999a). They analyzed the relations among the central gas density , the core radius , and the temperature . These data (, , and ) lie on a plane (the fundamental plane) in three dimensional space. Three axes (,, and ) of the fundamental plane are written as functions of (g cm-3), (Mpc), and (keV). The equations of these three parameters are , , and . The scatter of the , , and are , , and , respectively. Thus, the data distribute on the plane.
We especially focus on the parameter , which is the major axis of data distribution. Fujita & Takahara (1999b) point out that the parameter is regarded as an indicator of cluster age. According to the virial equation, the relation between the virial mass , the virial radius , and the virial temperature at the time of cluster collapse is written as
| (1) |
where is the mean molecular weight, is the hydrogen mass, is the Boltzmann constant, is the gravitational constant, and is a fudge factor, which typically ranges between 1 and 1.5. We emphasize that is the virial radius when the cluster collapsed. Since clusters continue growing, present is different from . However, if the structure of the core region is preserved during cluster evolution, the typical core radius of a cluster will reflect the as is shown by Salvador-Sole, Solanes, & Manrique (1998). Assuming that the gas temperature and the core radius are proportional to and , respectively, is written as . From , we obtain
| (2) |
Substituting and written as a function of the fundamental parameters, is described as
| (3) |
Since has only a small scatter, mainly depends on the parameter . The virial density of a cluster should be proportional to the critical density of the universe at the epoch when the cluster collapsed in the spherical collapse model. This is the reason why the parameter is regarded as an indicator of cluster age after the collapse.
3 Offset of the BCG from X-ray Peak
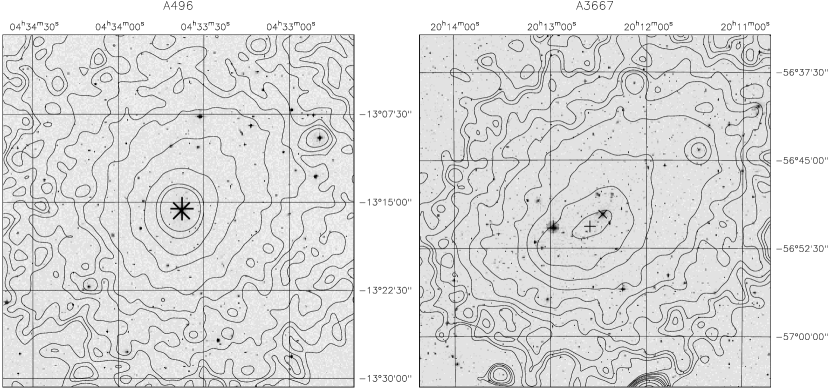
We focus on the position of a BCG in a cluster in addition to the optical luminosity of a BCG. Fig.1 shows the Digitized Sky Survey image of A496 and A3667. Overlaid contours are ROSAT/PSPC image of 0.1–2.0 keV band. The BCG of A496, which is a typical cD galaxy, MCG02-12-039, is located at the peak of the X-ray emission. On the other hand, the BCG of A3667 is located at some distance from the X-ray peak. We expect the offset of the BCG from the peak of the cluster X-ray emission to indicate how the cluster is close to the dynamical equilibrium state.
Jones & Forman (1982) proposed a classification scheme of clusters, in which clusters are categorized by the presence or absence of a cD galaxy which is giant elliptical galaxy with an extended envelop. Since cD galaxies are usually located at the center of regular, compact clusters, significant fraction of BCGs is classified as cD galaxy. Clusters containing cD galaxies are classified as X-ray dominant (XD); and those without cD galaxies are classified as non-X-ray dominant (nXD). The X-ray emissions of XD clusters are strongly peaked on the cD galaxy, while those of nXD clusters are not associated with any individual galaxy. Jones & Forman (1982) argues that this classification represents the state of cluster evolution.
The offset of the BCG from the peak of the cluster X-ray emission might be regarded as a measure for the XD or nXD categorization. We can evaluate this quantitatively. Note, however, that BCGs are not necessarily cDs under our definition.
4 Data and Analysis
We selected 61 nearby clusters from the Highest X-ray FLUx Galaxy Cluster Sample (HIFLUGCS) compiled by Reiprich (2001), and 27 distant clusters, which are gravitational lensing clusters, from Hashimotodani (1999).
Reiprich (2001) collected the gas temperatures from the literature. Hashimotodani (1999) determined the gas temperatures from the X-ray spectra obtained with ASCA. Central gas densities and core radii were determined from the ROSAT/PSPC images by Reiprich (2001) and from the ROSAT/HRI images by Hashimotodani (1999). They fitted surface brightness profiles with the conventional model,
| (4) |
where is the distance from the cluster center and is a fitting parameter.
We determined the position of the X-ray peak by analyzing ROSAT/PSPC data for nearby cluster sample and ROSAT/HRI data for distant cluster sample. HRI images were extracted from screened event files by selecting the pulse height (PI) range of 1–9 ch. The HRI images were binned with bin size of 2′′ and smoothed by a Gaussian kernel of 8–16′′. The PSPC images were extracted for PI range of 12–200 ch (energy range: 0.1–2.0 keV), binned with 4′′, and smoothed by a Gaussian of . The correction for telescope vignetting was not applied to either of the two images. We define the central position of the image bin with maximum X-ray intensity as the position of the X-ray peak. In some images where bright X-ray point sources are present, we excluded regions around the sources to explore the X-ray peak.
Positional uncertainties of the X-ray peak are determined by combining the error due to counting statistics and telescope pointing accuracy. In order to estimate the error due to counting statistics, we divided the original event list for each source into two part and repeated the same procedure, extraction and peak search, as mentioned above. The difference between the X-ray peak positions determined from two halves can be used as an estimate of the error due to counting statistics. The average statistical errors are for PSPC and for HRI. On the other hand, aspect errors which are determined by the attitude control of ROSAT are estimated from the difference between the position of an X-ray point source in the image, which is optically identified, and the same obtained from an optical data base. The average aspect errors are for PSPC and for HRI. If we take the positional error as , it corresponds to 18 kpc at the average redshift of nearby cluster sample and 75 kpc at the average redshift of distant cluster sample.
The position of BCGs were taken from the NASA/IPAC Extragalactic Database (NED)111http://nedwww.ipac.caltech.edu. We identify the BCG as the galaxy whose optical magnitude is the brightest among the cluster members. The search radius of a BCG is 15′ from the X-ray peak, which corresponds to 1.2 Mpc at the redshift of 0.05. Because the positional error of the BCGs obtained from NED is typically about 0.5′′, the error of the offset of the BCG from the X-ray peak is dominated by .
In this paper, we also see the correlation of the optical B-band magnitude of the BCG to other parameters for 26 nearby clusters. These B-band magnitudes are taken from “The Third Reference Catalogue of Bright Galaxies” by de Vaucouleurs et al. (1991).
Note that 21 nearby clusters and 5 distant clusters are not included in our analysis because of the lack of positional information of the BCG. The number of clusters remained are 40 and 22, for the nearby and the distant samples, respectively. The average redshifts are 0.05 and 0.3, and the standard deviations of the redshift distribution are 0.02 and 0.1 for each sample.
5 Results
We examine the relations between the properties of BCGs and those of their host clusters. We employ the parameter of the fundamental plane of X-ray clusters and the hot gas temperature to represent properties of cluster hot gas. The offset from the X-ray peak and the optical absolute magnitude are used to describe the properties of BCGs.
5.1 Offset of the BCG vs. parameter
The relations between the offset of the BCG from the X-ray peak and the parameter is shown in Fig.2. Filled squares and open squares represent nearby clusters and distant clusters, respectively. The offset of the BCG is larger for the smaller . The correlation coefficient is , , and for nearby, distant, and all clusters, respectively. On the other hand, the correlation of the BCG offset to another fundamental plane parameter is weaker, as shown in Fig.3. The correlation coefficient is 0.27, 0.30 and, 0.33 for each data set, respectively. As mentioned in section 2, clusters distribute on the Y-Z plane. These results imply that Z is more important than Y when we consider the BCG offset. That is the second reason for us to focus on the parameter Z. We also investigated the correlation of the BCG offset to the observational quantities , , and , obtaining the correlation coefficients of , 0.67, 0.49 for all the data, respectively. Because the parameters of the fundamental plane are the products of these quantities, it is not surprising to get similar level of the correlations to these quantities. It is noted that the hot gas temperature depends almost only on the parameter (), though we will not employ the parameter in the following subsections.
Considering the positional errors of the offset estimated in section 4, these correlations are not so tight especially for the distant clusters. However, the offset of the BCG is larger for the smaller cluster. In order to test the significance of this trend, we divide the sample into two groups; one is the large clusters (), and the other is the small clusters (). Kolmogorov-Smirnov test shows the probability that two groups have the same offset distribution are 0.0010, 0.023, and 0.00014 for the nearby, the distant, and all the clusters, respectively.
Some of the large clusters in our sample are cooling flow clusters, which are well relaxed and often show the central excess emission. We may have to consider the influence of the central cool component on our results. Fujita & Takahara (2000a) examined the nature of clusters, which have the central excess considering the inner cool component in addition to the outer component. They showed that the inner components also satisfy the same relations of the fundamental plane, though their values of are systematically larger than those of the outer components. Therefore, for some of the large clusters in which the cool component is significant, the value of in Fig.2 may shift to larger side if we consider this component. On the other hand, if the cool component reflects a local phenomenon, such as AGN activities, the ignorance of the component is justified in our study of the global properties of clusters.
If parameter represents the age of the cluster since its formation, as mentioned in the previous section this correlation indicates the offset of the BCG is smaller in an aged cluster that spends long time after its formation. If the offset of the BCG reflects deviation from the dynamical equilibrium state of the cluster, as is often assumed, this might be a natural result. However, it should be noted that the parameter is derived only from the X-ray properties and its interpretation by Fujita & Takahara (1999a) is a theoretical one. The negative correlation shown here would be an observational support for their interpretation of the parameter based on galaxy distributions.
In Fig.4, we show some images of individual clusters marked in Fig.2. The clusters (a) A754 and (b) A2256 are small Z clusters. These are typical irregular clusters, and cluster merging might be undergoing. The cluster (c) A3562 and (d) A3558 have intermediate value. The X-ray morphology of these clusters is relatively regular, though some irregularity remains at their central regions. The clusters (e) A2029 and (f) NGC5044 are large clusters, and have regular morphology even at the central region, indicating that these cluster are well relaxed system.
We expect that small Z clusters can evolve into large Z clusters through dynamical relaxation. The time scale of the evolution is difficult to evaluate, however, we can provide its rough estimate by comparing the crossing time of a cluster galaxy and the offset of the BCG observed. The crossing time of a cluster galaxy is written as
| (5) |
where is the distance from a cluster galaxy to cluster center, is the radial velocity, and is the radial velocity dispersion. Therefore, the evolution time scale of about 1 Gyr is implied. Investigation of a large number of distant clusters with Chandra or XMM-Newton might enable us to study whether the offset of the BCG is larger for distant clusters.
5.2 Optical magnitude of the BCG vs. hot gas temperature
We next examine the correlation between the hot gas temperature and the optical magnitude of the BCG. As mentioned in section 4, we restrict the data of 26 nearby clusters here. As shown in Fig.5, it is found that the BCGs are brighter in higher gas temperature clusters with a correlation coefficient of 0.52. A similar correlation was found by Edge (1991), though the scatter of the optical absolute magnitude is 0.35 in their case, smaller than ours (0.62).
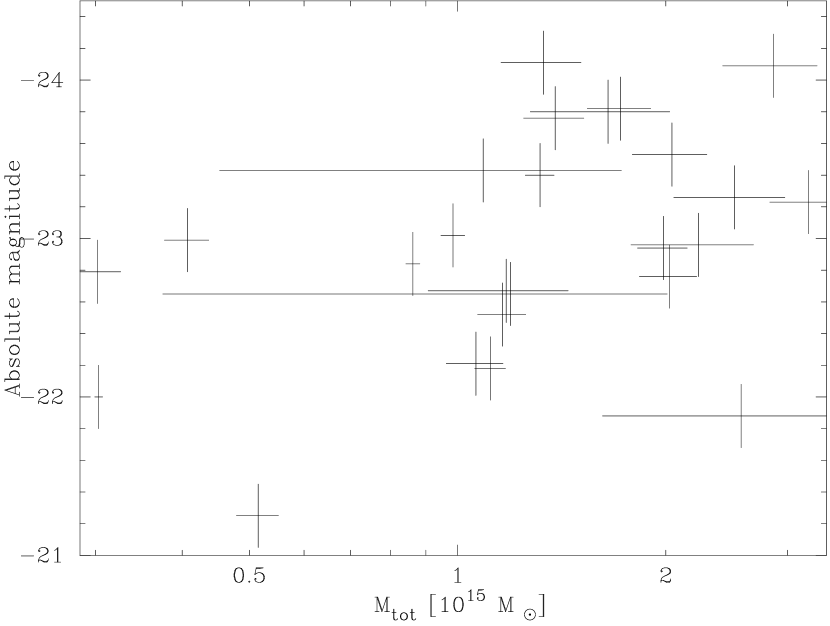
Simple arguments based on virial theorem suggest that the mass of a cluster is simply related to the cluster temperature as . Thus, the correlation shown in Fig.5 implies that the optical magnitude of the BCG may also be correlated with the mass of a cluster. Fig.6 shows the relation between the optical magnitude of the BCG and the total mass of cluster. The total mass is the integrated mass within the radius of 5 Mpc. Although the correlation is weaker than that to the temperature (correlation coefficient is 0.43), larger mass clusters are tend to have brighter BCGs. This suggests that larger BCGs are formed in the clusters that have deeper potential.
Note that some authors found the similar correlation between the X-ray luminosity, which is related to the cluster temperature, and the optical magnitude of the BCG (e.g Collins & Mann, 1998; Burke et al., 2000). Brough et al. (2002), however, show that this correlation disappears at , although they use the K-band magnitude of the BCG. The B-band magnitude is related to the star formation in BCGs. The correlation between the B-band magnitude and the cluster temperature may suggest another possibility that more stars are formed in the BCG of higher temperature cluster. We need further investigation for this correlation.
5.3 Optical magnitude of the BCG vs. parameter
In Fig.7, the optical magnitude of the BCG is plotted against the parameter . There is not a significant correlation between these two parameters. The correlation coefficient is 0.10. The parameter is interpreted as an indicator of cluster age. Thus, this result suggests that the optical magnitude of the BCG is not mainly determined by the age of their host clusters. Among the three models on the origin of the BCG mentioned in Dubinski (1998), the cooling flow model and the galactic cannibalism model expect that the extreme luminosity of the BCG is mainly governed by the evolution of their host clusters. On the other hand, in the galaxy merging model, the huge BCG luminosity is determined in the early history of the cluster evolution. The result here is more favorable to the galaxy merging model than the other two models.
5.4 Relation between the BCG and the virial density
As shown in section 2, the parameter is closely related to the virial density of a cluster. We therefore expect similar correlations when we employ the virial density as a parameter instead of parameter . Under the assumption that the virial radius and virial temperature are proportional to the core radius and gas temperature, we can obtain the virial density from observable quantities. From equation (1), and
| (6) |
we obtain
| (7) |
where and are assumed following Fujita & Takahara (2000b). In Fig.8, the offset and optical magnitude of the BCG are plotted against the virial density. The correlation coefficients are -0.54 and 0.06 for the offset and optical magnitude of the BCG, respectively, confirming that the virial density acts similarly as the parameter .
6 Summary and Discussion
We have investigated the properties of BCGs and their host clusters. The offset of the BCG from the X-ray peak has a negative correlation to the parameter of the fundamental plane of X-ray clusters. Because the parameter is interpreted as an indicator of cluster age since its collapse, and the offset of the BCG from the cluster center can be regarded as a good measure of deviation from the dynamical equilibrium state of a cluster, this correlation tracks the evolution history of the sample clusters. Furthermore, since the interpretation of the parameter as the cluster age by Fujita & Takahara (1999a) is theoretical one regarding the hot gas properties of clusters, the correlation to the offset of the BCG is an observational support to their interpretation. We also find a correlation between the cluster temperature and the optical magnitude of the BCG for nearby clusters, as was found by Edge (1991). On the other hand, there is not a significant correlation among the optical magnitude of the BCG and the parameter .
What do these results imply on the origin of BCGs? The offset of the BCG from the X-ray peak surely reflects deviation from the dynamical equilibrium state of the cluster and decreases according to the cluster evolution, which is tracked by the parameter . On the other hand, the optical luminosity of the BCG does not have significant correlation to the parameter . These two facts favors the view that the large luminosity of the BCG is determined prior to or during the early history of cluster formation. If the large luminosity of the BCG is mainly acquired in the course of cluster evolution, we expect some correlation between the optical luminosity of the BCG and the parameter . Among the three models mentioned in Dubinski (1998), therefore, the galaxy merging model in the early history of cluster formation is more favorable than the cooling flow model or the galactic cannibalism model.
The cooling flow model implies the formation of new stars, but there is a weak evidence for the star formation by cooling flow (McNamara & O’Connell, 1989). Furthermore, recent X-ray observations by XMM-Newton showed that the X-ray emission from cooler gas is much lower than expected from standard cooling flow models (Tamura et al., 2001; Peterson et al., 2001). This might imply that there is a heating mechanism that prevents the ICM from radiative cooling. On the other hand, detailed study of the galactic cannibalism model shows that expected amount of accreted luminosity falls short by an order of magnitude to account for the BCG luminosity, since the dynamical friction time scales of galaxies are too long (Merritt, 1985). As demonstrated by Dubinski (1998) with his N-body simulation of a cluster in a hierarchical cosmological model, central galaxy is formed through the merger of several massive galaxies early in the cluster’s history. If we consider that the total mass of a cluster reflects the initial fluctuation of the universe, it may not be strange that larger BCGs are formed at the bottom of deeper potential of cluster size.
Since the significant fractions of BCGs are cD galaxies, the luminosities of cD galaxies should be also determined prior to or during the early history of cluster formation. However, Dubinski (1998) suggests that the extended envelop of a cD galaxy is not created by the galaxy merging in the early history of cluster formation. The envelop might be formed by different process like a tidal stripping.
If BCGs have an earlier origin than their host clusters, we might have a
chance to observe a luminous galaxy which was formed before cluster
collapse and their host clusters are not formed yet. Vikhlinin et al. (1999)
found X-ray overluminous elliptical galaxies (OLEGs) with ROSAT, which
are luminous galaxies comparable to cD galaxies, but have no detectable
galaxies around them. OLEGs thus might be a candidate of such pre-BCG
galaxies. Although extended envelops are not also detected in OLEGs, the
envelop might be formed when an OLEG evolves into a cluster of galaxies.
H. K. is supported by JSPS Research Fellowship for Young Scientists. Y. F. was supported in part by a Grant-in-Aid from the Ministry of Education, Science, Sports, and Culture of Japan (14740175).
References
- Brough et al. (2002) Brough, S., Collins, C. A., Burke, D. J., Mann, R. G., & Lynam, P. D. 2002, MNRAS, 329, L53
- Burke et al. (2000) Burke D. J., Collins C. A., Mann R. G., 2000, ApJ, 532, L105
- Collins & Mann (1998) Collins C. A., Mann R. G., 1998, MNRAS, 297, 128
- de Vaucouleurs et al. (1991) de Vaucouleurs, G., de Vaucouleurs, A., Corwin, H. G., Buta, R. J., Paturel, G., & Fouque, P. 1991, Volume 1-3, XII, 2069 pp. 7 figs.. Springer-Verlag Berlin Heidelberg New York,
- Dressler (1978) Dressler, A. 1978, ApJ, 222, 23
- Dubinski (1998) Dubinski, J. 1998, ApJ, 502, 141
- Edge & Stewart (1991) Edge, A. C. & Stewart, G. C. 1991, MNRAS, 252, 428
- Edge (1991) Edge, A. C. 1991, MNRAS, 250, 103
- Fabian (1994) Fabian, A. 1994, ARA&A, 378, 496
- Fujita & Takahara (1999a) Fujita, Y., & Takahara, F. 1999a, ApJ, 519, L51
- Fujita & Takahara (1999b) Fujita, Y., & Takahara, F. 1999b, ApJ, 519, L55
- Fujita & Takahara (2000a) Fujita, Y., & Takahara, F. 2000a, PASJ, 52, 317
- Fujita & Takahara (2000b) Fujita, Y., & Takahara, F. 2000b, ApJ, 536, 523
- Jones & Forman (1982) Jones, C. & Forman, W. 1982, IAU Symp. 97: Extragalactic Radio Sources, 97, 97
- Hashimotodani (1999) Hashimotodani, K. 1999, Ph.D. Thesis, Osaka University
- Merritt (1985) Merritt, D. 1985, ApJ, 289, 18
- McNamara & O’Connell (1989) McNamara, B. R. & O’Connell, R. W. 1989, AJ, 98, 2018
- Ostriker & Hausman (1977) Ostriker, J., & Hausman, M. 1977, ApJ, 217, L125
- Peterson et al. (2001) Peterson, J. R. et al. 2001, A&A, 365, L104
- Reiprich (2001) Reiprich, T. H. 2001, Ph.D. Thesis, Ludwig-Maximilians-Universität München
- Salvador-Sole, Solanes, & Manrique (1998) Salvador-Sole E., Solanes J. M., Manrique A., 1998, ApJ, 499, 542
- Schombert (1987) Schombert, J. M. 1987, ApJS, 64, 643
- Schombert (1988) Schombert, J. M. 1988, ApJ, 328, 475
- Tamura et al. (2001) Tamura, T. et al. 2001, A&A, 365, L87
- Vikhlinin et al. (1999) Vikhlinin, A., McNamara, B. R., Hornstrup, A., Quintana, H., Forman, W., Jones, C., & Way, M. 1999, ApJ, 520, L1