Influence of geometry in the delayed detonation model of SNIa
Abstract
We present several hydrodynamical simulations of thermonuclear supernovae dealing with multiple delayed detonations. The calculations were carried out in three dimensions, making possible to study the influence of geometry of the flame front in two aspects. First, the evolution of its fractal dimension during the deflagration phase has been followed until a critical value is reached such that the deflagration may turn into a detonation. Second, as the resulting detonation could probably be scattered through the flame, the effect of its initial location on the detonation propagation, final energetics and nucleosynthesis has been explored.
1 Flame acceleration: from very subsonic to (maybe) supersonic combustion rate
The study about how a white dwarf is disrupted by a thermonuclear explosion, giving rise to a Type Ia Supernovae, is a hot topic in theoretical astrophysics. Taking as starting point a carbon-oxygen white dwarf near the Chandrasekhar-mass limit current models must face two crucial questions: where the initial carbon runaway starts? and, once switched on, how does combustion propagate through the volume of the white dwarf? The first question is related with the conditions settled in the convective core prior the explosion and will not be adressed here. The second question has deserved a lot of work during many years. In the last decade there has been a considerable theoretical advance owing to the increasing feasibility to carry calculations in more than one dimension and also because many useful ideas have been borrowed and adapted from the terrestrial combustion research. The central point in any modelization is how to accelerate the combustion from its subsonic laminar value at the beginning (, being the local sound speed) to a maximum value, around before the expansion quenches the nuclear energy input. It is today widely accepted that hydrodynamical instabilities are the physical agent responsible for combustion acceleration by increasing enormously the effective heat exchange area between fuel and ashes.
To some extent flame propagation becomes a problem of geometry. The ratio between the actual corrugated flame surface,, and the equivalent spherical surface encompassing the same volume can be written as:
| (1) |
where is the mean radius of the burned zone, is the microscopic laminar velocity of the flame tw92 , is the fractal dimension of the effective surface and k is a scaling exponent which links the maximum and minimum scalelengths with the corresponding velocity fluctuations at these scales. For example, for Kolmogorov turbulence is k=3 and the minimum lengthscale , called the Gibson length in combustion theory is . An interesting limiting case takes place for , then the effective combustion velocity becomes independent of . This behaviour has been observed in terrestrial experiments dealing with turbulent chemical flames in the corrugated regime where . In the context of supernovae there are more physical mechanism affecting the flame surface other than turbulence but the above statement still approximately holds k95 . This result opens a way to model the explosion by simply substituing the laminar velocity by another one,, high enough as to rise to the level of resolution of the hydrocode. The adoption of such baseline velocity , instead of is equivalent to have a subgrid below the level of resolution of the code (see Sect. 2).
The above picture gives a combustion front which moves very subsonically at the beginning, when instabilities are not so strong, but rapidly accelerates when instabilities plenty develop. However, in order to get the adequate explosion energetics and synthesize a substantial amount of intermediate-mass elements the effective front velocity must reach a quite high value, km.s-1 once the density at the front location declines below g.cm-3. Multidimensional models based on pure deflagrations have traditionally had some difficulty to obtain such precise effective velocity profile, especially at low densities (but see J. Niemeyer this volume). One way to cure this drawback is to turn the deflagration into a supersonic detonation at late times, as many one-dimensional models have shown k91 . Even though the physical mechanism driving such transition has not been found yet it could be related to two possible causes: 1) spontaneous burning of a critical mass of carbon when combustion enters in the distributed regime nw97 ; kow97 , 2) an effective velocity exceeding the maximum value for a Chapman-Jouguet (CJ) deflagration to be stable nw97 ; bgs94 . Although it is not evident that the CJ limit, strictly defined for planar fronts, is extrapolable to different geometries using the effective velocity instead the laminar one we have adopted this second possible mechanism in order set a practical criteria to select those points of the flame which turn into a detonation.
Up to now there are very few multidimensional calculations dealing with the delayed detonation scenario bgs94 ; l99 . Two dimensional simulations l99 are enforced to detonate carbon in a single region located near the singularity axis. Full three-dimensional calculations are, however, desirable because their ability to handle multipoint ignitions and better representing the important previous deflagration phase. When calculated in three dimensions the detonation trajectories can be significatively altered by the irregular distribution of fuel and ashes set in the deflagration phase and by the detonation-detonation and detonation-deflagration wave interactions. As these effects will affect the outcome of the explosion it is worth to make a first exploration of this scenario.
2 Method of calculation and models
The simulations were carried out using the SPH technique adapted to handle both steady thermal waves (flames) and shocks (detonations)gsbs98 . We included a realistic physics: EOS consisting of relativistic partially degenerated electrons with pair corrections, ions as ideal gas plus Coulomb corrections and radiation. The nuclear part is a small nuclear network of 9 nuclei from helium to nickel, wherever the temperature exceeded five billion degrees the material is isochorically processed to the nuclear statistical equilibrium, electron captures were allowed in this regime. Detailed nucleosynthesis was calculated by postprocessing the output of the hydrodynamics of each model.
The advance of the flame in the deflagration stage was simulated by expanding the flame thickness (much lesser than 1 cm!) to the actual resolution of the code (several dozens of km) by adequately rescaling the actual microscopic conductivity and nuclear energy rate in the energy equation. In addition, ellipsoidal kernels were used in the detonation phase in order to increase the resolution in this regime, typically an improvement between 2-3 is achieved.
The initial model is an isothermal white dwarf of M⊙ and g.cm-3 in hydrostatic equilibrium. The first stages of the explosion were followed by using a one-dimensional Lagrangian code until the central density declined to g.cm-3. At this point the structure was mapped to a 3D distribution of 250,000 particles, and the velocity field around the flame contour perturbed by a sample of 20 sinusoidal functions of different amplitude and wavelength. Afterwards the evolution was followed with the SPH code.
During the progression of the calculation the geometrical features of the flame front were tracked by calculating the main scaling parameters of the surface such as , using the method described in gsbs98 . The value of can be used to set the baseline velocity . In principle an optimum value can be found by solving the equation , where is the smoothing length parameter. Even though is a time-dependent local quantity we have found that, on average, a constant value of km.s-1 is enough to move (or equivalently the Gibson length, ) to the coarse resolution of the SPH code.
| t | Total energy | ||||
|---|---|---|---|---|---|
| seconds | |||||
| 1.54 | 0.52 | 0.18 | 0.27 | 0.65 | 0.07 |
2.1 Deflagration phase


The spherical symmetry was kept during the first half of second of the evolution, the flame moving with , almost the laminar value near the center. Afterwards the typical fingers of the Rayleigh-Taylor instability in the linear regime developed. When t=0.7 s the effective velocity and the nuclear rate input began to increase (Figs. 1,2). After one second the front displayed the mushroom like shape characteristic of the non-linear regime. At approximately t=1.1 s the nuclear energy input reached a maximum of ergs/s, the effective velocity of the front being . A maximum value of was reached at t=1.41 s. From here on the effective velocity declined owing to the expansion. The main features at the end of this phase are summarized in Table 1.
| Model | Detonation criteria | ||||
|---|---|---|---|---|---|
| at g.cm-3 | |||||
| A | D | 0.75 | 0.54 | 0.34 | 0.16 |
| B | r cm | 0.48 | 0.43 | 0.48 | 0.1 |
| C | 0.51 | 0.42 | 0.45 | 0.14 | |
| D | 0.33 | 0.34 | 0.57 | 0.09 |
The evolution of the fractal dimension is also shown in Fig. 1. After an initial period where the fractal dimension of the flame surface remained very close to two it rapidly increased for s. At that time the averaged density of the flame dropped below g.cm-3. After t=1.1 s the fractal dimension rose slowly until a value , similar to that associated with the RT instability in the non-linear regime, .


2.2 Detonation phase
When g.cm-3 the flame surface was rather complex, displaying many regions with high fractal dimension. In fact, a multifractal analysis showed that of the mass within the flame had . A high value of means that the local effective velocity of the front is higher than the average value of making possible the transition to a detonation by the second mechanism commented in Sect. 1. A rough estimation of the minimum fractal dimension needed to exceed the Chapman-Jouguet limit was given in bgs94 where it was assumed that turbulence () dominates in those scalelengths not directly resolved by the hydrocode. According to that analysis, a fractal dimension when g.cm-3 could make possible the transition. We took this criteria as a procedure to pick up the points of the flame prone to turn into a detonation in Model A of Table 2, our main calculation. In models B, C, D we explore the influence of the altitude in the outcome of the model by artificially detonating all the mass within the flame at different radii.
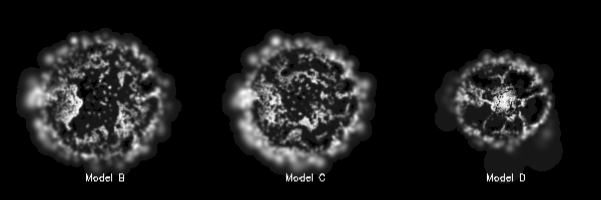
Model A gave an acceptable SNIa model, as can be seen in Table 2 and Fig. 2b. The resulting explosion energy was a little weak but not bad and the amount is enough to power the light curve. The final abundance of intermediate-mass elements was right although they showed a large spread in velocity space as can be seen in Fig. 2. Nevertheless there remained M⊙ of unburnt carbon and oxygen chiefly due to both, the shielding effect of the ashes produced during the deflagration phase and the degradation of the resolution when detonation propagates in the low-density regions. The detonation altitude largely influences the outcome of the explosion as shown in Table 2 and Fig. 3. Models B and C were not totally unsatisfactory but Model D was clearly bad, the explosion was too weak and an unacceptable amount of unburnt was left even at the center of the white dwarf (Fig. 3).
3 Conclusions
The explosion of a Chandrasekhar-mass white dwarf has been simulated in three dimensions. The adopted explosion mechanism was a deflagration followed by multiple detonations when the mean density of the flame front declined below g.cm-3. In addition the dependence of the main observables of the explosion against the geometrical location of the initial detonating spots has been explored. Our best model (model A of Table 2) is an acceptable model for Type Ia Supernovae albeit the explosion was a little weak. A relevant feature is that either as well as intermediate-mass elements showed a large dispersion in velocity space. A negative point was the large amount of unburnt carbon and oxygen which were left in isolated pockets. The sensitivity of the outcome on the initial detonation distribution is strong, as discussed in Sect. 2. This fact relies in the irregular distribution of fuel and ashes settled by the initial deflagration and may provide a natural way to explain the Type Ia supernovae diversity.
There is still needed a lot of work to confirm or reject the delayed detonation scenario. In particular asynchronous multipoint detonations with more resolution must be attempted to shape the model. On the other hand there are some expectatives that deflagration models dealing with active turbulence could also give right models for thermonuclear supernovae without invoking detonations (J.Niemeyer and Bravo and García-Senz this volume). For the time being it is necessary to investigate both mechanisms.
This work has been benefited from the MCYT grants EPS98-1348 and AYA2000-1785 and by the DGES grant PB98-1183-C03-02.
References
- (1) F.X. Timmes and S.E. Woosley: ApJ 396, 649 (1992)
- (2) A.M. Khokhlov: ApJ 449, 695 (1995)
- (3) A.M. Khokhlov: A&A 245, 114 (1991)
- (4) J. Niemeyer and S.E. Woosley: ApJ 475, 740 (1997)
- (5) A.M. Khokhlov, E.S. Oran and J.C. Wheeler: ApJ 478, 678 (1997)
- (6) E.Bravo, D. García-Senz:’Asymmetrical delayed detonation from a 3D hydrosimulation of a white dwarf explosion’. In Cosmic Chemical Evolution. Proceedings of the 187th Symposium of the IAU, Kyoto, ed. by K. Nomoto and J.W.Truran (Dordrecht: Kluwer Academic Publishers, 2002), p220
- (7) E. Livne: ApJ 527, L97 (1999)
- (8) D.García-Senz, E. Bravo., N. Serichol: ApJSS 115, 119 (1998)