How many arcminute-separation lenses are expected in the 2dF QSO survey?
Abstract
Wide separation lensing statistics offer information about the density profile and abundance of dark halos. Recently a possible discovery of six quasar pairs, which may be lensed multiple images, was reported by Miller et al. (2003). These pairs are selected from a catalog of the 2dF quasar (QSO) survey comprising 22163 quasars. We calculate expected numbers of lensed quasars taking account of the redshift and magnitude distributions of the quasar catalog. Given some of the six pairs are genuine lensed systems, we put interesting constraints on the inner slope of dark halos, , and . We show that the detection of even one lens with separation is marginally consistent with models that have cuspy inner density profile, , and very large , for . To reconcile with constraints from X-ray clusters or cosmic shear, much lower and much higher are needed, although such high seems too extreme. The shallower inner density profile is hardly acceptable. In particular, the expected number of lenses with separation is too small to explain the discovery of such anomalously wide separation lens systems. These results imply that we miss some important systematic effects, there is a problem in the cold dark matter scenario, or none of these six quasar pairs is likely to be lensed images.
keywords:
cosmology: theory — dark matter — galaxies: clusters: general — gravitational lensing1 Introduction
The Cold Dark Matter (CDM) scenario predicts the existence of cuspy dark halos, and thus is expected to produce significant numbers of wide separation lenses (). Statistics of such wide separation lenses are known to be a powerful tool to probe the abundance (Narayan & White, 1988; Kochanek, 1995) and the density profile of dark halos (Maoz et al., 1997; Wyithe, Turner, & Spergel, 2001; Keeton & Madau, 2001; Sarbu, Rusin, & Ma, 2001; Takahashi & Chiba, 2001; Li & Ostriker, 2002; Oguri, 2002). Although a number of radio surveys has tried, they could not find wide separation lensed quasars (e.g., Phillips, Browne, & Wilkinson, 2001a, b; Ofek et al., 2001, 2002). The lack of wide separation lenses, however, does not conflict with the CDM scenario because the expected lensing rate is significantly smaller than that of small separation lensing ().
Recently, Miller et al. (2003) reported that they found six quasar pairs which may be lensed multiple images in the 2dF quasar (QSO) catalog comprising 22163 quasars, although the number of lensed quasars may be even larger than this because they have done follow-up for only 11 quasar pairs among 38 quasars selected as possible lens candidates. These systems were identified to be lensed images from the detailed comparison of quasar spectra. The separations of all these quasar pairs are larger than , and the separations of some pairs reach even . If this surprising result is true, it offers a lot of information about dark halos. In this Letter, we calculate the expected number of arcminute-separation lenses () in the 2dF QSO survey. We use the realistic density profile predicted in the CDM scenario, and take account of the redshift and magnitude distribution of the quasar catalog. Therefore our results can be directly compared with the observation. We show that the existence of such wide separation lenses in the 2dF QSO catalog is marginally consistent with the “concordance” cosmology if the value of only is very large, for . This means that we can strongly constrain dark halo properties if some of quasar pairs reported by Miller et al. (2003) are truly gravitational lens systems. Throughout the paper, we assume a flat universe and .
2 Calculation of Probability Distributions
The lensing probability distribution at wide separation reflects the properties of dark halos, rather than galaxies (Nakamura & Suto, 1997; Keeton, 1998; Oguri, 2002). The halo density profiles predicted by recent N-body simulations may be parameterized as a one-parameter family, the generalized NFW profile (Zhao, 1996; Jing & Suto, 2000):
| (1) |
where is a critical density at . While the correct value of is still unclear, the existence of a cusp with has been established in recent N-body simulations (Navarro, Frenk, & White, 1996; Moore et al., 1999; Jing & Suto, 2000; Fukushige & Makino, 2001). For definiteness, in this paper we consider two cases, and , which cover the range of the CDM predictions. The scale radius is related to the concentration parameter . Then the characteristic density is given in terms of the concentration parameter (see e.g., Oguri, Taruya, & Suto, 2001). The lens equation of the generalized NFW profile has three solutions if , where is the position of a source in the source plane and is a radius of the radial caustic in the source plane. The image separation is defined between the outer two solutions and is approximated as , where is a radius of the tangential critical curve in the lens plane, denotes the angular diameter distance from the observer to the lens plane, and and indicate the redshifts of the source and lens, respectively.
The concentration parameter is one of the most important parameter in the generalized NFW density profile (eq. [1]). In numerical simulations, it has been found that the concentration parameter depends on the mass and redshift of halos (e.g., Bullock et al., 2001). Moreover, it shows considerable scatter which reflects the difference in the formation epoch (Wechsler et al., 2002). The scatter in the concentration parameter is well described by a log-normal distribution. For the median of concentration parameter , we adopt the mass and redshift dependence reported by Bullock et al. (2001):
| (2) |
Note that this fitting form is slightly different from the one Bullock et al. (2001) originally proposed, and is correct at . A factor in equation (2) gives a natural way to generalize (Keeton & Madau, 2001; Jing & Suto, 2002). The scatter of the concentration parameter is also important element in gravitational lens statistics (Keeton & Madau, 2001). We adopt the value which has been obtained from N-body simulations (Jing, 2000; Bullock et al., 2001; Wechsler et al., 2002; Jing & Suto, 2002).
The probability that a source at redshift and having the absolute luminosity is observed as multiply lensed system with separation larger than is given by
| (3) | |||||
where is the magnification bias (Turner, 1980):
| (4) |
with being the luminosity function of sources. The lensing cross section is simply given by the area encompassed by the radial caustic, , where indicates the angular diameter distance from the observer to the source plane. The lower limit of mass integral is related to as . The magnification bias (eq. [4]) should be calculated for the faintest of the two images, because both lensed images must appear above the flux limit of the 2QZ survey (Miller et al., 2003). We use an approximation of the magnification factor which was derived by Oguri et al. (2002).
Since wide separation lenses with are considered to be generated by massive clusters, we should choose the mass function of dark halos ( in eq. [3]) carefully. We adopt equation (B3) of Jenkins et al. (2001) which well agrees with simulated high-mass halo abundance (Evrard et al., 2002; Komatsu & Seljak, 2002; Hu & Kravtsov, 2003; Pierpaoli et al., 2003). Note that should be used as the mean overdensity when one adopts this mass function.
3 Quasar Catalog
To make a precise prediction which can be directly compared with observed lensing rate, we must properly take account of the redshift and magnitude distributions. Since the whole sample used to search lensed quasars is not publicly available, we instead use the 2dF 10k catalog comprising quasars (Croom et al., 2001) which is a part of the whole sample. Then predicted numbers of wide separation lensing are calculated as follows. First, from the catalog we extract the numbers of quasars which are located and have magnitude . We use and . The average probability that quasars are lensed with separations larger than is then given by
| (5) |
where is the -band absolute luminosity corresponds to . When the quasar continuum spectrum is described by a power law, , the K-correction can be approximated as . We assume to calculate the K-correction. The total number of lensed quasars expected in the 2dF QSO survey is
| (6) |
where is the total number of quasars in the whole sample.
The luminosity function of quasars is needed to compute magnification bias. We adopt the double power law luminosity function:
| (7) |
We assume pure luminosity evolution models with , and use a best-fitting model which was derived by Boyle et al. (2000) in the universe: , , , , and .
4 Results
4.1 Numbers of Lenses

First we plot the predicted number distribution of image separation in the 2dF QSO survey in Figure 1. The cases that the density profile of lens objects is described by the Singular Isothermal Sphere (SIS) are also shown for reference. The value of has been constrained from X-ray clusters or cosmic shear, but resultant values show discrepancies among papers, ranging from to for (e.g., Pierpaoli et al., 2003). Therefore we plot both and models. Figure 1 clearly indicates that the predicted numbers of lenses strongly depend on both density profile () and the abundance () of dark halos. In particular, numbers of arcminute-separation lensed quasars are highly sensitive to because such very wide separation lenses are mainly produced by massive clusters. We find that expected numbers of lensed quasars with image separation larger than is quite small, , while 4 quasar pairs which are likely to be lensed were found (Miller et al., 2003). We further find that even an “extreme” model with and can produce only lenses with on average. On the other hand, less wide separation lenses () may be statistically possible if both and are large.
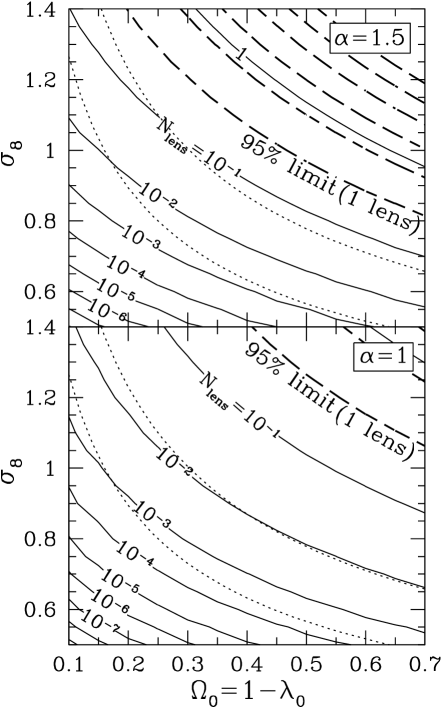
To see what constraint can be put from the detection of wide separation lenses, in Figure 2 we plot contours of in the - plane. We also plot constraints from the observed number of lenses assuming that some of six pairs reported by Miller et al. (2003) are true lens systems. These constraints are calculated from the Poisson distribution , where is the observed number and is the expectation. Given the numbers of true lenses range from to , the lower limits of (95% confidence level) become , , , , , and , respectively. This figure indicates that the detection of even one lens with in the 2dF QSO catalog needs very high , for and . Our constraint and constraints from X-ray clusters or cosmic shear which are approximated as (see e.g., Pierpaoli et al., 2003) shows marginal agreement if , , and , although this solution seems too extreme. In particular, models with are hardly acceptable because they need unusually high or in order to produce lenses with . However, this result is somewhat embarrassing because the lack of wide separation lensing in other surveys (e.g., Phillips, Browne, & Wilkinson, 2001a, b; Ofek et al., 2001, 2002) already puts the upper limit of the lensing rate. For instance, our model with , , and predicts a lensing rate at which is marginally consistent with the upper limit of the lensing rate in Phillips et al. (2001b), at 95% confidence limit.
Note that these constraints are for the case that only one of six quasar pairs is a genuine lens system; if the number of lenses is more than one, the situation becomes worse. In this case, the discrepancy between strong lensing constraints and X-ray/shear constraints becomes more serious. Moreover, this result may conflict with other surveys which could not detect wide separation lenses.
4.2 Theoretical Uncertainties
| Model | ||
|---|---|---|
| Fiducial Model | ||
| Press & Schechter MF | ||
| Sheth & Tormen MF | ||
| Croom et al. LF |
We also examine possible theoretical uncertainties except for the uncertainties of the density profile and cosmological parameters. More specifically, we examine the uncertainties of the halo mass function and the quasar luminosity function. The result is summarized in Table 1. First we adopt the mass functions of Press & Schechter (1974) and Sheth & Tormen (1999) and see how the number of lensed quasars changes. We find that the uncertainty of the mass function is fairly large. In particular, the mass function of Sheth & Tormen (1999) predicts more than three times as large number of lenses with as our fiducial model. This is because the mass function of Sheth & Tormen (1999) seems to overestimate the number density of massive halos (Jenkins et al., 2001; Hu & Kravtsov, 2003). Moreover, we point out that the number of anomalously wide separation lenses () is much more sensitive to the choice of the mass function. Therefore, in the statistics of such anomalously wide separation lenses the uncertainty of the mass function should be carefully examined.
Since the magnification bias is sensitive to the slope of adopted quasar luminosity function, next we examine the uncertainty of the quasar luminosity function using the luminosity function from the 10k catalog (Croom et al., 2001). This luminosity function has somewhat shallower slopes, and , compared with our fiducial model. We find that this uncertainty is less than factor 2 and is not so large as to change our main results, because , , and can change the number of wide separation lenses by orders of magnitude.
4.3 Expected Time Delays between Images

The main drawback of wide separation lensing statistics is that it is hard to recognize quasar pairs as gravitational lens systems due to large time delays between images; any spectrum change within the timescale of differential time delays may prevent one from selecting such systems as lens candidates. We show conditional probability distributions of time delays proposed by Oguri et al. (2002) in Figure 3. We find that the dependence of time delays on the density profile is weak when the separation is large, although this tendency was already shown by Oguri et al. (2002). They also concluded that time delay probability distribution is insensitive to cosmological parameters. Figure 3 suggests that lenses with even smaller separations, , are likely to have time delays larger than ten years which may be typical time scale forming the broad absorption line (Ma, 2002). Therefore, to assert quasar pairs as lensed images, one must compare spectral signature which would be unchanged within possible time delays. Needed time scales are for and for . We note that the information of flux ratio and the central core image may become one of the evidence of gravitational lensing (Rusin, 2002).
5 Summary
In this paper, we have calculated the predicted numbers of arcminute-separation () lensed quasars in the 2dF QSO survey. We have presented realistic predictions based on the CDM scenario taking account of the redshift and magnitude distributions of the quasar catalog. Detailed comparison between theoretical and observed numbers of lensed quasars indicates that the detection of wide separation lenses puts interesting constraints on the density profile and abundance of dark halos. The case that only one of six pairs is genuine lens system is marginally consistent with the model that has cuspy inner density profile and the large value of , for . To reconcile this result with X-ray or shear measurement, much smaller () and much larger () are needed. Our result of this large is similar to that of the Sunyaev-Zel’dovich angular power spectrum, (Komatsu & Seljak, 2002). We have found also that it is quite hard to produce lenses with separation . Thus a conservative interpretation of this observation is that none of these quasar pairs is lensed. But if it turns out that some of these quasar pairs are genuine lens systems, we can put interesting constraints on not only the density profile of dark halos but also the and that are somewhat different from X-ray/shear constraints. We note that the number of genuine lens systems may be significantly larger than six which Miller et al. (2003) reported because only 11 of 38 candidates has been observed spectroscopically. However, such anomalously high lensing rate cannot be reproduced by even the most optimistic models. In this case, we have to examine whether we miss some important systematic effects which increase lensing rates. One possible systematic effect is the asymmetry of lensing halos, although this effect has been considered to be small so far. In any case, statistics of wide separation lensing offer a promising way to probe the abundance and density profile of dark halos.
Acknowledgments
The author would like to thank Yasushi Suto and Naohisa Inada for useful discussions and comments.
References
- Boyle et al. (2000) Boyle, B. J., Shanks, T., Croom, S. M., Smith, R. J., Miller, L., Loaring, N., Heymans, C. 2000, MNRAS, 317, 1014
- Bullock et al. (2001) Bullock, J. S., Kolatt, T. S., Sigad, Y., Somerville, R. S., Kravtsov, A. V., Klypin, A. A., Primack, J. R., Dekel, A. 2001, MNRAS, 321, 559
- Croom et al. (2001) Croom, S. M., Smith, R. J., Boyle, B. J., Shanks, T., Loaring, N. S., Miller, L., Lewis, I. J. 2001, MNRAS, 322, L29
- Evrard et al. (2002) Evrard, A. E., et al. 2002, ApJ, 573, 7
- Fukushige & Makino (2001) Fukushige, T., Makino, J. 2001, ApJ, 557, 533
- Hu & Kravtsov (2003) Hu, W., Kravtsov, A. V. 2003, ApJ, in press (astro-ph/0203169)
- Jenkins et al. (2001) Jenkins, A., Frenk, C. S., White, S. D. M., Colberg, J. M., Cole, S., Evrard, A. E., Couchman, H. M. P., Yoshida, N. 2001, MNRAS, 321, 372
- Jing (2000) Jing, Y. P. 2000, ApJ, 535, 30
- Jing & Suto (2000) Jing, Y. P., Suto, Y. 2000, ApJ, 529, L69
- Jing & Suto (2002) Jing, Y. P., Suto, Y. 2002, ApJ, 574, 538
- Keeton (1998) Keeton, C. R. 1998, Ph. D. thesis, Harvard Univ.
- Keeton & Madau (2001) Keeton, C. R., Madau, P. 2001, ApJ, 549, L25
- Kochanek (1995) Kochanek, C. S. 1995, ApJ, 453, 545
- Komatsu & Seljak (2002) Komatsu, E., Seljak, U. 2002, MNRAS, 336, 1256
- Li & Ostriker (2002) Li, L. X., Ostriker, J. P. 2002, ApJ, 566, 652
- Ma (2002) Ma, F. 2002, MNRAS, 335, L99
- Maoz et al. (1997) Maoz, D., Rix, H.-W., Gal-Yam, A., Gould, A. 1997, ApJ, 486, 75
- Miller et al. (2003) Miller, L., Lopes, A. M., Smith, R. J., Croom, S. M., Boyle, B. J., Shanks, T., Outram, P. 2003, MNRAS, submitted (astro-ph/0210644)
- Moore et al. (1999) Moore, B., Quinn, T., Governato, F., Stadel, J., Lake, G. 1999, MNRAS, 310, 1147
- Nakamura & Suto (1997) Nakamura, T. T., Suto, Y. 1997, Prog. Theor. Phys., 97, 49
- Narayan & White (1988) Narayan, R., White, S. D. M. 1988, MNRAS, 231, 97P
- Navarro et al. (1996) Navarro, J. F., Frenk, C. S., White, S. D. M. 1996, ApJ, 462, 563
- Ofek et al. (2001) Ofek, E. O., Maoz, D., Prada, F., Kolatt, T., Rix, H.-W. 2001, MNRAS, 324, 463
- Ofek et al. (2002) Ofek, E. O., Rix, H.-W., Maoz, D., Prada, F. 2002, MNRAS, 337, 1163
- Oguri (2002) Oguri, M. 2002, ApJ, 580, 2
- Oguri et al. (2001) Oguri, M., Taruya, A., Suto, Y. 2001, ApJ, 559, 572
- Oguri et al. (2002) Oguri, M., Taruya, A., Suto, Y., Turner, E. L. 2002, ApJ, 568, 488
- Phillips et al. (2001a) Phillips, P. M., Browne, I. W. A., Wilkinson, P. N. 2001a, MNRAS, 321, 187
- Phillips et al. (2001b) Phillips, P. M., et al. 2001b, MNRAS, 328, 1001
- Pierpaoli et al. (2003) Pierpaoli, E., Borgani, S., Scott, D., White, M. 2003, MNRAS, submitted (astro-ph/0210567)
- Press & Schechter (1974) Press, W. H., Schechter, P. 1974, ApJ, 187, 425
- Rusin (2002) Rusin, D. 2002, ApJ, 572, 705
- Sarbu et al. (2001) Sarbu, N., Rusin, D., Ma, C. 2001, ApJ, 561, L147
- Sheth & Tormen (1999) Sheth, R. K., Tormen, G. 1999, MNRAS, 308, 119
- Takahashi & Chiba (2001) Takahashi, R., Chiba, T. 2001, ApJ, 563, 489
- Turner (1980) Turner, E. L. 1980, ApJ, 242, L135
- Wechsler et al. (2002) Wechsler, R. H., Bullock, J. S., Primack, J. R., Kravtsov, A. V., Dekel, A. 2002, ApJ, 568, 52
- Wyithe et al. (2001) Wyithe, J. S. B., Turner, E. L., Spergel, D. N. 2001, ApJ, 555, 504
- Zhao (1996) Zhao, H. S. 1996, MNRAS, 278, 488