Pasadena, CA 91125, Cblake@princeton.edu 22institutetext: Department of Astrophysical Sciences, Princeton University, Princeton, NJ 08544 33institutetext: Lawrence Livermore National Laboratory, 7000 East Avenue, Livermore, CA 94550 44institutetext: Steward Observatory, University of Arizona, 933 North Cherry Avenue, Tucson, AZ 85721.
A Search for Period Changes in Scuti Stars with the Super-LOTIS Sky Patrol System
Abstract
We have observed a sample of Scuti stars discovered by the ROTSE collaboration in 1999 with Super-LOTIS in order to characterize changes in their pulsation periods over a time baseline of roughly three years. Achieving these goals required the creation of an automated astrometric and photometric data reduction pipeline for the Super-LOTIS camera. Applying this pipeline to data from a June 2002 observing campaign, we detect pulsations in 18 objects, and find that in two cases the periods have changed significantly over the three years between the ROTSE and Super-LOTIS observations. Since theory predicts that evolutionary period changes should be quite small, sources of non-evolutionary period changes due to the interactions of pulsations modes are discussed.
1 Introduction
It is estimated that 50 of stars located in the lower classical instability strip exhibit Scuti pulsations. Most pulsate in a number of non-radial p-modes, others in fundamental and/or overtone radial modes, and some possibly in g-modes. The periods of these stars are generally between 0.014d and 0.25d, with amplitudes up to 10. There are a number of distinct subgroups of the Scuti pulsating stars. In all cases it is the standard opacity mechanism which excites the pulsations, but the stars located in this region of the instability strip may be Population I, evolved Population II, or massive stars evolving through the instability strip. A very thorough description of the characteristics of these stars, and their different subclasses, is given by Breger (breger00 (2000)).
The radial pulsation of a Scuti star is related to the stellar density through the simple equation of pulsation . Observed changes in the pulsation frequencies of these stars therefore provide important information about stellar structure. Since stellar mass is conserved on the time scale of our observations, finding period changes provides information about changing stellar radius. Detailed models of these changes in stellar structure, and the resulting changes in pulsation frequency, have been carried out by Breger Pamyatnykh (breger98 (1998)) who predicted that pulsation frequencies should be stable or slowly increasing as some of these types of stars evolve away from the Zero Age Main Sequence (ZAMS). The theoretically expected exceptions would be the rare pre-MS pulsators, of which very few are known, and the Population II stars. Breger Pamyatnykh (breger98 (1998)) point out that in practice what is often observed is not a slow evolution of pulsation frequency, but abrupt changes more drastic than can be explained by the current models. While Szeidl (sz00 (2000)) provides examples where period changes have been proven false by careful re-examination of data, many examples of well established period changes also exist. These observed changes are not necessarily even in the predicted sense, i.e. some are of increasing frequency, and there are examples from the literature where the period changes are an order of magnitude larger than expected. The predicted, and sometimes observed, period changes in Scuti stars are generally given in units of , an effect on the order of over the 3 year baseline studied here. Breger Pamyatnykh (breger98 (1998)) point out that the observed period changes in Population II stars are often abrupt and up to an order of magnitude larger than those in Population I stars and that stars just below the Main Sequence may demonstrate changes up to two orders of magnitude larger than Population I stars.
A small gradient in the period of pulsation requires a long baseline of observations of at least a decade to detect with certainty. For example, several decades of data for the star EH Lib has been analyzed by a number of groups (Mahdy & Szeidl (mahdy80 (1980)),Yang et al. (yang92 (1992)), and Agerer & Huebscher (ager97 (1997))) who reached different conclusions as to subtle changes in the period of pulsation of this star. Obviously, systematic effects, and effects related to the method of data analysis, can be problematic when trying to identify such a subtle change. Light travel time effects due to binarity, and errors with the O-C analysis, or time of maxima counting, may lead to such ambiguities in the changing pulsation period. Here, large changes in periods of pulsation over a comparatively short, three year, time scale are investigated in order to compare to theoretical predictions.
2 Sample Stars
A sample of 18 Scuti stars was selected from the on-line database of the Robotic Optical Transient Search Experiment (ROTSE) project. The ROTSE team discovered many new variable stars, as describe by Akerlof et al. (aker00 (2000)), and has made the data publicly available111http://umaxp1.physics.lsa.umich.edu/mackay/ rsv1/rsv1home.htm. Stars from the ROTSE database were chosen, as opposed to stars from the standard catalogs of Scuti stars, because the ROTSE stars were readily observable at the time of year when the instrument for this study was available, and were generally fainter than other samples of Scuti stars, thus better suited to observation by our instrument. Several months of well sampled ROTSE observations could be easily retrieved for each star from the online database. Since the ROTSE data were taken without a standard photometric filter, the standard Scuti subclass definitions, based on V band photometric amplitudes, are difficult to apply. A selection was made for amplitude 04 and d, and only stars with the highest ROTSE light curve quality designation were considered. The stars selected from the ROTSE database could possibly fall into four categories: (1) Population I p- and/or g-mode pulsators, (2) Population I radial fundamental and/or overtone pulsators, generally called High Amplitude Delta Scutis because they have larger photometric amplitudes, (3) Population II stars, generally called SX Phe stars, or (4) pre-MS and evolved massive stars. The sample stars and their properties as reported in the ROTSE database are given in Table 1.
| Star1 | RA(J2000) | DEC(J2000) | Mag | P(d) | Mag |
|---|---|---|---|---|---|
| ROTSE 9470 | 253.90332 | 52.379080 | 13.40 | 0.1613 | 0.39 |
| ROTSE 4861 | 264.90536 | 50.200581 | 12.45 | 0.1761 | 0.35 |
| ROTSE 3956 | 194.17738 | 23.152025 | 13.54 | 0.1654 | 0.33 |
| ROTSE 3554 | 205.30734 | 31.790440 | 13.03 | 0.1318 | 0.31 |
| ROTSE 1526 | 210.27316 | 24.704525 | 12.24 | 0.1939 | 0.10 |
| ROTSE 3124 | 214.22528 | 23.878872 | 13.06 | 0.1772 | 0.21 |
| ROTSE 3709 | 215.48952 | 23.449043 | 13.35 | 0.1848 | 0.14 |
| ROTSE 7388 | 217.66783 | 27.224258 | 14.23 | 0.1744 | 0.29 |
| ROTSE 4837 | 221.33072 | 35.466972 | 13.77 | 0.1707 | 0.30 |
| ROTSE 706a | 231.02898 | 36.866928 | 10.99 | 0.1041 | 0.33 |
| ROTSE 9134 | 232.84311 | 35.881794 | 14.32 | 0.1784 | 0.46 |
| ROTSE 917 | 243.83421 | 35.707275 | 11.10 | 0.1805 | 0.28 |
| ROTSE 2573 | 240.62502 | 37.560284 | 12.31 | 0.1794 | 0.10 |
| ROTSE 3232 | 242.53889 | 35.958557 | 12.68 | 0.1594 | 0.23 |
| ROTSE 2275 | 243.61665 | 30.529236 | 12.25 | 0.1769 | 0.10 |
| ROTSE 2592 | 237.44629 | 23.915735 | 12.45 | 0.1110 | 0.12 |
| ROTSE 2926 | 242.08601 | 28.212255 | 12.66 | 0.1750 | 0.11 |
| ROTSE 2986 | 240.19507 | 24.261307 | 12.59 | 0.1965 | 0.13 |
(1) These data were collected from the ROTSE variable star database, available at
http://umaxp1.physics.lsa.umich.edu/mackay/rsv1/rsv1home.htm
() The known variable star YZ Boo
3 Observations
Observations of the target stars were carried out during May and June, 2002, with the Super Livermore Optical Transient Imaging System (Super-LOTIS) robotic telescope located at the Steward Observatory site on Kitt Peak, Arizona. The telescope system is described by Park et al.(park97 (1997) and park02 (2002)). A pixel CCD detector is located at prime focus of a 60cm f/3.5 Boller & Chivens Newtonian reflector, resulting in a field of view of 0.8 and a plate scale of 1.5pixel. Typical seeing at the Super-LOTIS site was , so the stellar PSFs were generally under-sampled. The system functions autonomously, with a list of targets being submitted each day, and is capable of collecting 600 individual 30 second images during an eight hour observing run. Since one of the primary functions of this instrument is to search for the prompt optical emission associated with gamma ray bursts, it is able to slew very quickly if a satellite trigger is received. As a result, the observations of variable stars were occasionally interrupted to chase a burst.
Images of the Scuti stars, taken with a Bessel R band filter, were typically 20 to 30 seconds in length, with two images of the same field taken consecutively. Each star was visited typically six times per night, resulting in 10 to 20 individual data points for each star for each observing night. Since the Super-LOTIS CCD camera is thermo-electrically cooled, there is a non-negligible dark current which must be removed with a dark image. More than 50 dark images were taken each night, several for each unique exposure duration. At several points during each night a set of exposures of the random field at Zenith was taken for the purpose of constructing a super sky flat by median filtering the images of the randomly distributed stars. While useful for the study of the periods of Scuti stars, these data were also useful for a thorough characterization of the Super-LOTIS instrument. Since the CCD camera is located at prime focus of a fast Newtonian optical system, problems with focus stability and optical aberrations, such as coma, were common. Mechanical malfunctions with the drive system and wind induced vibration, leading to poorly guided images, as well as electronic problems with the CCD leading to noisy images, were also identified. The 12-bit CCD camera itself has seen many years of use, and will be replaced with a device with higher quantum efficiency and better read noise characteristics. The current CCD has a high gain of and an approximate read noise of . While the data still produced good results despite these hardware problems, the system is constantly being improved. Less data loss, and higher quality images, may be expected with the installation of a newly purchased CCD camera and improvements to the mount which will occur during 2003.
4 Data Reduction
A pipeline for the reduction of images from the Super-LOTIS telescope was devised for use with this data and, hopefully, for use with future projects as well. This pipeline was based on codes written in Interactive Data Language(IDL), and includes code from public IDL libraries, such as the Goddard library222http://idlastro.gsfc.nasa.gov/homepage.html. The process was broken up into three steps: image reduction, astrometry, and photometry. First, master dark images were created. The dark current was typically measured to be 0.2 ADU/s, on top of a bias level of 182 ADU. The original intention was to make flat-field images by a median filter of images of the random star fields taken throughout the night at altitude. In practice, it was determined that with the exposure time that had been allotted there were not enough sky counts to produce a statistically meaningful flat-field. In order to investigate the effects of using unflattened data, a number of images taken occasionally by Super-LOTIS during the morning and evening twilight were carefully studied. Since the CCD camera was removed for maintenance on several occasions, it was decided not to attempt to apply these few test flats to data taken on other nights. For objects within the central of the CCD chip area, the contribution to photometric errors from the lack of flattening is expected to be . This is taken into account during photometric calibration when only stars near the center of the CCD chip are utilized for determination of the photometric zero point of each image.
A significant portion of the data, up to , were found to be unusable for some reason related to hardware or weather conditions. A series of tests were implemented in order to reject these poor images at the very onset of processing. A requirement was set that there be at least 100 point source detections in each image. Since data were often taken under patchy clouds, this helped to remove images taken during very poor transparency or those taken too far into the morning twilight. A test was run to check the gradient of the sky value across the chip from edge to edge, and a cut set at a gradient less than . This helped to identify images taken too close to the moon. Similarly, a test was run to determine the gradient of the sky values in a set of annuli moving from the center of the image toward the edge. This test easily identified a distinctive problem caused by the occasional shutter malfunction. Lastly, poor tracking was identified by calculating the autocorrelation of each image. The characteristic ’hiccup’ caused by a tracking irregularity in the Right Ascension gear or mount vibration induced by wind, which is easily identifiable by visual inspection, was identified in the data pipeline as a strong image autocorrelation well outside the normal image seeing disk of pixels. The autocorrelation was also found useful for identifying the occasional image with a severely distorted PSF due to poor focus. This test was done using FFTs of the images and was found to be fast enough as to require only a very small portion of the total data pipeline CPU time.
Once poor quality data were rejected, a World Coordinate System (WCS) astrometric solution was added to the FITS header of each remaining file. Approximate center-of-field coordinates are logged by the telescope control system at the time the exposures are taken, so these estimates were used as a starting point for an accurate WCS solution. The pointing of the Super-LOTIS system was typically better than , with an average pointing error of over 1000 pointings. Since the field of view is so large, targets were seldom, if ever, not placed on the CCD chip, but the pointing accuracy is expected to improve with future upgrades to the telescope mount. The astrometric solutions were determined by cross correlating the positions of point sources within each image with the positions of stars in the Guide Star Catalog II. Point sources in the images were identified with an IDL adaptation of the Stetson (stet87 (1987)) DAOPHOT algorithms written by W.Landsman and available in the Goddard IDL library. There were typically 200-300 matches between image stars and catalog stars for each image. The cross correlation of the catalog and source positions was maximized allowing translation of the image point source positions, a rotation of up to , and a low order polynomial term in the radial direction. The resulting coefficients were stored in a GSSS astrometric structure, of the type used for the HST guide star survey images, and added to the image FITS header. The typical residuals of the astrometric fits were pixel. Since the stellar PSFs were under-sampled, the accuracy of the fits was not as high as would be expected from the application of this method to other data sets, for example Hogg et al. (hogg01 (2001)), which is followed closely here. Parts of the Super-LOTIS pipeline astrometric code were drawn from the SDSS PT telescope data pipeline described by Hogg et al. (hogg01 (2001)), but here the requirements for astrometric precision are much less stringent, pixel. The failure rate for the astrometric solutions to images passing the image quality tests was less than .
Since the Super-LOTIS images were not crowded with stars, the reduced images were photometered using simple aperture photometry with a radius, matched to the average seeing, of 6 pixels and a sky annulus of radii 10 and 18 pixels. These values were determined empirically after testing a variety of radius and annulus combinations. Sub-pixel centroiding of the aperture was carried out prior to photometering in order to compensate for errors in the conversion from Right Ascension and Declination to pixel coordinates, which were found to be on the order of 1 pixel. Since the stellar PSFs were often very distorted, an accurate centroid was very important. This was done using a center-of-mass estimation. In each data image, every star amounting to a detection above the noise in the sky background was photometered and its flux, chip position, Right Ascension, Declination, and nearby sky value were stored, along with the Julian date of the observation, in a FITS binary table written to accompany each data image. The fluxes were converted to magnitudes by comparison to the Guide Star Catalog II (GSCII) on-line database333http://www-gsss.stsci.edu/support/dataaccess.htm. The stars photometered in each image were matched to stars from the GSCII catalog and their F band photographic catalog magnitudes recorded. Both F band and R band are red bandpasses, and though not identical, are very similar. While each individual catalog magnitude has a reported error of up to 05, a minimum of 100 of these values were averaged together in order to substantially reduce errors in the photometric zero points. The GSCII contains more accurate photometry for bright stars taken from other catalogs. For each matched star, a rough zero point was calculated with the simple formula
| (1) |
where is the catalog magnitude from the GSCII, is the observed flux, in ADU s-1, and is the rough photometric zero point. At least 100 such rough zero points were averaged together to create a final zero point for each image. Prior to averaging, the rough zero points from the brightest and faintest of the stars were removed, and the final average was calculated on the remaining values with clipping. The errors in these catalog-based magnitudes are dominated by the errors in the GSCII magnitudes, but were found to be accurate to .
Since in many situations accurate relative photometry is more important than absolute photometry, the instrumental magnitudes were further refined following the methods of Everett & Howell (ever01 (2001)). A small set of stars brighter than 140, and close enough to the target star that, based on known pointing accuracy statistics, all of these stars would appear in each exposure, were chosen to act as the reference for the calculation of differential magnitudes. Assuming that each of the reference stars were intrinsically constant in brightness, small corrections were made to the instrumental magnitudes following the reference stars method of Everett & Howell (ever01 (2001), eqn.(2)). In this method the differential magnitudes are calibrated using an average over reference stars weighted by the theoretical variance of each observation, in magnitudes. This estimate was based on the read noise of the CCD, the photon noise, dark current, as well as noise associated with the quantization of the electrons into ADU. The equation for is taken from Everett & Howell (ever01 (2001), eqn.(1)), but terms for dark current and quantization are added according to Howell (how00 (2000), eqn.(4.4))
| (2) |
where is the aperture flux from the star in , is the CCD gain in , is the average sky background value in /pixel, is the average dark current in /pixel, is the CCD read noise in , is a constant related to the quantization noise as explained by Howell (how00 (2000)), and relates the number of pixels in the aperture to the number of pixels in the annulus via
| (3) |
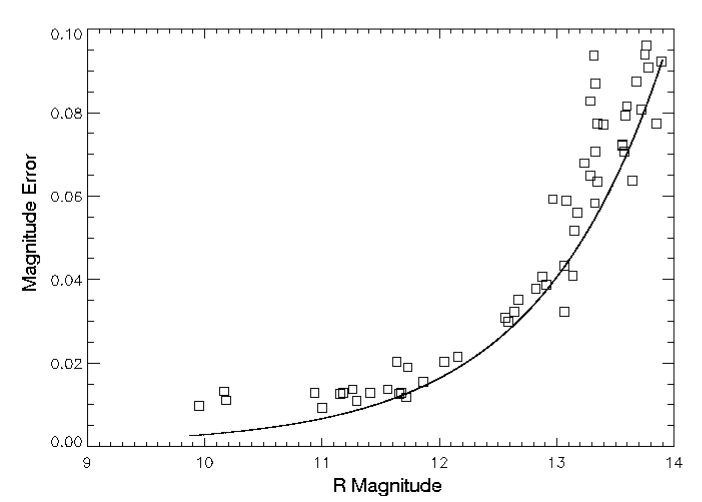
The accuracy of the differential photometry was compared to the theoretically expected variance in the magnitude estimations derived from the equations for . The results are shown in Fig.1 as function of magnitude, with the heavy line presenting the expected level of photometric accuracy, due largely to the high read noise of the CCD. By plotting the measured variance of a random sample of stars, all assumed to be constant, it is shown that the level of photometric accuracy achieved is very close to the theoretical limit. It was found that for a star of average brightness 120 the differential magnitude values produced with this method are accurate to . A photometric calibration where a number of stars in a single frame are utilized to produce differential magnitudes, sometimes called ’ensemble photometry’, has been shown to produce highly accurate results by several groups, including Everett & Howell (ever01 (2001)). This method helps to reduce systematic effects, as well as effects due to color dependent extinction, resulting in accurate differential magnitudes. While the best photometric accuracy was achieved when an ensemble of stars was used to produce differential magnitudes, the option exists in the pipeline to derive only the less accurate results from the GSCII using a larger number of stars without requiring that the all the stars be in every frame. This is a necessary modification in order to quickly produce accurate magnitudes for targets of opportunity, such as gamma ray burst optical flashes, when a set of ensemble stars can not be selected prior to the reductions, a large error box must be searched, and photometric results are required as quickly as possible.
5 Period Determination
With magnitudes for the sample of Scuti stars produced by the
photometric pipeline, the periods of variation could be determined
and compared to the values found from the data taken during the
1999 ROTSE observations. Since the data are unevenly sampled, a
periodogram method was selected for analyzing periodicity in the
light curves. The effectiveness of the periodograms for
identifying periodicity in data sampled in a manner similar to the
ROTSE or Super-LOTIS data has been demonstrated many times,
including Schwarzenberg-Czerny (cz96 (1996)) and Eyer & Blake
(eb01 (2002)). Here an implementation of the Lomb-Scargle
normalized periodogram, a technique based on the work of Lomb
(lomb76 (1976)) and Press & Rybicki (pr89 (1989)), is utilized in
an IDL code based on a publicly available routine written by J.
Wilms444http://astro.uni-tuebingen.de/software/idl/
aitlib/timing/scargle.pro.The statistics of various types of
periodograms are treated in great detail by Schwarzenberg-Czerny
(cz98 (1998)), in which a common inaccuracy in the standard
implementation of the Lomb periodogram is pointed out. In the
limiting case where the number of data points in the time series
is very large, the statistical distribution of the periodogram of
a white noise vector is well approximated by a
distribution, but in general the distribution is actually a
function. In cases were the number of data points is less
than , the function provides much more
accurate false alarm probabilities for detected signals. The full
distribution function, and its limiting case, is given by
| (4) |
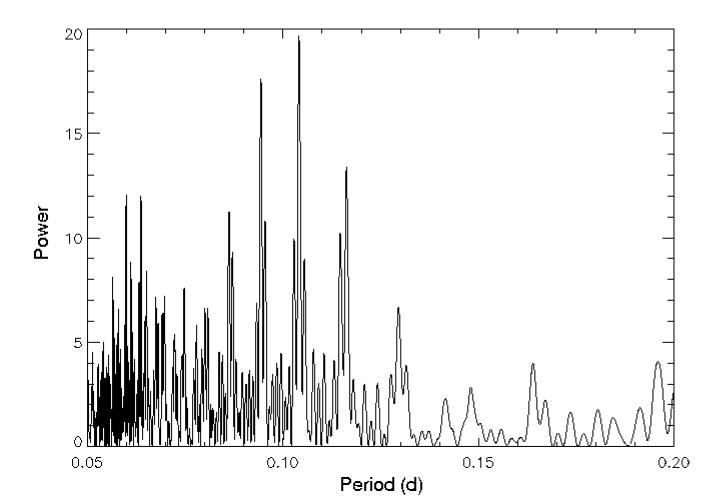
The Lomb method was applied to the publicly available ROTSE light curves in an attempt to recover the periods for the sample stars published in the ROTSE database. The period search mesh was set so that an average resolution in period of was achieved. Heliocentric corrections were made to the times of observations prior to analysis with the Lomb-Scargle algorithm. When weighted by errors, the periods reported by ROTSE and those determined from analyzing the ROTSE data with the Lomb-Scargle algorithm were identical. The published ROTSE periods were determined using a cubic B-spline method described by Akerlof et al. (aker94 (1994)). This method is computationally slower than the Lomb algorithm, but is more statistically robust for light curves which are not well approximated by sinusoids. Since the light curves of Scuti stars are basically sinusoidal, the Lomb method is thought to be preferable for this application. An example of a periodogram for the star ROTSE 706 is given in Fig.3. While the statistical properties of detected signals have received much attention, Akerlof et al. (aker94 (1994)) points out that frequency error estimation is rarely discussed in the literature. A simple Monte Carlo method was utilized here to estimate the errors in the detected periods. Following Akerlof et al. (aker00 (2000), Fig.3), the photometric errors reported in the ROTSE database were augmented to match the published error distribution as a function of magnitude. Systematic effects were found to increase the ROTSE photometric errors from the theoretically derived limit at 100 to . For 200 trials a Gaussian random vector, of sigma set to match the mean expected photometric variance of the individual measurements was added to the photometric data, processed with the Lomb algorithm, and the resulting highest power frequencies were tabulated. The standard deviation of these frequencies was taken to be the error on the originally determined period. Periods and accompanying errors for the ROTSE and Super-LOTIS photometry using the Lomb algorithm and Monte Carlo error estimation are given in Table 2. The significance of the period differences are also given, in units of the quadrature added errors for the individual period estimations. Inspection of our derived period changes, and comparison with our Monte Carlo-derived period errors in Table 2, may appear to indicate that our period errors are overestimated (with reduced chi-squared of 1 for the dataset). However, we note that the Monte Carlo technique we use will, even in the best circumstances, inflate derived errors by a factor of by adding its “false” errors to the intrinsic errors of the data. Moreover, in our numerical investigations of the period-fitting process, we found that the period uncertainties are often limited not by the shape of the global minimum at the true period, but rather by the existence of nearby local minima corresponding to quite distinct period solutions. In this case, the traditional Gaussian characterization of the uncertainties is inadequate, and a conservative approach – such as we have adopted here – will appear to have overestimated the errors in those cases where the true global minima have (in fact) been derived.
| ROTSE | Super-LOTIS | ||||
|---|---|---|---|---|---|
| Star | P(d) | (d) | P(d) | (d) | P/ |
| ROTSE 9470 | 0.161347 | 1.1e-5 | 0.161343 | 4.8e-5 | 0.08 |
| ROTSE 4861 | 0.176131 | 6.7e-6 | 0.176242 | 3.1e-5 | 3.50 |
| ROTSE 3956 | 0.1654 | 0.0033 | 0.1654 | 0.0047 | 0.00 |
| ROTSE 3554 | 0.1318 | 0.0022 | 0.1318 | 0.0022 | 0.00 |
| ROTSE 1526 | 0.193927 | 1.0e-5 | 0.1939 | 0.0077 | 0.00 |
| ROTSE 3124 | 0.1772 | 0.0027 | 0.177173 | 9.3e-5 | 0.01 |
| ROTSE 3709 | 0.185 | 0.010 | 0.1850 | 0.0090 | 0.00 |
| ROTSE 7388 | 0.175 | 0.019 | 0.175 | 0.014 | 0.00 |
| ROTSE 4837 | 0.171 | 0.011 | 0.170756 | 6.9e-5 | 0.02 |
| ROTSE 706a | 0.1040889 | 7.0e-7 | 0.1040453 | 3.9e-6 | 11.0 |
| ROTSE 9134 | 0.151 | 0.037 | 0.151 | 0.013 | 0.00 |
| ROTSE 917 | 0.1805 | 0.0056 | 0.180344 | 1.5e-5 | 0.03 |
| ROTSE 2573 | 0.179 | 0.018 | 0.179 | 0.011 | 0.00 |
| ROTSE 3232 | 0.159372 | 7.6e-6 | 0.159 | 0.011 | 0.03 |
| ROTSE 2275 | 0.177 | 0.016 | 0.1768 | 0.0053 | 0.01 |
| ROTSE 2592 | 0.1199 | 0.0025 | 0.114 | 0.015 | 0.40 |
| ROTSE 2926 | 0.175 | 0.012 | 0.185 | 0.059 | 0.17 |
| ROTSE 2986 | 0.196518 | 1.6e-5 | 0.1965 | 0.0093 | 0.05 |
() The known variable star YZ Boo
6 Results
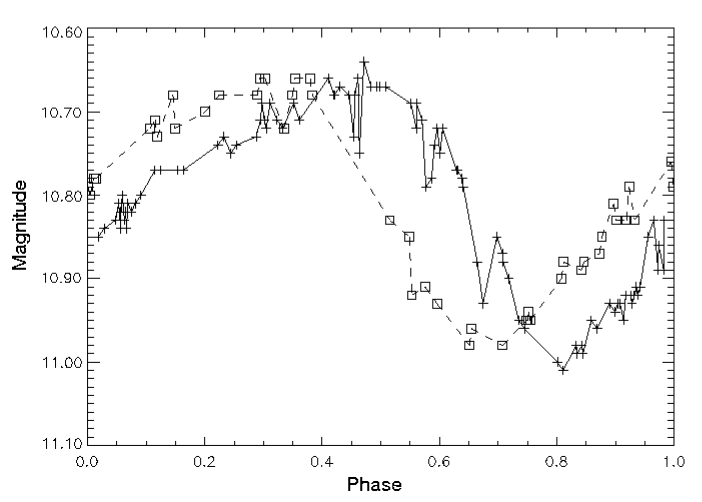
As expected, for the majority of stars in the Scuti sample, the principle periods of variation were found, within errors, not to have changed between the 1999 ROTSE observations and the Super-LOTIS observations during May and June, 2002. However, two stars, ROTSE 4861 and ROTSE 706, were found to exhibit statistically significant period variations. In the case of ROTSE 4861 a period increase of was detected at the 3.5 level. For ROTSE 706 and period decrease of was detected at the 11.0 level. In Fig.2 the ROTSE and Super-LOTIS data sets are combined and phased to the ROTSE period. It is clear from the folded light curves of ROTSE 706 that there is a phase lag between the two data sets which is greater than the error in the phase estimation. At the same time, for the majority of the stars in the sample the period errors are large enough that the phase uncertainties over the three years separating the observations becomes large, , meaning that the phase is not expected to be coherent between the two data sets. In the case of ROTSE 706, where a period change was identified and the phase errors due to period inaccuracies were negligible, an attempt was made to fit the ephemeris from the ROTSE and the Super-LOTIS observations by adding a term of the magnitude of the determined period change. Since these observed period changes are large, and therefore not evolutionary, the ephemeris were also fit to an abrupt, step-function period change. Neither case was found the improve the phase residuals for ROTSE 706. Since the period changes could be quite complex in nature, it might be expected that these two simple models of period change would fail to adequately fit the data.
7 Discussion
The magnitude of these period changes are much larger than those expected from stellar evolution, with the models of Breger & Pamyatnykh (breger98 (1998)) predicting that Population I Scuti periods in the 0.1d to 0.2d range are essentially constant, , over the duration of the observations considered here. For pre-MS stars the predictions increase by a factor of up to 100, still at least an order of magnitude smaller than the period changes found here. The non-evolutionary sources of period changes are discussed by Breger & Pamyatnykh (breger98 (1998)). Given the amplitude of the observed period changes and the short time span over which these changes occurred, it seems unlikely that light travel time effects, resulting from binarity, could be responsible. Additionally, previous searches for period changes in ROTSE 706 have not turned up effects of the magnitude found here, indicating that light travel effects due to a periodic binary motion are even less likely. An interesting possibility is outlined in the work of Moskalik (mask85 (1985)) who describes the possible effect of the non-linear interaction of various pulsational modes within the star that could produce jumps in the pulsation period of a Scuti star of the amplitude found here. The theoretical predictions for period changes in Population II Scuti stars are less well constrained, but it is thought that such changes are typified by large jumps in period followed by relatively constant behavior. These jumps are observed, for example in the star CY Aqr by Powell et al. (pow95 (1995)), and are usually of the order .
Further observations of ROTSE 4861 should be undertaken in order to determine its age and stellar properties. The star ROTSE 706 is a well studied Population I High Amplitude Scuti star also known as YZ Boo. Since this star has a high photometric amplitude and relatively short period, it has been included in many studies of the properties of Scuti stars. The long-term stability of the period of pulsation of YZ Boo has been studied extensively by Hamdy et al. (hamdy86 (1986)) who find a period increase of over the last several decades. Clearly, our result is incongruous with their finding. Since this star is a Population I fundamental radial mode pulsator, as confirmed by Peña et al. (pen99 (1999)) and Rodríguez et al. (rod96 (1996)), the abrupt period changes predicted for Population II stars are not expected to be present. The most promising theoretical explanation for a period change of the magnitude observed here in a Population I star is non-linear mode interaction. Such interactions have been proposed as a possible explanation for the observed period changes in XX Pyx reported by Handler et al. (hand98 (1998) and hand00 (2000)). Since Scuti stars may have a large number of excited modes of all types, and probably many more with amplitudes below current photometric detection limits, the calculation of the specific modes responsible for the amplitude and period variations is extremely difficult. The mode interactions described by Moskalik (mask85 (1985)) are based on only three modes, a radial mode interacting with two stable g- or p-modes of low order, and especially considering that the mode growth factor, , is not precisely known for many of the modes identified in XX Pyx, the problem of fitting a mode interaction model to the observations is not feasible. While at one time it was thought that monoperiodic High Amplitude Scuti (HADS) did not show any evidence for types of pulsation other than fundamental radial mode, or sometimes an overtone (see Rodríguez (rod96 (1996))), the mode resonance explanation for period changes requires nonradial modes to be excited in these stars. The subject of low amplitude nonradial and high order radial modes in HADS stars is discusses by Garrido et al. (garr96 (1996)) who find that diverse types of modes are often found in HADS stars when the the photometric data is of high enough quality. At the same time, the mode resonance hypothesis requires that the dominant, presumably radial, mode be unstable, meaning nonadiabatic. Nonadiabtic simulations of stellar models similar to Scuti stars are considered by Stellingwerf (stell80 (1980)) who finds that the fundamental radial mode of a stellar model similar to YZ Boo is unstable with a mode modulation time scale, , of the order years. It is certainly plausible that the conditions, namely multiple modes and an unstable dominant mode, could exist in a Scuti star, such as YZ Boo, for period changes of the order to occur through resonant mode coupling. There are relatively few discussions in the literature of observations of large amplitude, non-evolutionary period changes. In addition to the case already discussed of XX Pyx, period variations in V1162 Ori are presented by Arentoft et al. (arent01 (2001)), and the peculiar behavior the one-time monoperiodic HADS star RY Lep is discussed by Laney & Schwendiman (laney02 (2002)). In both cases, changes in periodicity, similar in magnitude to those presented here, are found. As pointed out by Laney & Schwendiman, these abrupt changes in period, or “aperiodic cycles” may even be typical of variable stars. Since they occur rarely, evidence for such behavior is only now becoming more abundant as more data than ever is being collected by groups all over the world interested in Scuti stars.
Comparatively little is known about ROTSE 4861, the other star for which we find a period change. The colors of the star were measured with The 60” Oscar Meyer Telescope on Mt. Palomar and found to be , almost a magnitude more red than a typical lower instability strip star. One interesting note about this star is that its position, as reported in the ROTSE database and re-calculated by us, is located from the X-Ray source 1RXS J173936.5+501207 from the ROSAT Bright Source Catalog of Voges et al. (vog99 (1999)). This raises the interesting possibility that ROTSE 4861 is a new pre-MS, or Herbig Ae/Be, star displaying Scuti variability. Only nine such stars have been identified, but the discovery, and extensive study, of such objects may prove useful for determining the time-scales of pre-MS evolution and the structure of young stars (see Kurtz (kurtz02 (2002))). Further observations of ROTSE 4861 are required to determine the nature of this star, but Zinnecker Preibisch (zinn94 (1994)) found that about half of the Herbig Ae/Be stars they studied were X-Ray bright. If found to be a pre-MS star, the large amplitude and comparative regularity of ROTSE 4861 may make it the best testbed yet found for evolutionary theories. It is predicted by Breger Pamyatnykh (breger98 (1998)) that for pre-MS stars the observed period derivative is negative, which it is here, but the amplitude of the change found here is about 80 times larger than what is predicted for a pre-MS star with a pulsational period of 0.17d.
8 Conclusions
Tested with imaging data for a set of 18 Scuti stars, a newly designed data reduction pipeline for the Super-LOTIS telescope is found to be efficient and accurate. These photometric data were used to compare the current periods of these stars to periods determined three years ago by the ROTSE project. As expected, the majority of the stars show the same periodicity in the ROTSE data and the Super-LOTIS data. A Monte Carlo simulation was done to estimate the accuracy of the periods determined with a Lomb-Scargle periodogram method, and two stars were found to exhibit statistically significant period changes. The star ROTSE 706 (=YZ Boo) is a well studied monoperiodic high-amplitude Scuti which appears to have undergone a non-evolutionary period change during the time between the two data sets studied here. A few other examples of large amplitude period changes in Scuti stars were found in the literature. Along with these observed period changes was found discussion of a possible explanation through the phenomenon of resonant mode coupling between a nonadiabatic radial mode and two stable nonradial modes. The second period change was found in the star ROTSE 4861. Little is known about this star, but it is possibly an X-ray source reported in the ROSAT BSC. Further observations of this star are required to determine if it is a pre-MS or Herbig Ae/Be star, in which case it would represent a prime target for an astroseismology campaign to learn more about pre-MS evolution.
Acknowledgements.
The authors would like to acknowledge Professor Shri Kulkarni’s crucial role in enabling this collaboration and his financial support. The authors would also like to thank Edo Berger and Alicia Soderberg for assistance with the multi-color observations of ROTSE 4861, and the referee, Torben Arentoft, for his careful reading of the original manuscript and his detailed comments. CB would like to acknowledge the support of the Caltech SURF program during the completion of this work. Support for this work was provided through Professor Kulkarni via NSF grant AST-0098676 and STSCI grant HST-GO-09180.01-A under NASA Contract NAS5-26555. This work was performed under the auspices of the U.S. Department of Energy by the University of California, Lawrence Livermore National Laboratory under contract No. W-7405-ENG-48 and NASA contract S-03975G. . The Guide Star Catalog-II is a joint project of the Space Telescope Science Institute and the Osservatorio Astronomico di Torino. Space Telescope Science Institute is operated by the Association of Universities for Research in Astronomy, for the National Aeronautics and Space Administration under contract NAS5-26555. The participation of the Osservatorio Astronomico di Torino is supported by the Italian Council for Research in Astronomy. Additional support is provided by European Southern Observatory, Space Telescope European Coordinating Facility, the International GEMINI project and the European Space Agency Astrophysics Division.References
- (1) Agerer, F, Huebscher, K. 1997, IBVS, 4472
- (2) Akerlof, C., et al. 2000, AJ, 119, 1910A
- (3) Akerlof, C. et al. 1994, ApJ, 436, 787
- (4) Arentoft, T. et al. 2001. A&A, 374, 1056
- (5) Breger,M, Pamyatnykh, A. 1998, A&A, 332, 958
- (6) Breger, M. 2000, ASP Conference Series, v210, p.3
- (7) Everett, M.E., Howell, S.B. 2001, PASP, 113, 1428
- (8) Eyer, L., Blake, C. 2002, ASP Conference Series, v259, p160
- (9) Garrido, R., Rodríguez, E, 1996, MNRAS, 281, 696
- (10) Hamdy, M.A., Hamdy, H.A., Soliman, M.A. 1986, IBVS, 2963
- (11) Handler, G et al. 1998, MNRAS, 295, 377
- (12) Handler, G. et al. 2000, MNRAS, 318, 511
- (13) Hogg, D.W., Finkbeiner, D.P., Schlegel, D. J., Gunn, J.E. 2001, AJ, 122, 2129H
- (14) Howell, S.B. 2000. Handbook of CCD Astronomy. Cambridge Univ. Press, Cambridge
- (15) Kurtz, D.W. 2002, ASP Conference Series, v256, p.31
- (16) Laney, C.D., Schwendiman, M.J.L 2002, ASP Conference Series, v256, p.173
- (17) Lomb, N.R.1976, Ap&SS, 39 447
- (18) Mahdy, H.A, Szeidl, B. 1980, Comm. Konkoly Obs., No .75
- (19) Moskalik, P. 1985, Acta. Astron., 35, 229
- (20) Park, H.-S. 1997, astro-ph/9711170
- (21) Park, H.S. et al. 2002, ApJ, 571, 131P
- (22) Peña, J.H., Gonzáles, D., Peniche, R. 1999, A&A, 138, 11
- (23) Powell, J.M, Joner, M.D., McNamara, D.H. 1995, PASP 107, 225
- (24) Press, W.H., Rybicki, G.B. 1989, ApJ, 338, 227
- (25) Press, W.H., Teukolsky, S.A., Vetterling, W.T., Flannery, B.P. 1992. Numerical Recipes. Cambridge Univ. Press, Cambridge.
- (26) Rodríguez, E., Rolland, A., López de Coca,P., Martín, S. 1996, A&A, 307, 583
- (27) Schwarzenberg-Czerny, A. 1996, ApJL, 460, 107
- (28) Schwarzenberg-Czerny, A. 1998, MNRAS, 301, 831
- (29) Stellingwerf, R.F. 1980. Nonradial and Nonlinear Stellar Pulsations, eds. H.A. Hill and W.A. Dziembowski (Springer Verlag), p.50
- (30) Stetson, P. B. 1987, PASP, 99, 191
- (31) Szeidl, B. 2000, ASP Conference Series, v210, p442
- (32) Voges, W et al. 1999, A&A, 349, 389
- (33) Yang, D.,Tang, Q.,Jiang, S. 1992, IBVS, 3769
- (34) Zinnecker, H., Preibisch, T. 1994, A&A, 292, 152