High Resolution X-Ray Spectroscopic Constraints on Cooling Flow Models of Clusters of Galaxies and Gaseous Haloes Around Elliptical Galaxies
Abstract
In many clusters of galaxies, the cooling time at the core of the intracluster medium is much less than the age of the system, suggesting that the the gas should continually lose energy by radiation. Simple thermodynamic arguments then require that the expected “cooling flow” should exhibit a specific spectroscopic signature, characterized by a differential emission measure distribution that is inversely proportional to the cooling function of the plasma. That prediction can be quantitatively tested for the first time by the Reflection Grating Spectrometer (RGS) experiment on XMM-Newton, which provides high resolution X-ray spectra, even for moderately extended sources like clusters. We present RGS data on 14 separate cooling flow clusters, sampling a very wide range in mass deposition rate. Surprisingly, in all cases we find a systematic deficit of low temperature emission relative to the predictions of the cooling flow models. However, we do see evidence for cooling flow gas at temperatures just below the cluster background temperature, , roughly down to . These results are difficult to reconcile with most of the possible explanations for the cooling flow problem that have been proposed to date. We also present RGS data on the massive elliptical galaxy NGC 4636. In this case, we detect evidence for resonance emission line scattering of high oscillator strength Fe L-shell emission lines within the gaseous halo of the galaxy. The detection of that effect leads to very tight constraints on physical conditions within the halo. However, here again, the expected signature of a cooling flow is not detected, perhaps suggesting some fundamental uncertainty in our understanding of radiative cooling in low density cosmic plasmas.
Columbia Astrophysics Laboratory, Columbia University, 550 W. 120th Street, New York, NY 10027, United States
SRON Utrecht, Sorbonnelaan 2, 3584 CA Utrecht, The Netherlands
Space Sciences Laboratory, University of California, Berkeley, CA 94720, United States
1. Introduction
The study of cooling flows in clusters of galaxies and the gaseous haloes of ellipticals has been a controversial area of research for nearly 30 years. As first emphasized independently by Cowie and Binney (1977), Fabian and Nulsen (1977), and Matthews and Bregman (1978), the cooling time for gas at the cores of these systems is often significantly less than the Hubble time. This implies that the gas should continually lose energy by radiation. A pressure driven cooling flow is thought to develop, causing the gas in the densest regions to slowly accrete onto the central dominant galaxies. The net result is a steady deposition of cold matter in the core of the cluster or massive galaxy.
General support for this picture came from some of the first imaging and spectroscopic observations obtained with the Einstein Observatory. Images of many clusters indicate sharp peaks in the surface brightness distribution, as predicted by cooling flow models. Where crude spectrophotometry has been available, one typically sees a marked softening of the spectrum in the central-most regions, again consistent with expectations. Spectroscopically, the presence of the cooling flow should manifest itself as an excess of emission (over isothermal models) at the lowest energies, or via the presence of soft X-ray emission lines inconsistent with the background gas temperature. The latter effect was detected with the Focal Plane Crystal Spectrometer on Einstein, for the gaseous halo around M 87 (Canizares et al., 1979, 1982).
Nevertheless, subsequent observations led to refinements of the simplest cooling flow models, and also pointed to some inconsistencies. For example, for a homogeneous cooling flow, the mass deposition rate should be even more centrally peaked than is inferred from the X-ray brightness profiles (Johnstone et al. 1992). Typically, a mass deposition rate roughly proportional to the radius is derived. This was potentially explained by Nulsen (1986) as a consequence of thermal instability. Dense blobs form locally everywhere in the intracluster medium where the cooling time is less than the age of the system. The result is that the cooling gas resides in a multiphase medium, distributed over a rather large volume. However, this picture was criticized by Balbus and Soker (1989) and others, who argued that in the presence of the gravitational potential, the growth rates of the linear instability are too weak to allow the cooling blobs to form.
A potentially more serious problem is that the end products of cooling are generally not seen in longer wavelength bands at the expected levels. For example, only a very small fraction of the cooling gas can form stars. H I absorption measurements have found no evidence for cold condensed clouds (O’Dea et al. 1998), and while CO emission has been detected (Edge 2001), the amount of inferred molecular gas is a factor 10 below what is predicted by X-ray cooling estimates.
Further, the first moderate resolution spectra obtained with the Einstein Solid State Spectrometer and with ASCA did not provide good quantitative fits to the simplest cooling flow models. Although cool gas is clearly present in the spectrum, there is a dearth of emission at the lowest energies. This was interpreted as evidence for cold absorbing material intermixed with the X-ray emitting gas (White et al. 1991). However, if cold gas is indeed present in the intracluster medium, it remains unclear why it does not form stars.
2. The Importance of High Resolution Soft X-ray Spectroscopy
Independent of the details of the cooling flow process, the emitted X-ray spectrum of the cooling gas can be robustly predicted using simple thermodynamic arguments: For an isobaric cooling flow, the differential luminosity emitted in a small temperature range is given by:
can also be expressed in terms of the cooling function of the plasma:
where is the differential emission measure. Thus:
| (1) |
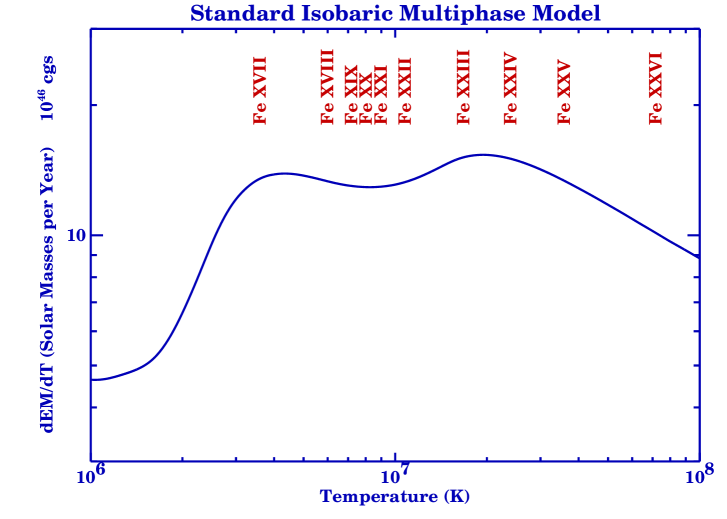
The differential emission measure distribution predicted by this simple argument is displayed in Figure 1. In calculating , we have assumed one-third cosmic abundances, which is typical of intracluster gas. Marked in the figure are the respective temperatures where each of the Fe L-shell ions becomes the dominant charge state. As can be seen, the Fe L complex very nicely samples the expected distribution. Hence by measuring the strengths of the various Fe L emission lines in a high resolution soft X-ray spectrum, we can accurately constrain cooling flow models.
3. Relevance of XMM-Newton
The first experiment capable of unambiguously making such measurements is the Reflection Grating Spectrometer (RGS) on the XMM-Newton Observatory. XMM-Newton incorporates three densely nested grazing incidence telescopes, collectively providing unparalleled area for imaging and spectroscopy. The RGS consists of arrays of grazing incidence reflection gratings, mounted immediately behind two of the three telescopes, which pick off roughly half the light in the beams, and disperse it to sets of dedicated charge-coupled device detectors (CCDs). For each of the two arrays, the gratings are mounted on an inverted Rowland circle, which also includes the respective telescope focus and the readout strip of CCDs. The gratings are all identical, and they are mounted at the same graze angle with respect to the incident ray passing through each grating center. This configuration produces nearly stigmatic and aberration-free focussing at all wavelengths in the spectrum. For a more complete description of this experiment, see den Herder et al. (2002). The other experiments on XMM-Newton are the European Photon Imaging Camera (EPIC), arrays of CCDs mounted at the foci of the three telescopes (see Turner et al. 2002 and Strüder et al. 2002), and the Optical Monitor (OM), an optical/ultraviolet telescope co-aligned with with the X-ray instruments (Mason et al. 2002).
The RGS bandpass ( to ), was adjusted so as to optimally sample the broad range of Fe L-shell transitions, as well as the K-shell features associated with C, N, O, Ne, Mg, and Si. These are the most prominent emission lines expected for collisionally ionized gas, emitting in the temperature regime to , characteristic of the expected cooling flows in clusters and elliptical galaxies. The effective area over this band averages , if we include both of the two identical instruments. For on-axis point sources, the spectral resolution is Å, varying only slowly as a function of wavelength. Like the transmission grating experiments on the Chandra Observatory, the RGS is a slitless spectrometer, which means that the resolution degrades for extended sources. Nevertheless, since the dispersion of the RGS gratings is very high, the degradation is fairly weak:
where is the source size in arc-minutes. Thus, for only moderately extended sources like clusters and ellipticals, we still obtain fairly high resolution spectra. (In contrast, the spectral resolution of the Chandra experiments degrades by almost a factor of 100 for a source extent of 1 arc-minute.)
4. RGS Observations of Clusters and Groups
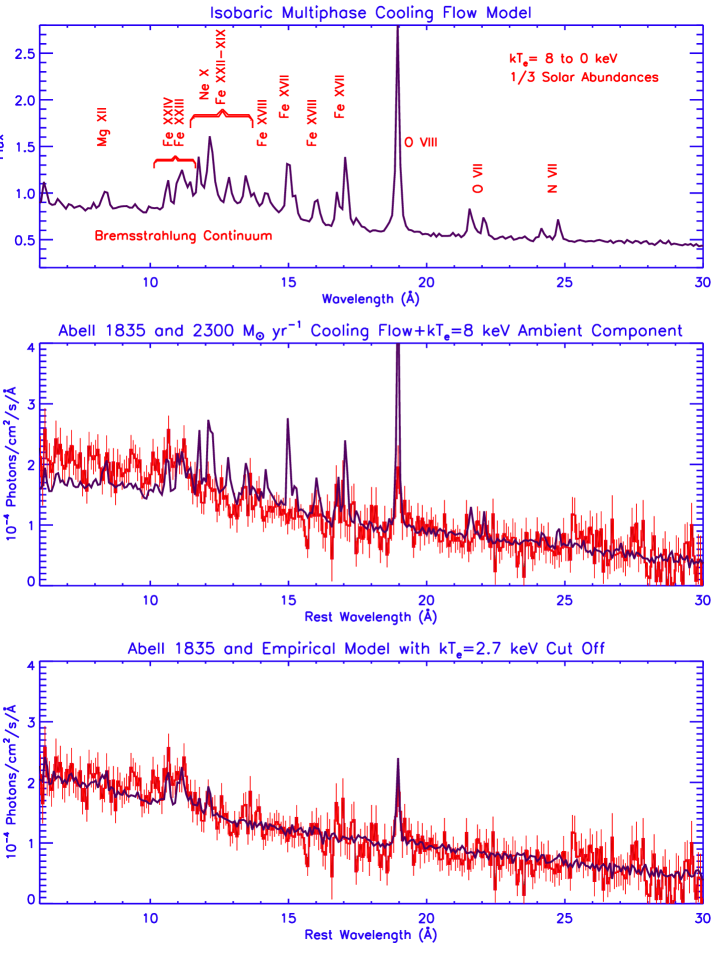
As a component of its guaranteed time observing program, the RGS instrument consortium observed a sample of 14 compact clusters and groups of galaxies, chosen to exploit the spectral sensitivity of the experiment (see Table 1). For a complete discussion of the analysis of these data sets, see Peterson et al. (2002). The sample includes clusters and groups at a range of temperatures, from 1 to 10 keV. All of these systems were expected to host cooling-flows, with inferred mass deposition rates varying by three orders of magnitude ( to ). Surprisingly, it was apparent from even the first of these observations, that our data were incompatible with the robust spectral predictions of the standard cooling flow model. An example is illustrated in Figure 2, which displays the derived spectra for the massive cluster A 1835. The intracluster medium in this system has a background temperature keV, and an inferred mass deposition rate (see Peterson et al. 2001 for a more complete description of the analysis for this case.) In the top panel of the figure, we show the simulated cooling flow spectrum that we expected for the parameters appropriate to this source. The middle panel shows the comparison with the data. As can be seen, the highest ionization lines expected (Fe XXIII, Fe XXIV) are indeed detected in the data, however the model vastly overpredicts the intensity of the lower ionization Fe L-shell lines, as well as the O VIII and O VII K-shell transitions. The discrepancy indicates a dearth of cooler gas. In the bottom panel, we show the comparison to the same cooling flow model, but now with the predicted emission measure distribution truncated at keV, with no contributions from gas at lower temperatures. This somewhat arbitrary modification of the model does appear to provide a fairly good description of the data.
| Cluster | Exposure (ks) | Redshift |
|---|---|---|
| Abell 1835 | 36 | 0.2523 |
| Abell 665 | 20 | 0.1818 |
| Abell 1795 | 40 | 0.0622 |
| Sérsic 159-03 | 38 | 0.0580 |
| 2A0335+096 | 26 | 0.0347 |
| Abell 4059 | 54 | 0.0460 |
| Abell 496 | 29 | 0.0328 |
| MKW 3s | 39 | 0.0442 |
| Abell 2052 | 33 | 0.0353 |
| Abell 262 | 36 | 0.0163 |
| Abell 1837 | 50 | 0.0372 |
| M87 | 42 | 0.0043 |
| NGC 533 | 48 | 0.0185 |
Note that the data do not indicate the complete absence of a cooling flow. In particular, the detected Fe XXIII and XXIV lines are indicative of temperatures less than 4 keV, and cannot arise in the 8 keV gas that characterizes most of the intracluster medium. Interestingly, the intensities of these lines are roughly at the right level for the mass deposition rate inferred from the X-ray surface brightness. It is as if the cooling does occur as predicted, but the emergent luminosity somehow disappears from the soft X-ray band at temperatures below half the background temperature of the cluster.
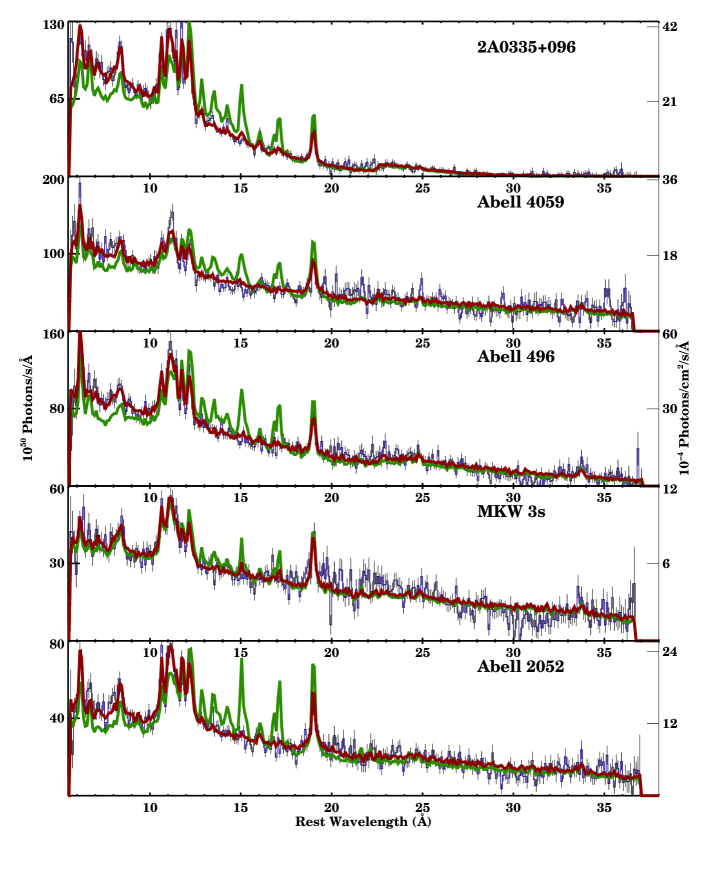
This same pattern is also found in all of the other clusters in our sample. A subset of the measured spectra are shown in Figure 3. Note that in all cases, Fe XXIII and Fe XXIV lines are detected prominently, while emission lines of lower ionization species (e.g. Fe XVII) are strongly suppressed. While O VIII Lyman- () is always detected, its measured intensity is also always far weaker than predicted by the cooling flow models for reasonable values of the oxygen abundance (O/Fe 0.2).
5. Quantitative Spectral Fits
To derive more quantitative constraints on the discrepancies with the cooling flow predictions, we have performed model fits to the data. Since clusters are extended sources, standard model fitting techniques cannot be easily employed with RGS data. Instead, we use a novel Monte Carlo technique developed expressly for this application (Peterson, Jernigan, and Kahn 2002). The Monte Carlo correctly accounts for the off-axis behavior of the instrument response, and the effects of arbitrary selection cuts and transformations of the data.
We generate photons within the cluster assuming a given spatial and spectral model. These are propagated through the instrument, yielding a distribution in the dispersion coordinate, the cross-dispersion coordinate, and the CCD pulse height. After applying the same cuts as are applied to the real data, the extracted spectrum from the Monte Carlo is compared to the data via a -statistic. An iterative technique is used to optimize the fit through the adjustment of the astrophysical parameters that specify the spatial/spectral model.
We use a simple -model to characterize the distribution. The parameters are derived from the simultaneous EPIC images of the source. For the spectrum, we use the MEKAL (Mewe, Kaastra, and Liedahl 1995) model to generate the line and continuum emissivities. The shape of the spectrum is then determined by the differential emission measure distribution.
Outside the “break radius” determined from the EPIC image, we assume that the gas is isothermal, and fit for the temperature and emission measure. Inside, we add in a cooling flow differential emission measure distribution, but we allow the mass deposition rate, , to be normalized separately in different temperature bins: ( to ), ( to ), ( to ), etc., where is the background temperature. This choice of binning is arbitrary, but it works fairly well because the fractional ionization curves are roughly equally spaced in the logarithm of the temperature. The elemental abundances are also left as free parameters, but are assumed to be spatially uniform. The latter assumption does not have a big effect on the fits.
In general, the fits to the data with this model are quite good. This can be seen from Figure 3, where we show a representative sample of the data on individual clusters with the best fit models overlayed. The models appear to correctly account for the relative strengths of the Fe L lines, O VIII, Ne X, and Mg XII.
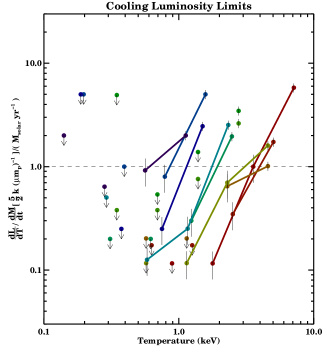
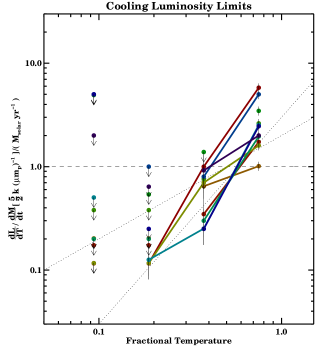
In Figure 4, we plot the ratio of the derived differential luminosity for each of the temperature bins to the differential luminosity predicted by the simple cooling flow model. In Figure 4a, these points are plotted as a function of absolute temperature, and in Figure 4b, as a function of fractional temperature with respect to the background temperature for each individual cluster. Different clusters are represented by different color points, and the relative points for a few particular clusters are connected by lines for clarity. At the lowest temperatures, we typically derive upper limits, as indicated, but in all cases, we do derive clear detections of emission in at least two distinct temperature bins.
The horizontal dashed lines in these figures represent what would be expected if the cooling flow model were correct. While it is possible for the highest temperature points to lie above the line (due to contributions from the background temperature gas), one would expect the detections and/or upper limits to be consistent with this line for all of the lower temperature points. As can be seen, in essentially all cases, at least some of the lower temperature points lie well below the line, indicating a dearth of cooler gas. When plotted as a function of absolute temperature (Figure 4a), there is no other obvious pattern to the data. However, when plotted as a function of fractional temperature (Figure 4b), it is clear that all of the clusters behave in roughly the same way: there is a clear “drop-out” of emission at temperatures below , where is the background temperature.
In fact, the various clusters appear to be consistent with a differential emission measure distribution given by:
| (2) |
with 1 to 2, as opposed to , as required by Equation (1). This empirical relationship is indicated by the dashed sloping lines in Figure 4b. Thus, in addition to the model being inconsistent with the data at the lowest temperatures, the entire shape of the differential emission measure distribution is inconsistent with the standard cooling-flow model.
6. Possible Explanations for the Deficit of Soft Emission
Since the initial reports of some of the results we have presented here (Peterson et al. 2001, Kaastra et al. 2001, Tamura et al. 2001), a number of explanations have been proposed to account for the observed deficit of soft X-ray emission. Most of these work energetically, i.e. they incorporate additional heating or cooling mechanisms that can plausibly supply or remove energy at a rate comparable to the missing soft X-ray luminosity. However, it still unclear whether any can successfully account for the systematic aspects of the observed discrepancies, e.g. the fact that the drop-out of emission always seems to occur at over a wide range in . Below, we briefly discuss a few of the ideas which have been suggested:
Heating. Heating by particle outflows associated with embedded active galactic nuclei (Rosner & Tucker 1989, Tabor & Binney 1993, David et al. 2001), or by subcluster mergers (Markevitch 2001), can supply sufficient energy deposition to counteract the expected cooling. In the context of the multiphase model, the energy input must be distributed evenly everywhere over the thermally unstable region. Otherwise local “pockets” of gas may still cool and condense. In addition, to suppress cooling in a temperature regime that is a fixed fraction of the background temperature, requires that the heating process be self-regulating, i.e. the heating rate has to nearly balance the cooling rate for every cluster, over a range of three orders of magnitude in cooling luminosity. This seems rather contrived, and, at the very least, such models require a fair degree of fine tuning to be considered viable.
Non-standard cooling. A more efficient means of cooling than radiation in the soft X-ray regime could reduce the expected line emission. Simply varying elemental abundances does not help much, since iron dominates both the cooling and the observed spectrum. Mixing the hot gas with cooler embedded gas to reradiate the energy at longer wavelengths (Begelman & Fabian 1990, Fabian et al. 2001) is a possibility, but it is by no means clear why this would always kick in at a fixed fraction of the background temperature. In addition, copious soft X-radiation can be produced by charge transfer at hot/cold interfaces, so it might not be that easy to truly suppress the soft X-ray emission line flux in such a scenario.
Electron conduction. Heat conduction from hotter to colder phases could suppress further cooling as the dense condensations first begin to form (Tucker & Rosner 1983, Stewart et al. 1984, Bertschinger & Meiksin 1986). The presence of tangled magnetic fields in the plasma can strongly suppress conduction down to levels where it becomes unimportant energetically (Chandran & Cowley 1998), but this issue continues to be debated theoretically (Narayan & Medvedev 2001). Observationally, electron conduction has been observed to be suppressed by factors 100 or more at cold fronts in clusters (Markevitch 2000), so the viability of this explanation also remains suspect.
7. RGS Spectroscopy of the Elliptical Galaxy NGC 4636
NGC 4636 is an E0-1 giant elliptical located in the skirt region of the Virgo cluster. The gaseous halo associated with this galaxy has a total X-ray luminosity , making it one of the three brightest ellipticals in the sky. The X-ray temperature inferred from ASCA measurements is keV, with inferred elemental abundances one third solar (Matsumoto et al. 1997). At this temperature, and the implied electron density, the gas at the core of the halo should cool on timescales less than years, leading to a cooling flow with a mass deposition rate .
The RGS spectrum of NGC 4636 is shown in Figure 5. As indicated, it is dominated by very strong K-shell line emission from N, O, Ne, and Mg, as well a rich Fe L-shell spectrum. In contrast to the cluster spectra, here we see very strong emission from the lower iron charge states, Fe XVII - XIX. This is a consequence of the much lower background temperature. The red line in the figure is our best fit thermal model for this spectrum, which involves a mean temperature keV and elemental abundances ranging from 0.5 to 1 in solar units. For further details on the spectral fit, see Xu et al. 2002.
For this case, however, we can derive additional tight constraints on physical conditions in the halo core by examining the spatial profiles of the data in the cross-dispersion direction. In particular, the RGS provides a nearly stigmatic image of the source in the cross direction. The emission line images are observed to be extended, and the particular profile that we observe for each line provides a clean indication of the distribution of the emission in that line within the halo.
This is of interest for NGC 4636, because, for the inferred halo parameters, the medium should be partially optically thick to resonance scattering for the high oscillator strength Fe L transitions. We observe this effect directly in the data. In particular, the ratio of the Fe XVII lines at 17.1 Å to the Fe XVII lines at 15.0 Å is found to be centrally peaked. Both of these sets of lines have similar emissivity dependences on temperature, so this cannot be produced by a temperature gradient. It is due to the fact that the high oscillator strength 15.0 Å line scatters several times before exiting the halo, thereby broadening its spatial distribution.
In fitting the data, we construct a Monte Carlo spatial/spectral model that is self-consistently constrained to fit both the spectrum and the cross-dispersion emission line profiles. The model is highly over-constrained. For example, the same density required to account for the line intensities, also yields the correct Fe L line optical depths to reproduce the observed spatial profiles. This can only work at one value of the distance, and the distance we infer is consistent with the known distance to the galaxy.
So for this particular case, there is essentially no ambiguity about the physical conditions in the emitting plasma. Nevertheless, the observed spectrum is still dramatically inconsistent with the cooling flow predictions. Specifically, at the implied mass deposition rate, the Fe XVII line intensities should be a factor 10 brighter than observed! Similarly, the O VII line intensities are vastly over-predicted.
Evidently, the multiphase cooling flow model also fails on the scale of an isolated elliptical galaxy, and one without a currently active nucleus. In our view, this single observation provides one of the most stringent challenges to our understanding of cooling in low density cosmic plasmas.
8. Summary and Conclusions
The first high spectral resolution X-ray observations of cooling flow clusters continue to challenge conventional models for these systems. Contrary to earlier beliefs, the deficit of soft emission is not due to excess embedded absorbing matter in the intracluster gas, but to a true lack of emission lines from the lowest temperature charge states. We find this problem in all the systems we have studied, from the most massive clusters to the gaseous haloes of individual elliptical galaxies.
Empirically, our data appear consistent with the expression given by Equation (2), where the emergent differential luminosity is proportional to the temperature raised to a power to , rather than being independent of temperature, as expected from simple thermodynamic arguments. The solution to this puzzle may represent some fundamental new physics in the cooling of low density, hot gas. If so, it may have profound implications for models of galaxy and structure formation in the early universe.
Acknowledgments.
Analysis of XMM-Newton observations at Columbia University is supported by a grant from NASA. SRON Utrecht is supported financially by NWO, the Netherland Organization for Scientific Research.
References
Balbus, S. A. & N. Soker 1989, ApJ 341, 611.
Begelman, M. & Fabian, A. C. 1990, MNRAS 244, 26.
Berschinger, E. & A. Meksin 1986, ApJ 306, L1.
Canizares, C. R. et al. 1979, ApJ 234, L33.
Canizares, C. R. et al. 1982, ApJ 262, L32.
Chandran, B. D. G. & S. C. Cowley 1998, PRL 80 Num. 14, 3077.
Cowie, L. L. & J. Binney 1977, ApJ 215, 723.
David, L. P. et al. 2001, ApJ 557, 546.
den Herder et al., A & A 365, 7.
Edge, A. C. 2001, MNRAS 328, 762.
Fabian, A. C. & P. E. J. Nulsen 1977, MNRAS 180, 479.
Fabian, A. C. et al. 2001, MNRAS 320, 20.
Johnstone, R. M. et al. 1992, MNRAS 255, 431-440.
Kaastra, J. S. et al. 2001, A & A 365, 99.
Markevitch, M. et al., 2000, ApJ 541, 542.
Mason, K. O. et al. 2001, A & A 365, 36.
Matthews, W. R. & J. N. Bregman 1978, ApJ 224, 308.
Matsumoto, H. et al. 1997, ApJ 482, 133.
Mewe, R., Kaastra, J., Liedahl, D., 1995, Legacy vol. 6, 16.
Narayan, R. & M. V. Medvedev 2001, ApJ 562, L129.
Nulsen, P. E. J. 1986, MNRAS 221, 377.
O’Dea C. P., Payne, H., & Kocevski 1998, ApJ 116, 623.
Peterson, J. R. et al. 2002, in preparation.
Peterson, J. R. et al. 2001, A & A 365, 104.
Peterson, J. R., J. G. Jernigan, & S. M. Kahn, in preparation; also Peterson, Jernigan, & Kahn, 2002, Proc. SPIE 4847.
Rosner, R. & Tucker, W. 1989, ApJ 338, 761.
Stewart et al. 1984, ApJ 278, 536.
Strüder, L. et al. 2001, A&A 365, 18.
Tabor, G. & J. Binney 1993, MNRAS 263, 123.
Tamura, T. et al. 2001, A & A 365, 87.
Tucker, W. H. & R. Rosner 1983, ApJ 267, 547.
Turner, M. J. L. et al. 2001, A & A 365, 27.
White, D. A. et al. 1991, MNRAS 252, 1991.
Xu, H. et al. 2002, astroph-0110013, ApJ in press.