Time Series Photometry of Variable Stars in the Globular Cluster NGC 6397
Abstract
Time series photometry is presented for 16 short-period variables located in the central region of the globular cluster NGC 6397. The sample includes 9 newly detected variables. The light curve of cataclysmic variable CV6 shows variability with a period of 0.2356 days. We confirm an earlier reported period of 0.472 days for cataclysmic variable CV1. Phased light curves of both CVs exhibit sine-like light curves, with two minima occurring during each orbital cycle. The secondary component of CV1 has a low average density of 0.83 g cm-3 indicating that it cannot be a normal main sequence star. Variables among the cluster blue stragglers include a likely detached eclipsing binary with orbital period of 0.787 days, three new SX Phe stars (one of which has the extremely short period of 0.0215 days), and three low amplitude variables which are possible Doradus variables.
1 INTRODUCTION
The inner region of the nearby post-core-collapse globular cluster NGC 6397 has been the target of several surveys aimed at the identification of rare or unusual stars likely to be created as the result of stellar interactions in its dense cluster core (Coll & Bolton (2002) and references therein). Recently Grindlay et al. (2001) reported the detection with of 25 X-ray sources within 2 of the cluster center. Optical searches for variable stars in the inner regions of globular clusters, particularly those with strong central density cusps, have been hindered by crowding. Image subtraction techniques in such strongly crowded fields have been successful in locating and studying variables (Olech et al. 1999; Kaluzny, Olech & Stanek 2001), especially when the data are taken with a fine plate scale with a stable and uniform point-spread function.
In this paper we present the analysis of ground-based time series CCD photometry which was obtained to study the light curves of the optical counterpart to the binary millisecond pulsar PSR J1740-5340 (D’Amico et al. 2001b; Ferraro et al. 2001). Our results for the binary pulsar are given elsewhere (Kaluzny et al. 2002). In this contribution we report on the results obtained for other variable stars located in the central part of the cluster. Light curves for a total of 16 variables are presented and discussed. Nine of these objects are new identifications.
2 OBSERVATIONS
The photometric data were obtained with the 2.5-m du Pont telescope at Las Campanas Observatory. A field of arcmin2 was observed with the TEK#5 CCD camera at a scale of 0.259/pixel. This present analysis is limited to a sub-field arcmin2 centered approximately on the cluster core. Most of the data were obtained on 6 nights during the period from UT May 1 to 8, 2002, with additional data obtained on UT June 3, 2002. Conditions were non-photometric on all but one night with average seeing of 1.0 in the -band.
The cluster was observed for a total of 32 hours through filters. Exposure times were typically 30 sec (), 15 sec (), and 10 sec (). Frames were were co-added, and the total number of stacked images used in the present study was 69 (), 196 (), and 59 (). For a few of the variables discussed below we have also extracted -band time-series photometry from images with the best seeing, selecting 1176 out of the total of 1256 available. Our observing material and photometric calibration procedure are described in detail in Kaluzny et al. (2002).
3 IDENTIFICATION OF VARIABLES
Two methods were used to detect potential variable stars. Both of them make use of the ISIS-1.2 image subtraction package (Alard & Lupton 1998; Alard 2000).
The first method is based on examination of images created by combining individual residual images, and relies entirely on tools included in the ISIS package. This method is well suited for the detection of variables with a high duty cycle 111By ”duty cycle” we mean the fraction of time in which a given star shows luminosity other than its median luminosity. An example of an object with low duty cycle is an eclipsing binary with narrow eclipses. and/or showing significant changes of flux (bright variables or faint variables with large amplitude light curves). An advantage of this method is that it permits the detection of variables which cannot be resolved with classical profile photometry in crowded fields.
The second method relies on the examination of the light curves of all objects which could be measured on a reference frame with profile fitting software. For each filter a reference frame was constructed by averaging several stacked images of the best quality. The detection of stellar objects and the extraction of photometry was accomplished using the DAOPHOT/ALLSTAR software package (Stetson 1987). The total of 4336 stars were measured on the -band reference image. The limiting magnitude depends very much on the distance from the cluster core. The faintest measured stars have and the observed luminosity function starts to diminish at . The procedure in the ISIS package was used to extract differential light curves at the position corresponding to each star detected with the DAOPHOT/ALLSTAR package. Differential light curves were then transformed to magnitudes and checked for variability. The light curves were searched for the presence of any periodic signal with the algorithm (Schwarzenberg-Czerny 1989; Schwarzenberg-Czerny 1996) and were reviewed for possible eclipse-like events.
A total of 16 variables were identified. Nine of these are new detections. Information on these variables is presented in Table 1. Column 1 gives an assigned name following Clement et al. (2001), followed by the right ascension and declination of the variable 222Clement et al. (2001) list 12 variables in NGC 6397, V1-V12. Four variables listed in Table 1 are present in the Clement et al. paper, and we copy their name assignments (V7, V10, V11 and V12). Variables V13-V24 are not in the Clement et al. catalogue.. Column 5 gives alternate designations for the variables, many of which have been previously identified as blue stragglers, UV bright objects, and/or candidate cataclysmic variables.
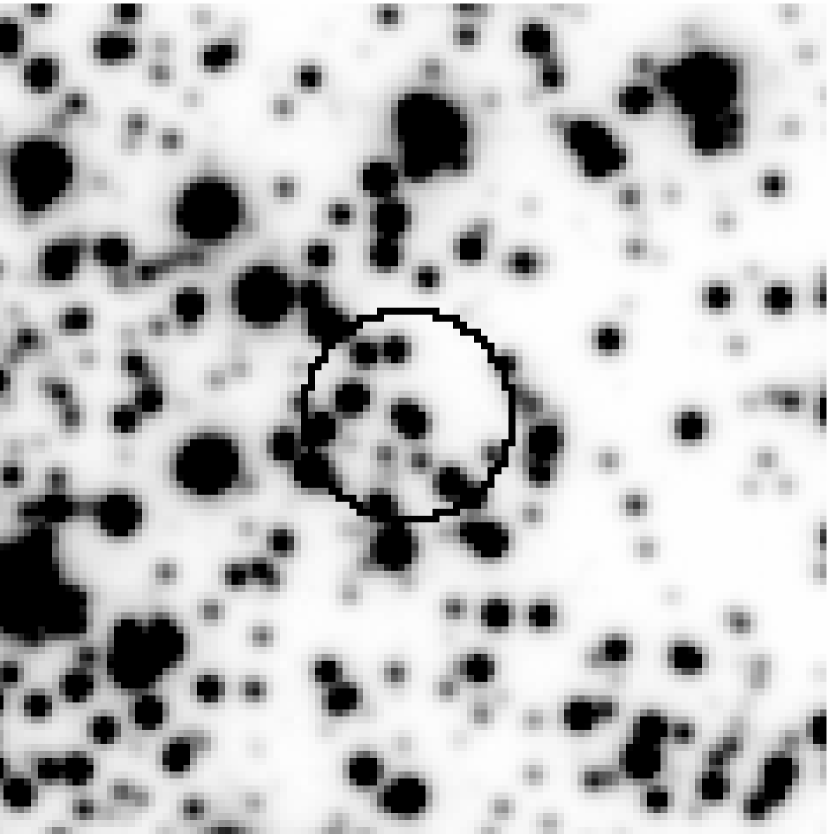
Table 1 also gives positional information for all 16 variables. Columns 2 and 3 list equatorial coordinates, while column 4 lists pixel coordinates of the variables as found on archive image u5dr0401r for 12 of the 16 variables. The equatorial coordinates were derived from the frame solution included in the image header. We derived equatorial coordinates for the four variables laying outside the field from an astrometric solution to our band reference image based on 1022 stars with equatorial coordinates adopted from Kaluzny (1997). This solution has residuals not exceeding 1 when compared to the astrometric solution. Finding charts for variables V10, V22 and V23 can be found in Lauzeral et al. (1992; stars 11, 8 and 16 in their Fig. 1), and a finding chart for variable V24 is shown in Figure 1.
Basic information on the photometric properties of the 16 detected variables is presented in Table 2. Column 1 lists the variable name, followed by a classification of the light curve, the period of variability, mean , , and magnitudes, and the -band full amplitude of variability. Positions of the variables in the cluster color-magnitude diagram are shown in Fig. 2. The ellipsoidal variable V16 is the optical counterpart to the millisecond binary pulsar J1740-5340 (D’Admico et al. 2001; Ferraro et al. 2001). Photometry of this variable is discussed in Kaluzny et al. (2002).
4 ANALYSIS OF PHOTOMETRY
4.1 Cataclysmic Variables
Grindlay et al. (2001) detected 9 possible cataclysmic variables (CV) in the central region of NGC 6397 with the telescope, naming the objects CV1 - CV9. They identified the optical counterparts of CV1 - CV5 based on observations reported by Cool et al. (1995, 1998), Grindlay (1999), and unpublished HST H- observations (Grindlay et al. 2001).
Variable V12 can be unambiguously identified with CV1 using positional data provided in Cool et al. (1998; see their Table 1). From an examination of the HST archive image u5dr0401r at the equatorial coordinates of V13 we conclude that this star is the optical counterpart of CV6. On the image V13 is visible as an isolated object with a closest neighbor at a distance of .
Variables CV2 - CV5 and CV7 - CV9 could not be resolved on our reference images. We attempted to extract differential light curves using the ISIS package at the known positions of these stars. The light curves suffered from large photometric errors and showed no sign of any periodicity. The large errors result from the effects of several relatively bright stars near the variables.
4.1.1 CV1
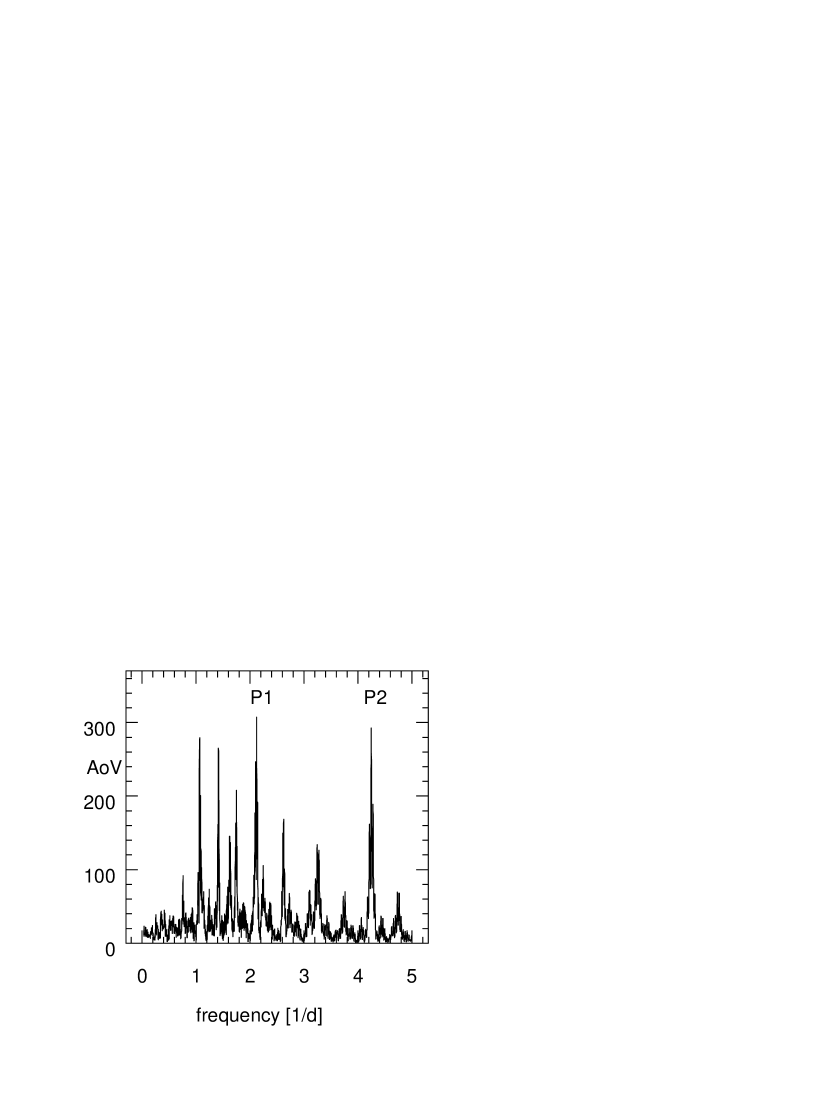
Examination of the light curves of V12 = CV1 reveals the presence of a sine-like periodic modulation. The power spectrum calculated from the filter time series photometry based on individual exposures is presented in Fig. 3. Two maxima of comparable strength are present at frequencies corresponding to periods of 0.4712 and 0.2356 days. Grindlay et al. (2001) report that CV1 showed one total eclipse in X-rays through the 0.567 days observation obtained with , and therefore we may eliminate the shorter period from consideration. Nightly light curves of CV1 phased with the period of 0.4712 days are displayed in Fig. 4. The average value of the formal error of a single data point is 0.042 mag. It is worth noting that the shape of the light curve as well as the average luminosity of the system are relatively stable over the interval covered by our observations. Figure 5 shows phased light curves corresponding to photometry extracted from averaged images. Neither the amplitude nor the shape of the light curves change noticeably with band-pass. The light curves are quite symmetric with two maxima of comparable height separated by half of the period. The two observed minima have comparable depths although the minimum occurring at phase zero is slightly sharper. These properties of the light curves of CV1 suggest that the observed variability is dominated in optical domain by the ellipsoidality effect caused by rotation of the Roche lobe filling component, and that the 333For cataclysmic variables it is conventional to call the degenerate component the ”primary” and its companion the ”secondary”, independent of the actual mass ratio of a given system. secondary dominates optical flux of the system. Such an interpretation is consistent with the relatively red colors of CV1. The variable is located about 0.1 mag to the blue of the cluster main sequence on the plane and it is located slightly to the red of the main sequence on the plane (See Fig. 2). At the time of our observations the optical flux generated by the accretion process apparently contributed a small fraction of the total optical luminosity of the binary.
Another interesting property of CV1 is its relatively long orbital period. Among 318 cataclysmic variables which are listed in Ritter & Kolb (1998) there are only 14 objects with periods longer than 0.47 days. It is possible to get a robust and reliable estimate of the average density of the secondary component of CV1 from the formula in Faulkner et al. (1972) and Eggleton (1983):
| (1) |
where the period P is in hours and the density is in . We obtain . The binary is located well below the cluster turn-off and therefore we may expect that mass of the secondary does not exceed . Theoretical models published recently by Bergbusch & VandenBerg (2001) give an average density , for a ZAMS model of a 0.8 solar mass star with . For a mass lower than m⊙ the expected density is even higher as . We conclude that the secondary component of CV1 is noticeably over-sized compared to a normal low-mass main-sequence star.
Knowing the distance modulus of the cluster we may derive an absolute luminosity of the variable. For and (Reid & Gizis 1998) we obtain for the average absolute magnitude of CV1 in the -band. It is tempting to use that information to derive the radius of the secondary star but we feel that uncertainties in relative intensity of the accretion generated flux to the total observed luminosity are too large. Such uncertainties affect not only the estimate of the flux from the secondary but also any estimate of its effective temperature. These problems can be greatly reduced by observing the binary at near-IR wavelengths where the total flux of the system should be strongly dominated by the secondary star.
We conclude this part of the discussion by noting that X-ray observations presented by Grindlay et al. (2001) are consistent with the identification of CV1 as either an ordinary dwarf nova or a magnetic CV.
4.1.2 CV6
The power spectrum of the band light curve of V13 = CV6 shows strong peaks at periods of 0.1176 and 0.2352 days. An examination of the light curves from individual nights indicates that they exhibit two minima of different shape separated by about 0.12 days. This is particularly clear in the light curve extracted from individual images collected on the night of UT May 1, 2002, which is presented in Fig. 6. The light curves of CV6 phased with a period of 0.2352 days are shown in Fig. 7. They are based on photometry extracted from averaged images. The shape and mean level of the light curves were quite stable during our observations. As for CV1 the variability of CV6 seems to be dominated by the ellipsoidality effect. The minimum occurring at phase 0.0 is narrower than the minimum at phase 0.5. We interpret this as evidence that the bright accretion region surrounding the primary component of the binary is eclipsed at phase 0.0. The variable is located about to the blue of the cluster main sequence in the plane (see Fig. 2) and in the plane it is located at the red edge of the cluster main sequence.
Assuming cluster membership for CV6 we estimate . The average density of the secondary component is , consistent with the density expected for a slightly evolved Pop II main sequence star of mass . In particular, models published by Girardi et al. (2000) predict and for 0.7 solar mass star of age 11 Gyr.
4.2 Eclipsing Binaries
Our sample of variables includes four eclipsing binaries. In this section we comment briefly on their properties, a detailed analysis will require spectroscopic observations.
Variable V7 was identified as a W UMa variable by Kaluzny (1997). This star has two close visual companions with and located at angular distances of and , respectively. Despite the proximity of the companions the pixel scale of the observations together with the high signal-to-noise data meant that photometry could be measured for both companions in our band data. Only the brighter companion could be measured while extracting photometry for the and bands. Both companions were unresolved in the photometry reported by Kaluzny (1997), leading to an overestimation of the luminosity of V7 as reported in that paper. Variable V19=PC-1 was identified by Taylor et al. (2001) in a photometric survey for objects with excess flux. They also detected V7 in the course of their survey. V19 has a close visual companion of at angular distance of . That companion is measured in our photometry for all bands.
Phased -band light curves of V7 and V19 are shown in Fig. 8. Some intrinsic night-to-night changes of the shape of the light curve were observed for V7. Such behavior is not unusual for W UMa type systems. There is some indication that the secondary minimum of V7 exhibits a ”flat-bottom” indicating that this eclipse is total. For W UMa type systems with total eclipses one may obtain reliable light curve solutions as totality removes the degeneracy between the mass ratio and inclination of the system (Mochnacki and Doughty 1972). These two contact binaries have similar colors and lie about mag above cluster main sequence on the color-magnitude diagram, suggesting that that they are most likely members of NGC 6397.
Variable V14 is a relatively faint eclipsing binary located about 0.1 mag to the red of the cluster main sequence. Its phased light curve is presented in Fig. 9, two shallow minima of different depth are seen. Main sequence binaries with periods below 0.35 days almost always show ordinary EW type light curves, a signature of a contact configuration. If V14 is a member of NGC6397 then its red color and faint magnitude would suggest the components are of late spectral type with low masses and radii. In this case V14 could be a close but non-contact binary despite its short period.
Variable V18 is by far the most interesting of the four eclipsing binaries included in our sample. It is not only a likely blue straggler but it also shows a very unusual light curve (see Fig. 10). At first glance it resembles the light curves of ordinary W UMa type contact binaries. However the light curve of V18 shows clear signatures of eclipse ingress and egress, not observed in contact binaries. We conclude that V18 is a detached or semi-detached system composed of stars with very similar surface brightness. The light curve is similar in all 3 filters with some indication that eclipses become progressively shallower from the to the band by mag.
Examination of images of the cluster shows that V18 possesses a close visual companion at an angular distance of 0.19 . It has not been resolved in our profile photometry and hence its flux acts as a ”third” light in the photometry of V18. We have identified the companion as star 200338 in the data base published by Piotto et al. (2002), with and . We adjust these magnitudes to and to take into account differences in the zero points of the two sets of photometry of and for the and filters, respectively (our magnitudes are brighter). Since -band data are not included in the Piotto et al. (2002) study we estimate -band photometry from the fact that the V18 companion lies on the cluster main sequence. From the photometry of NGC 6397 published by Alcaino et al. (1997) we estimate that for the companion has . Light curves presented in Fig. 10 as well as magnitudes listed for V18 in Table 2 are corrected for the contribution of the nearby companion.
Attempts to derive a reliable light curve solution for V18 are hampered by the lack of vital information on the mass ratio of the binary. We have calculated a grid of solutions for a wide range of assumed values of the mass ratio . Index ”1” refers to star eclipsed at phase ”0”. The -band light curve was was solved using Wilson-Devinney code (Wilson 1979) embedded in the MINGA minimizing package (Plewa 1988). Our preliminary results can be summarized as follows. For solutions imply a detached configuration with an inclination in the range deg. The ratio of component radii is constrained to the range . For solutions converge to semi-detached configurations with the less massive component filling its Roche lobe. The statistic measuring the quality of fit of the synthetic light curve to the observations has a minimum near . A solution for that specific value of the mass ratio gives inclination deg and average relative radii of the components and . If the mass ratio is close to 0.2 and the system is detached, then one may wonder why both components have very similar effective temperatures. Note that the color of the variable is essentially constant over the whole orbital period. However, if the mass ratio is close to unity then we face difficulty trying to explain how this blue straggler can be composed of two stars both of which are significantly bluer and more luminous than stars at the cluster turnoff. Spectroscopic data providing information about mass ratio of the binary are needed to reliably determine its geometrical and absolute parameters.
4.3 SX Phe Stars
SX Phe type variables are short period pulsating stars which can be considered Pop II counterparts of more metal rich Sct type stars. It is not unusual to find them among blue stragglers in globular clusters (Rodriquez & López-Gonzáles 2000). Variables V10 and V11 were originally identified as SX Phe stars by Kaluzny (1997). Here we add three more objects to that group. Light curves of all five variables show modulation of shape and amplitude indicating the presence of multimodal pulsations. A detailed analysis of these data will be published in a separate paper (Schwarzenberg-Czerny et al.; in preparation). Here we note only that variables V10 and V15 have extremely short dominant periods, at 0.0215 days V15 has the shortest period known for an SX Phe star. No SX Phe stars with periods below 0.030 days are listed in the recently published catalog of Rodriquez & López-Gonzáles (2000). We considered the possibility that V15 is not an SX Phe type star but rather a pulsating hot subdwarf. However its color is too red to be a bright sdB/O star (note the position of V15 in Fig. 2).
4.4 Other Variables
In this section we discuss briefly four variables which cannot be classified with confidence based on the available data.
Variable V20 is one of the brightest blue stragglers identified in the cluster core by Lauzeral et al. (1993). The power spectrum of its light curve shows two major peaks at periods of 0.861 and 0.436 days, with the higher peak corresponding to the longer period. The band light curves of V20 phased with each of these two periods are shown in Fig. 11. For the longer period the light curve has two minima, and this suggests that V20 is a low amplitude W UMa type system. The feature visible at the second quadrature arises from a different light level observed on the single night of June 3, roughly one month after the first observing run when most of the data were collected. The period of 0.861 days is relatively long for a contact binary belonging to a globular cluster (Rucinski 2000). Yet another possibility is that V20 is a close binary with variability due to the ellipsoidality effect. The light curve phased on the shorter period is slightly more noisy with a single minimum. The period of 0.436 days is far too long to classify V20 as a pulsating SX Phe star. The variable is too hot to show spot-related activity as is observed for FK Com or BY Dra type stars. However, it can be related to Doradus stars, as it is discussed below for two other variables.
Phased -band light curves for variables V17 and V24 are presented in Fig. 12. They both show low amplitude, sine-like modulation, with periods of 0.457 days and 0.525 days for V24 and V17, respectively. On the color-magnitude diagram the stars are located about 0.15 mag to the red of the cluster turnoff. We propose that V17 and V24 are Pop II counterparts of Doradus variables. The Doradus stars have often multiple periods between 0.4 and 3 days and show sinusoidal light curves with amplitudes – in optical domain – of the order of 0.01 mag (Zerbi 2000; Henry & Fekel 2002). Their variability is due to non-radial -mode pulsations and they are usually subgiants or, less frequently, main sequence stars of spectral type F0-F2. The red edge of the instability strip for Pop I Doradus variables is located at (Henry & Fekel 2002). The dereddened colors of V17 and V24 are and , respectively. Henry & Fekel (2002) note that Doradus variables show average amplitude ratios of 1.3. This distinguishes them from ”spotted” variables which have amplitude ratios of 1.1 and from ellipsoidal variables for which the ratio is 1.0. From our data we obtain and for V17 and V24, respectively. More extended time series would allow a more accurate estimate of the ratio for both variables and would also help to search for multiperiodicity in the light curves. The stability of Doradus light curves 100-200 cycles also distinguishes these stars from ”spotted” variables.
Variable V22=BS8 is a bright blue straggler which was identified in the cluster core by Lauzeral et al. (1993). The light curve of V22 cannot be phased with a single period although during May run we observed four minima occurring in 1 and 2 day intervals. The light curve extracted from observations obtained on nights of 9 and 10 July, 1995 (Kaluzny 1997) shows variations with and a possible period of about 0.75 days. However that period does not fit the 2002 data. It is possible that V22 is a pulsating multiperiodic variable related to Doradus stars or that it is a distant RR Lyr variable of RRd type. In Fig. 13 we show light curves from two nights on which the observed variations were most pronounced.
5 SUMMARY AND CONCLUDING REMARKS
We have used time series photometry obtained with a medium sized telescope to look for short period variables in the central part of the post-core-collapse cluster NGC 6397. We show that by applying the image subtraction technique that it is possible not only to detect variable stars in very crowded fields but also to measure accurate light curves for objects with amplitudes as small as 0.01 mag. Photometry of NGC 6397 obtained with imaging (Piotto et al. 2002) allows a check and, if necessary, a correction for contamination from possible visual companions which are unresolved in ground-based data.
We present the first complete light curves and derive orbital periods for two cataclysmic variables in NGC 6397. The total flux and variability of both of these CV’s is dominated by the secondary components.
Several new variables have been identified among the cluster blue stragglers, including one detached binary and three objects being possible Pop II counterparts of Doradus stars.
The determination of cluster membership of the detected variables has relied on their positions in the cluster CMD. While the cluster is located on the sky near the Galactic bulge at deg and deg, in the central region cluster stars must prevail strongly. However we cannot exclude the possibility that some of the variables are field interlopers. The publication of proper motion catalogs (Cool & Bolton 2002) will be exceptionally useful in resolving issues of cluster membership.
References
- Alard (2000) Alard, C. 2000, A&A, 144, 363
- Alard & Lupton (1998) Alard, C., & Lupton, R. H. 1998, ApJ, 503, 325
- Alcaino et al. (1997) Alcaino, G., Liller, W., Alvarado, F., Kravtsov, F., Ipatov, A., Samus, N., & Smirnov, O. 1997, AJ, 114, 1067
- Berbusch & VandenBerg (2001) Bergbusch, P.A., & VandenBerg, D.A. 2001, ApJ, 556, 322
- Clement et al. (2001) Clement, C. M. et al. 2001, AJ, 122, 2587.
- Cool et al. (1998) Cool, A.M., Grindlay, J.E., Cohn, H.N., Lugger, P.M., Bailyn, C. 1998, ApJ, 508, L75
- Cool & Bolton (2002) Cool, A.M., & Bolton, A.S. 2002, in ”Stellar Collisions, Mergers and their Consequences”, ASP Conf. Series, Vol. 263, ed. M.Shara, in press (astro-ph/0201166)
- D’Amico et al. (2001) D’Amico, N., Possenti, A., Manchester, R. N., Sarkissian, J., Lyne, A. G., & Camilo, F. 2001b, ApJ, 561, L89
- Eggleton (1983) Eggleton, P.P. 1983, ApJ, 268, 386
- Faulkner et al. (1972) Faulkner, J., Flannery, B.P., & Warner, B. 1972, ApJ, 175, L79
- Ferraro et al. (2001) Ferraro, F. R., Possenti, A., D’Amico, N., & Sabbi, E. 2001, ApJ, 561, L93
- Grindlay et al. (1995) Grindlay, J.E., Cool, A.M., Callanan, P.J., Baiylyn, C.D., Cohn, H.N., & Lugger, P.M. 1995, ApJ, 455, L47
- Grindlay et al. (2001) Grindlay, J. E., Heinke, C.O., Edmonds, P. D., Murray, S. S., & Cool, A. M. 2001, ApJ, 563, L53
- Harris (1996) Harris, W. E. 1996, AJ, 112, 1487
- Henry & Fekel (2002) Henry, W.G., & Fekel, F.C. 2002, PASP, 114, 988
- Kaluzny (1997) Kaluzny, J. 1997, A&AS, 122, 1
- Kaluzny et al. (2001) Kaluzny, J., Olech, A., Stanek, K.Z. 2001, AJ, 121, 1533
- Kaluzny et al. (2002) Kaluzny, J., Rucinski, S.M., & Thompson, I.B. 2002, astro-ph/0209345
- Kwee & van Woerden (1956) Kwee, K. K., & van Woerden, H. 1956, Bull. Astron. Inst. Netherlands, 12, 327
- Lauzeral et al (1992) Lauzeral, C., Ortolani, S., Auriére, M., Melnick, J. 1992, A&A, 262, 63
- Mochnacki & Doughty (1972) Mochnacki, S.W., & Doughty, N.A., 1972, MNRAS, 156, 51
- Piotto et al. (2002) Piotto, G. et al. 2002, A&A, 391, 945
- Plewa (1988) Plewa, T. 1988, Acta Astron., 38, 415
- Olech et al. (1999) Olech, A., Wozniak, P.R., Alard, C., Kaluzny, J., Thompson, I.B. 1999, MNRAS, 310, 759
- Ritter & Kolb (1998) Ritter, H., & Kolb, U. 1998, A&AS, 129, 83
- Reid & Gizis (1998) Reid, I. N., & Gizis, J. E. 1998, AJ, 116, 2929
- Rodriguez & Lopez-Gonzales (2000) Rodriguez, E., López-González, M.J. 2000 A&A, 359, 597
- Rucinski (2000) Rucinski, S.M. 2000, AJ, 120, 319
- Schwarzenberg-Czerny (1989) Schwarzenberg-Czerny, A., 1989, MNRAS, 241, 153
- Schwarzenberg-Czerny (1996) Schwarzenberg-Czerny, A., 1996 ApJ, 460, L107
- Stetson (1987) Stetson, P. B. 1987, PASP, 99, 191
- Taylor et al. (2001) Taylor, J. M., Grindlay, J. E., Edmonds, P. D., & Cool, A. M. 2001, ApJ, 553, L169
- Wilson (1979) Wilson, R. E. 1979, ApJ, 234, 1054
- Zerbi (2000) Zerbi, F.M., 2000, in “ Delta Scuti and Related Stars”, ASP Conf. Ser. 210, eds. M. Breger & M.H. Montgomery, p. 322


| Name | R.A. | Decl. | HST | ID |
|---|---|---|---|---|
| (1) | (2) | (3) | (4) | (5) |
| V7 | 17 40 43.74 | -53 40 35.6 | W4(100,222) | WF4-2 |
| V10 | 17 40 37.43 | -53 40 36.4 | BS11 | |
| V11 | 17 40 43.95 | -53 40 40.9 | W4(151,246) | BS9 |
| V12 | 17 40 41.42 | -53 40 19.6 | W1(489,504) | U23, CV1 |
| V13 | 17 40 48.82 | -53 39 49.0 | W3(511,101) | U10, CV6 |
| V14 | 17 40 46.31 | -53 41 15.9 | W4(548,348) | |
| V15 | 17 40 45.24 | -53 40 25.2 | W4(122,53) | BS10 |
| V16 | 17 40 44.44 | -53 40 42.0 | W4(190,223) | MSP, WF4-1 |
| V17 | 17 40 43.63 | -53 41 16.8 | W4(384,522) | |
| V18 | 17 40 43.45 | -53 40 28.1 | PC(345,91) | |
| V19 | 17 40 44.66 | -53 40 23.8 | PC(386,266) | PC-1 |
| V20 | 17 40 41.51 | -53 40 33.7 | PC(697,276) | BS6 |
| V21 | 17 40 41.40 | -53 40 23.9 | PC(559,441) | BS7 |
| V22 | 17 40 41.02 | -53 40 42.2 | BS8 | |
| V23 | 17 40 39.21 | -53 40 46.9 | BS16 | |
| V24 | 17 40 38.97 | -53 40 23.3 |
Note: Cols. (2)-(3): Units of right ascension are hours, minutes and seconds, and units of declination are degrees, arcminutes, and arcseconds. Col. (5) Pixel coordinates on the HST archive image u5dr0401r proceeded by a name of WFPC-2 camera CCD. Col. (6) Other names of variables used in Grindlay et al. (2001), Taylor et al. (2001), and Lauzeral et al. (1992)
| Name | Type | Period | ||||
|---|---|---|---|---|---|---|
| V7 | W UMa | 0.2699(2) | 17.72 | 17.05 | 16.11 | 0.47 |
| V10 | SX Phe | 0.03006 | 16.36 | 15.97 | 15.46 | 0.12 |
| V11 | SX Phe | 0.03826 | 15.78 | 15.40 | 14.88 | 0.05 |
| V12 | CV | 0.472(2) | 18.51 | 17.95 | 16.96 | 0.37 |
| V13 | CV | 0.2352(5) | 20.04 | 19.35 | 18.27 | 0.45 |
| V14 | Eclipsing | 0.3348(7) | 20.21 | 19.19 | 17.93 | 1.02 |
| V15 | SX Phe | 0.02145 | 15.80 | 15.44 | 14.94 | 0.05 |
| V16 | Ell | 1.35406 | 17.36 | 16.65 | 15.71 | 0.15 |
| V17 | Dor? | 0.525(5) | 16.81 | 16.17 | 15.32 | 0.025 |
| V18 | Eclipsing | 0.7871(3) | 16.23 | 15.71 | 15.01 | 0.14 |
| V19 | W UMA | 0.2538(2) | 17.75 | 17.09 | 16.16 | 0.06 |
| V20 | W UMa?, Dor? | 0.861(3) | 16.22 | 15.75 | 15.08 | 0.04 |
| V21 | SX Phe | 0.03896 | 15.88 | 15.48 | 14.91 | 0.30 |
| V22 | ? | ? | 16.61 | 16.16 | 15.58 | 0.11 |
| V23 | SX Phe | 0.03717 | 16.05 | 15.66 | 15.14 | 0.04 |
| V24 | Dor? | 0.457(2) | 17.07 | 16.45 | 15.60 | 0.02 |
Note: Periods are given in days. magnitudes are given at maximum brightness with exception of SX Phe stars for which average magnitudes are listed. The last column gives the difference between observed extremes for the light curves: . For CVs the quoted magnitudes refer to 8 nights from the beginning of UT May, 2002.