The impact of galaxy formation on X-ray groups
Abstract
Using hydrodynamical simulations of the CDM cosmology, that include both radiative cooling and a phenomenological model for star formation and supernovae feedback, we investigate the impact of galaxy formation on the X-ray properties of groups at redshift zero. Motivated by the observed “break” in the relation at keV, our feedback model is based on the assumption that supernovae imprint a temperature scale on the hot gas, with the star formation rate and corresponding reheated gas mass then depending only on the available energy budget. We demonstrate that a strong feedback model with a heating temperature comparable to this break (keV), and an energy budget twice that available from supernovae (), raises the core entropy of groups sufficiently to produce an adequate match to their observed X-ray properties. A lower value of increases the star formation rate without significantly affecting the X-ray properties of groups, and a model with reproduces the observed fraction of baryons in stars. However, a heating temperature which is lower than the virial temperatures of the groups leads to an excess of cooling gas that boosts their X-ray luminosities, due to the failure of the reheated material to escape from the gravitational potential. A limited study of numerical resolution effects reveals that the temperature of poorly-resolved objects is underestimated, therefore (in our case) a fully-resolved group population would lead to a steeper relation, bringing our results into even better agreement with the observations.
keywords:
hydrodynamics - methods: numerical - galaxies: formation - X-rays: galaxies: clusters1 Introduction
Groups 111We use the term “groups” to mean systems with X-ray temperatures of order 1 keV or lower are the most common agglomerates of galaxies in the low-redshift universe and also harbour the majority of currently detected baryons (Fukugita, Hogan & Peebles 1998), observed because of their emission of soft X-rays ( 0.1-1 keV). The simplest explanation for the properties of this gas is that it was shock-heated during the gravitational collapse and virialization of the system. For self-similar () systems, this leads to a simple scaling between X-ray luminosity and temperature, , where denotes the cooling rate of the gas.
In the largest clusters, the virial temperature is sufficiently high that the gas predominantly emits bremsstrahlung radiation, leading to the scaling (Kaiser 1986). This result was recently vindicated by Allen, Schmidt & Fabian (2002) using high-quality Chandra data. In smaller systems, the increasing importance of line emission boosts the luminosity and so should flatten the relation. Observationally the converse is true, with the slope of the relation for low-mass groups being as high as (e.g. see Xue & Wu 2000 for a recent compilation). This result is also reflected in the low amplitude of the soft X-ray background, around an order of magnitude lower than predicted from gravitational heating models (e.g. Pen 1999; Bryan & Voit 2001; Wu, Fabian & Nulsen 2001).
Evrard & Henry (1991; see also Kaiser 1991; Bower 1997; Voit et al. 2002) argued that the deficit in luminosity is due to additional physical processes raising the entropy of the gas. (Entropy is invariant under adiabatic processes, making it a useful variable for characterizing the effects of cooling and heating on the gas distribution.) Gravitational heating leads to the mean entropy of a self-similar system scaling as 222We use the term entropy to mean , and assume , for a monatomic ideal gas. Increasing the entropy of the gas corresponds to a hotter but less-concentrated distribution. Consequently, for a given increase in entropy, the X-ray emissivity is lowered preferentially in low-mass systems, steepening the relation. Ponman, Cannon & Navarro (1999) measured the entropy of groups and clusters at 10 per cent of their virial radii, and showed that low-mass clusters and groups deviated from the self-similar prediction, tending to a constant value of keV cm2 (albeit with very large scatter).
The precise origin of the excess entropy is still unclear, but is most probably a direct consequence of the galaxy formation process (Evrard & Henry 1991). For example, galactic winds from supernovae explosions and/or active galactic nuclei (AGN) could heat the gas, raise its entropy, and allow it to convect out to lower density environments. Winds have already been observed in low-redshift starburst (e.g. Heckman 2000) and high-redshift Lyman Break (e.g. Pettini et al. 2001) galaxies, and the presence of metal-enriched gas in low-density regions suggests galactic material has been expelled from haloes (e.g. Schaye et al. 2000). Note that in hierarchical models, at least some heating (feedback) is required in order to regulate the star formation rate (e.g. White & Rees 1978; Balogh et al. 2001).
The amount of energy required to generate excess entropy depends on environment. If the gas was close to mean density when heated (the pre-heating scenario) only keV of energy per particle is required (Lloyd-Davies, Ponman & Cannon 2000). More realistically, if the heating occurred in high-density regions, as much as 1-3 keV per particle is required (e.g. Wu, Fabian & Nulsen 2000; Kravtsov & Yepes 2000; Bower et al. 2001; Borgani et al. 2002). Note, however that the total energy production is smaller in the latter case as only gas in the cores of haloes need be heated.
Excess entropy is also generated by the process of star/black-hole formation itself, removing cold, low-entropy material and causing higher-entropy material to flow in to replace it (Knight & Ponman 1997). Models using only radiative cooling to generate the excess entropy have been implemented by a number of authors, and have proved successful in reproducing a number of X-ray scaling relations (e.g. Pearce et al. 2000; Bryan 2000; Voit & Bryan 2001; Muanwong et al. 2001,2002; Wu and Xue 2002a,2002b; Davé et al. 2002). Voit & Bryan (2001) demonstrated that the entropy–temperature locus of gas with a range of temperatures and densities set by equating their cooling times to the age of the universe, closely matches the relation observed by Ponman et al. (1999). Voit & Bryan further argued for the presence of an entropy floor by asserting that cooled gas will either form stars or be heated (by stars or AGN) and move to a higher adiabat.
The aim of this paper is to investigate how galaxies which form in a cosmological simulation impact upon the X-ray properties of groups. This treatment allows us to incorporate cooling and heating processes in a self-consistent manner. Specifically, we include the effects of both radiative cooling/star formation and feedback of energy from supernovae in our simulations, but neglect an AGN component (although in broad terms, the effects of including AGN may largely mimic the desired effects of supernovae, since both are ultimately powered by cooling gas). Motivated by the observed “break” in the relation at the interface between groups and clusters (keV), our feedback model is fundamentally based on the assumption that cold gas is reheated to a fixed temperature and the mass ratio of reheated gas to stars is determined by the overall energy budget. As we shall see, our model is able to reproduce the required entropy excess, provided that the heating temperature is sufficiently high to allow the majority of reheated gas to escape from haloes, while varying the energy budget primarily controls the fraction of baryons in stars.
We organize the remainder of this paper as follows. In Section 2 we outline our method, giving details of the simulations as well as our approach to cooling, star formation and feedback. Section 3 presents the predicted X-ray group scaling relations for our fiducial simulation at . In Section 4 we investigate our feedback model in more detail, concentrating on the effects of varying parameters. In Section 5, we perform a limited study of numerical resolution effects and summarize our conclusions in Section 6.
2 Simulation details
2.1 Overview
Results are presented for the currently-favoured CDM cosmology, setting the density parameter, , Hubble constant, , cosmological constant, , baryon density, , and power spectrum normalisation, . The latter value, recently measured from both cluster abundances (e.g. Seljak 2002) and galaxy clustering (Lahav et al. 2002), is around 20 per cent lower than previous determinations which deduced (although, weak lensing statistics still prefer the higher value; see e.g. Refregier et al. 2002). We find that increasing from 0.7 to 0.9 has only a small effect on the results presented in this paper, but the lower value gives us a numerical advantage, requiring fewer timesteps to evolve to .
Simulation data were generated using a parallel (OpenMP) version of the hydra code (Couchman, Thomas & Pearce 1995; Theuns et al. 1998), a combination of the AP3M algorithm (Couchman 1991) to compute gravitational forces and Smoothed Particle Hydrodynamics (SPH; see Monaghan 1992) to calculate gas forces. For the gas, neighbour lists were computed using the recursive binning technique described in Theuns et al. (1998), allowing the density to be estimated for gas particles in low-density regions. SPH forces were calculated using an artificial viscosity based on pairwise particle separations (Monaghan 1992) rather than the local velocity divergence. Our SPH implementation now also includes the force-correction terms suggested by Springel & Hernquist (2002), resulting in improved entropy conservation.
Initial conditions were generated using the cosmic package supplied with the publicly available version of hydra. We made a small modification to cosmic so that the large-scale structure is preserved when increasing the numerical resolution. For our main results, we adopted a comoving box-size of , populated with a perturbed grid of 2,097,152 () dark matter and gas particles each. (Note that the box-size is big enough to give statistically meaningful results; Bryan & Voit 2001.) These choices set our gas and dark matter particle masses to and respectively. We have chosen this resolution so not to expect significant heating of the gas due to two-body encounters with the dark matter particles (Steinmetz & White 1997). Gravitational forces were softened on short scales using a spline kernel with an equivalent Plummer softening length of . Gas forces were also limited by fixing the minimum SPH smoothing radius to the gravitational softening .
All but the smallest runs were performed on the UK Cosmology Consortium COSMOS Origin 3800 supercomputer in Cambridge, using between 10 and 20 processors. Simulations were started at and evolved to , typically taking between 2000 and 4500 steps, depending on the choice of resolution and feedback model.
2.2 Radiative cooling and star formation
Radiative cooling was implemented following the method of Thomas & Couchman (1992), using tabulated cooling rates given by Sutherland & Dopita (1993). For the present paper, we adopt a global metallicity scaling law, , to approximate the gradual enrichment of the intergalactic medium. In principle, we could model metal enrichment self-consistently, since it is a by-product of the supernovae explosions. (We have already done this to study the impact of dwarf galaxies on the high-redshift intergalactic medium; Theuns et al. 2002.) In order to simplify matters however, we have decided to leave such a study to a subsequent paper.
We follow the star formation prescription used by Kay et al.(2002, hereafter K2002), converting gas with and K into stars at the end of each timestep. This density threshold is low compared to measured empirical density thresholds in galaxies (e.g. Kennicutt 1998) but is close to our resolved density maximum. Increasing the density threshold above the resolution threshold induces a delay to the star formation, increasing the gas to stars ratio within each galaxy (K2002).
Subsequent to the star formation routine, we identify groups of 10 stars within the current gravitational softening length and merge them into a single galaxy fragment. These fragments are comparable in mass to the dark matter particles and the reduction in the number of particles provides a modest decrease in the CPU time per step.
2.3 Feedback
The essence of any feedback model is to create a diffuse hot phase which powers a wind, providing a mechanism to transport gas away from star forming regions. However, explicitly modelling a multi-phase medium in a cosmological simulation is impossible because of its limited resolution. This problem has prompted two approaches to implementing feedback within such simulations.
One method is to assume that each resolution element (in the case of SPH, a single gas particle) is representative of a multi-phase medium (cold and hot gas and stars), and to solve explicitly for the flux of material between each phase, using a set of physical arguments as laid out by McKee & Ostriker (1977). This approach has been implemented and proved effective by various authors, using both grid-based codes (e.g. Yepes et al. 1997) and SPH (e.g. Hultman & Pharasyn 1999; Springel & Hernquist 2003). The main advantage of this method is that it does not depend explicitly on numerical resolution, and so should be less sensitive to discreteness effects. On the other hand, the phases cannot move independently (although see Springel & Hernquist 2003).
An alternative approach, which we take here, is to allow each particle to represent only one phase and use a set of simple rules to overcome any associated discreteness problems. This has the advantage of being much simpler to implement than the previous method and allows each phase to move freely. K2002 reviewed a number of feedback models within this context; in this paper, we consider an improved version of the thermal feedback approach studied by K2002 and outline details of this method below.
2.3.1 Feedback energetics

The amount of energy available from each star particle at time, , to heat the gas over a timestep, , is
| (1) |
where is the mass of a star particle, is the star formation time and & are the rates of Type Ia and Type II supernovae (SNe) per solar mass of stars formed. (We assume each Type Ia supernova contributes half the energy of a Type II supernova.)
Lia et al. (2002) tabulated for various initial mass functions (IMF), using the Padova stellar evolutionary tracks (Portinari et al. 1998). We adopt the Lia et al. rates for a Salpeter IMF (given in their Table 2) and illustrate integrated versions in Fig. 1. The contribution from Type II SNe rises dramatically after approximately 3 million years, lasting for around 70 million years. Type Ia SNe start contributing later, at around 100 million years, but are still going off after 10 billion years. The total number of Type II SNe is around an order of magnitude higher than the number of Type Ia SNe, and so provides the dominant source of feedback of energy to the interstellar medium.
The parameter modulates the overall energy available from the SNe, which we term the feedback efficiency. Thornton et al. (1998) suggested that the maximal value () may be at least a factor of 5 too high once radiative losses are accounted for. As we shall see in Section 4, our model does not necessarily require a high value of to generate the required excess entropy; varying this parameter primarily alters the fraction of baryons in galaxies.
2.3.2 Feedback implementation
The thermal feedback model studied by K2002 is effective in reducing the masses/luminosities of galaxies but fails to reproduce the X-ray scaling relations of groups. In their model, each star particle distributes the energy available at each timestep (equation 1) over the surrounding gas. For equal mass particles, the maximum amount of energy a gas particle can receive from a single star particle is enough to heat it by keV (for ). In practice, gas particles escape before receiving this amount of energy and the result is an average heating temperature around an order of magnitude lower. Much of this gas then fails to escape from group and cluster-sized haloes with comparable or higher virial temperatures, and instead re-cools, boosting their X-ray luminosities (we will demonstrate this effect in Section 4).
We have devised an alternative method with the clear intention of heating the gas to a higher temperature without necessarily increasing the available energy. In the context of X-ray scaling relations, our new model is motivated by the presence of a “break” in the relation at keV; such a feature may be an imprint of a temperature scale introduced by the heating mechanism. We base the model on the physical assumption that as more and more supernovae go off, it is not the temperature of the gas that is progressively increased (as in the previous method), but the mass fraction of material converted from the cold phase to the hot phase. To implement such a model, we equate the available energy from a mass of newly formed stars, to the energy required to raise the temperature of a mass of cold gas, by a fixed amount,
| (2) |
where is given in equation 1 and we set g, the mean molecular weight of a gas with . In practice, is much greater than the temperature of the cold gas (K) so the heating introduces a temperature scale to the hot gas.
Assuming now that is the mass of a star particle, the fractional mass of a gas particle capable of being heated to is
| (3) |
using the fact that in our method and is the integral on the right hand side of equation 1. (For a typical timestep, yr, .) Note that in K2002’s model, and is calculated, the opposite of our model. For every star particle, we calculate the radius which encloses 32 gas particles, and (since generally 333Exceptions to this rule can occur if ; this is true for only one model considered in this paper, where & keV. As we shall see however, this particular model fails because is too low, not because less gas is reheated. ) apply equation 3 to the first gas particle within this radius with K. Since each gas particle represents only one phase in our simulations, we can only heat the whole particle to a temperature or not heat it at all. To mimic the effect of heating a fraction of the gas, we draw a random number for each particle, , and heat it to if .
For our fiducial model, for which we present results in the next section, we set & keV, twice the maximum available energy from standard supernovae calculations, but in reasonable agreement with that suggested in previous studies (e.g. Kravtsov & Yepes 2000; Wu, Fabian & Nulsen 2001; Bower et al. 2001; Borgani et al. 2002). As we will show, this model predicts X-ray properties of groups in good agreement with the data. We will demonstrate in Section 4 however, that a good match to the scaling relations is reasonably insensitive to this choice of , but does require the heating temperature to be sufficiently high in order for gas to escape from the gravitational potential of the halo. The fiducial temperature, which is significantly larger than typically found when using K2002’s model, also alleviates the need for preventing gas from cooling radiatively over a fixed period of time (as implemented by K2002), because cooling gas only starts to become thermally unstable at lower temperatures (keV for ).
3 X-ray properties of groups in the fiducial model
We begin by demonstrating that our fiducial feedback model provides an adequate match to current observational data at , given the level of uncertainty in these measurements.
Our group catalogues are constructed using the procedure outlined by Muanwong et al. (2002, hereafter M2002), where full details may be found. To summarize, spheres of baryon and dark matter particles are located with constant mean internal overdensity, , relative to the comoving critical density. For our chosen cosmology, is approximately the predicted value by the spherical top-hat collapse model for a virialized sphere (Eke, Navarro & Frenk 1998). Unless specified, we set for our main results but note that the X-ray properties are insensitive to using rather than . Only objects containing at least 500 baryon plus 500 dark matter particles are retained, setting a minimum halo mass of M⊙. At , our fiducial catalogue contains 172 objects.
Once the catalogues were generated, it was found that a small fraction ( per cent) of groups have X-ray temperatures very much in excess of the average for their mass (i.e. there are hot outliers on the temperature-mass relation). On inspection, these objects are infalling sub-clumps on the outskirts of larger groups, but have hot gas which has been shocked to the temperature of the more massive object. We choose to eliminate these objects by setting the requirement that each group in the catalogue has an X-ray temperature less than twice the mean value for its mass.
3.1 Entropy

The effect of the removal of hot gas from a halo on its X-ray properties can best be characterized by the change in entropy of the gas. As the hot gas is depleted, higher entropy material flows inwards and is adiabatically heated (i.e. it develops a hotter, less concentrated distribution) in order to maintain gravitational support. This leads to a rise in the X-ray temperature of the gas but a decrease in its X-ray luminosity (Knight & Ponman 1997; Pearce et al. 2000). Ponman et al. (1999) demonstrated that lower temperature objects have shallower surface brightness profiles and consequently larger excess entropies, relative to the expected self-similar relation for a model neglecting galaxy formation (we refer to this as a Non-radiative model).
Following Ponman et al., we measure the entropy of each object at 0.1 as a function of X-ray temperature. The latter is evaluated within a soft–band of energy range 0.3-1.5 keV
| (4) |
where the sum is performed over all hot gas particles (K) within the virial radius of the group, each with mass, , density, and temperature, . The soft-band cooling function, is calculated using the Raymond & Smith (1977) models. We then estimate the entropy of each group
| (5) |
where
| (6) |
is the electron density, averaged over all hot gas particles (of total mass, ) within a shell of width, , centered on . Only groups containing 10 or more particles within this region are plotted. We set the number of electrons per baryon, , appropriate for a primordial gas () although insensitive to the assumed range of .
Fig. 2 shows the simulated entropy–temperature relation (stars), as well as groups/clusters from the Radiative simulation studied by M2002 (diamonds). Our fiducial model agrees well with M2002’s result where the two samples overlap, as well as with the general trend observed by Ponman et al. (solid curve), clearly demonstrating an entropy in excess of the self-similar prediction (, dashed line). The increasing impact of the galaxies with decreasing halo mass leads to an increase in the excess entropy, consistent with the expectation of an entropy floor at keV cm2.
3.2 X-ray temperature

Increasing the entropy of the gas leads to a higher X-ray temperature at fixed mass, resulting in an increase in the normalisation of the temperature–mass relation (e.g. Muanwong et al. 2001; Thomas et al. 2002). We plot the fiducial temperature–mass relation in Fig. 3 (stars), with the solid line representing a least–squares fit to the data. The square points show the result of excluding emission from within the cooling radius444The cooling radius is defined as that which encloses hot gas with an average cooling time equal to 6 billion years of each object. This has the effect of slightly increasing the temperatures of some of the larger objects, without significantly affecting the slope or normalisation of the relation.
The result is in reasonable agreement with the Radiative model studied by M2002 (diamonds), but predicts a flatter relation ( as opposed to ). Lower-mass groups have X-ray temperatures in excess of their virial temperatures (, dotted line), as expected from the increase in entropy of these systems. In the highest mass group, the presence of cooler reheated gas within the virial radius biases its X-ray temperature lower than the virial temperature. It is possible that a good fit to higher-mass systems will require an even higher heating temperature than employed here.
The dashed and dot–dashed lines in Fig. 3 represent power-law fits to the observed temperature–mass relation for clusters, compiled by Xu, Jin & Wu (2001), using NFW and model surface brightness profiles respectively. Both fits are offset from the simulated relation by up to 40 per cent. A likely reason for this offset is that the masses are underestimated when extrapolating X-ray surface brightness profiles to the virial radius. M2002 demonstrated that by estimating cluster masses this way (assuming a relation between the observable extent of an object and its true size) the resulting temperature–mass relation was in much closer agreement with the observations. This conclusion was strengthened when the same dataset was shown to be in good agreement with the temperature–mass relation for a sample of high-resolution clusters observed with the Chandra satellite (Allen et al. 2001), for masses measured within a density contrast of 2500 (Thomas et al. 2002).
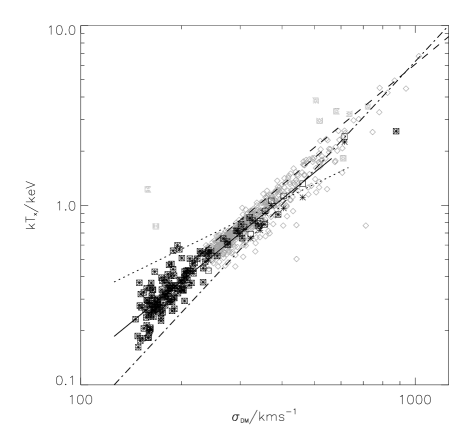
For groups, the problem of estimating masses from the X-ray data is exacerbated by their lower surface brightness, and so galaxy velocity dispersion is commonly used as an independent measure of the dynamical size of the halo from its temperature. We plot the relation between X-ray temperature and dark matter velocity dispersion, , for our fiducial model in Fig. 4. (Numerical resolution limits the number of galaxies per halo to a few in most cases, preventing us from reliably estimating the galaxy velocity dispersion. Previous simulations have shown that the galaxies trace the potential reasonably well, see e.g. Springel et al. 2001; Davé et al. 2002.)

The dot-dashed line shows the expected relation if the gas contained the same specific energy as the dark matter, i.e. . Again, the larger X-ray temperatures of the smaller groups flattens this relation, resulting in (solid line). To quantify this effect, we plot the ratio of specific energies between the hot gas and the dark matter
| (7) |
in Fig. 5. The smaller objects contain, on average, X-ray luminous gas that is nearly twice as hot as the dark matter. For the higher-mass objects (keV) however, the two components are approximately at the same temperature.
Also plotted in Fig 4 are the best-fits to the group data presented in Helsdon & Ponman (2000; dotted line), and the group and cluster data compiled by Xue & Wu (2000; dashed lines). The Helsdon & Ponman relation is much flatter than the Xue & Wu line, due to their sample containing several low–temperature groups with low velocity dispersions. Removing these outliers from the sample would result in closer agreement with Xue & Wu’s relation. Our simulated relation reproduces Xue & Wu’s observational determination, , reasonably well.
3.3 X-ray luminosity
The increase in entropy decreases the X-ray luminosity of groups. Since this has a bigger effect on less massive objects, it leads to a steepening of the and relations, which we will quantify here.
As in M2002 we estimate bolometric X-ray luminosity by applying a correction to the soft–band emissivity
| (8) |
where is calculated using equation 4, is the bolometric cooling function used in the simulations (see Section 2).
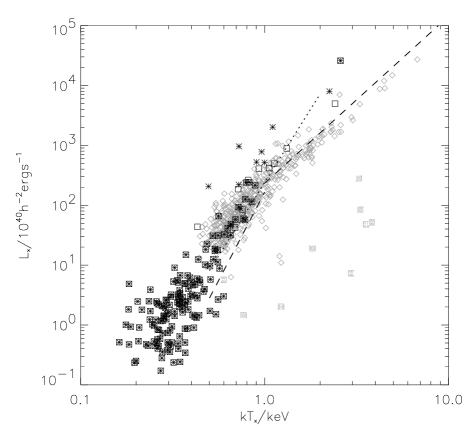
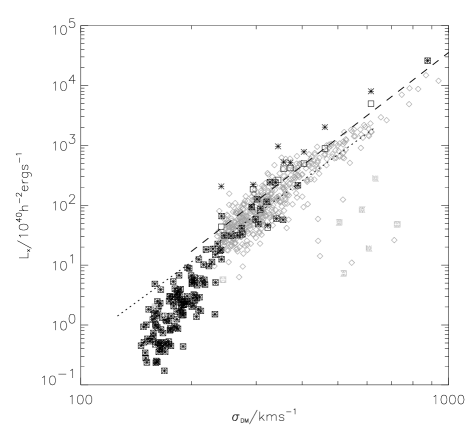
Figs. 6 & 7 illustrate the and relations respectively, for the fiducial simulation. Again, the model agrees reasonably well with both M2002’s result and the observed relations, given the uncertainty in the latter. Furthermore, increasing the resolution of the smaller objects (which are less well-resolved than the larger groups) increases their temperature, which will bring the relation into better agreement with the observed relation (see Section 5). Note that the “break” in the relation at around 1 keV is more prominent in the relation than in the relation, due to the additional effect of entropy increase on temperature, causing the relation to steepen further.
3.4 Baryon fractions

Although cooling and heating (feedback) are both mechanisms for increasing the core entropy of groups, they have opposing effects on the stellar baryon fraction. Cooling acts to increase and feedback decrease galaxy masses, hence matching the observed value requires a balance between the two processes. Cooling and feedback can also have different effects on the hot gas fractions. Although cooling reduces the hot gas content, feedback can cause an increase (reheated gas that has not moved beyond the virial radius) or a decrease (transfer of energy between outflows and hot halo gas increases the fraction expelled from the halo).
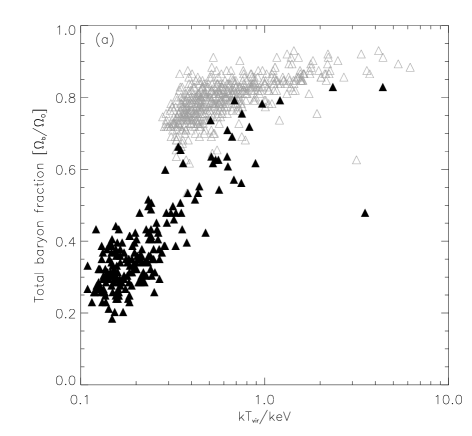
In Fig. 8 we plot mass fractions of baryons, in units of the global value (), against the virial temperature of each halo for the fiducial model (filled symbols) and M2002’s Radiative simulation (open symbols). The total baryon fractions are plotted in panel (a). Both models appear to be converging towards a value close to unity at high virial temperatures, but the baryon fractions decrease much more rapidly at lower temperatures when feedback is included. The difference between baryon fractions reflects the total amount of gas expelled from the halo by feedback.
The baryon fractions are split into hot gas (K, diamonds) and cold gas + star (triangles) fractions in panel (b). The same trend is present between the two models for the cooled baryon fractions (since galaxy formation efficiency is higher in smaller objects, where average cooling times are shorter), but the values at a given temperature are different. The cooled fraction is twice as high in the M2002 objects, and could be higher: the absence of feedback in this simulation means that only numerical resolution limited these values. Feedback also steepens the relation between the hot gas fraction and virial temperature. As we discuss in Section 4, objects with virial temperatures above the feedback temperature, , retain a fraction of reheated gas which slightly increases their hot gas fraction. In smaller systems however, feedback has a larger impact on the hot gas, expelling a significant fraction from the halo.
The shaded region in Fig. 8 represents measured global cooled gas fractions (the global value is the asymptotic limit for large halo mass), combining the stellar fractions measured by Cole et al. using data from the 2MASS and 2dF galaxy surveys, with a further 10 per cent of the mass in cold gas (Balogh et al. 2001). The upper horizontal line represents the value determined when using the Salpeter IMF (as used in our feedback model) and the lower for the Kennicutt IMF. Globally, only just over 3 per cent of the gas forms stars in the fiducial model by , lower than the observed value by a factor of . Increasing the resolution does not significantly increase the cooled fraction (Section 5) because feedback acts to stabilize this quantity and our simulation has already resolved the majority of the galaxy mass density. As we discuss in the next section however, a higher cooled fraction can be achieved by choosing a lower which does not significantly affect the scaling relations. Additionally, increasing the metallicity of cooling gas will increase the fraction of baryons in stars. The metallicity of high-density regions has been underestimated in our simulation since stars in galaxies at the present day have been enriched to solar abundance (Edmunds & Phillips 1997), whereas ours have . A higher metallicity will increase the fraction of stars in a given galaxy.
Measuring cooled fractions in groups and clusters is difficult, mainly due to the lack of sensitivity in the X-ray instruments to measure hot gas masses out to the virial radius. Current attempts, however (see for example the compilation of data by Balogh et al.), measure values between 10-20 per cent at 1 keV. These values are marginally consistent with our fiducial result but again, a lower and/or higher metallicity would improve the match.
4 A closer look at the model
| Model | /keV | ? | ||
|---|---|---|---|---|
| Radiative | N/A | N/A | 0.15 | YES |
| Feedback | 1 | 0.1 | 0.10 | NO |
| Feedback | 0.1 | 2 | 0.12 | YES |
| Feedback | 1 | 2 | 0.05 | YES |
| Feedback | 2 | 2 | 0.03 | YES |
Given the ability of our fiducial model to adequately reproduce many of the key X-ray observations of groups, we now investigate how these results depend on the strength of the feedback. To facilitate this task we have run a set of smaller simulations (Table 1) with particles within a comoving box of length , thus keeping the resolution constant.
After generating group catalogues for each simulation, we also compare the properties of the haloes in two models on an object-by-object basis. To do this we first found the closest pair, then rejected those which had masses differing by more than 15 per cent or separations greater than 20 per cent of the average virial radius. These criteria find a good match for the majority of the haloes in the two catalogues.
4.1 Cooling versus heating
The first comparison we make is between the fiducial model (which has strong feedback) and a run with no feedback at all (radiative model). This allows us to quantify the relative effects of heating and cooling on the X-ray properties of the groups. In particular, we are interested in knowing if the model behaves like that proposed by Voit & Bryan (2001), i.e. cooling generates the entropy excess by removing hot gas, which then either forms stars or is reheated and transported to larger radii. If the fiducial model does behave in this way, we expect the feedback only to reduce the fraction of galactic material, leaving the hot gas fraction (and hence X-ray properties) intact.

Indeed, the relation for the radiative simulation is similar to the fiducial feedback relation, but the former is flatter. This effect is quantified in Fig. 9, where we plot the fractional difference in X-ray temperature (stars) and luminosity (squares) between matched haloes in the two runs against their average virial temperature. These differences are defined as
| (9) |
and
| (10) |
There is no strong variation in the difference between X-ray temperatures with system size, although there is a correlation in the X-ray luminosity difference. For keV the objects in the radiative simulation are nearly twice as luminous as those in the feedback run, but the opposite is the case for systems which are a factor of 10 hotter. (Note that because of the small size of the simulations, there is only one halo with keV.)
On closer inspection, the trend in luminosity difference is down to two effects caused by feedback. The first, which particularly affects low-mass systems, is a reduction in the mass of hot gas in groups in the feedback simulation which was inside the virial radius in the radiative simulation. This can be attributed to the increase in pressure from the outflowing reheated material. Secondly, part of the reheated gas, which formed stars in the radiative simulation, is still within the virial radius in the feedback simulation. As the gravitational energy of the halo becomes comparable to that given to reheated gas (i.e. ), the second effect dominates over the first, eventually causing the feedback to increase the X-ray luminosity of a group.
To summarize, we find that our model does behave like that proposed by Voit & Bryan (2001) if . If then feedback also removes hot halo gas (in addition to expelling reheated material) and so reduces the group’s X-ray luminosity further. Conversely, if , some reheated gas does not gain enough entropy to escape and so boosts the group’s X-ray luminosity.
4.2 Varying the model parameters
We now investigate the effects of varying the feedback model parameters, and on the X-ray properties of groups. Given the simplicity of the model, and the results from the previous comparison with a radiative simulation, we should be able to predict how varying the parameters affect the results.


First of all, we consider the effect of varying the feedback parameters on star formation efficiency. The star formation rate, which determines the amount of energy and metals supplied to the interstellar medium, varies inversely with (equation 3), since more reheated cold gas leaves less material available to form stars. Note , so we would expect a smaller energy budget and/or a higher heating temperature to increase the star formation rate.
Panel (a) of Fig. 10 illustrates star fractions against virial temperature for groups in the radiative model plus feedback models with varying parameter values (given in the legend). As expected, the star fraction increases when decreasing for fixed , and the model with contains approximately the correct amount of cooled material ( 10 per cent, c.f. Fig. 8). The impact of varying on the total baryon fraction is shown in panel (b). As is increased, more gas is reheated (at the expense of forming stars) and expelled from each halo, decreasing its baryon fraction.
Contrary to expectations however, the star fraction increases when is decreased from 2 to 0.1 keV, with the total baryon fraction of the low temperature case being similar, on average, to the radiative model. As was found for K2002’s thermal feedback model, if for the haloes being studied (as is the case for the keV model), a substantial fraction of reheated gas is not hot enough 555Note however that some gas will have been hot enough to escape from progenitor haloes at earlier times to escape from the gravitational potential, and will instead re-cool and boost the star formation rate.

The effect of feedback in the fiducial model was to slightly steepen the relation that was produced by radiative cooling alone. Fig. 11 illustrates the effect of varying the parameters on the relation. Although the simulations do not contain enough objects to perform a detailed study of the shape of the relation, we see from our present results that the overall normalization of the relation is fairly insensitive to when , except that the relation becomes slightly steeper as is increased from 0 (radiative) to 2. Although the heating temperature is the same in these runs, increasing increases the amount of outflowing material, thus having a larger impact on the hot gas (as discussed in the previous section). When however (as is the case with keV) the luminosities are boosted and temperatures decreased considerably. As was observed from the previous figure, reheated material in the latter run is too cold to completely escape from a group-sized halo: the lack of buoyancy causes this gas to boost the central density, hence boosting its X-ray luminosity and lowering its X-ray temperature.
Although the fiducial run provides the best fit to the observations (at least for low-mass groups), we will show in the next section that the lack of numerical resolution in the smaller objects artificially flattens the relation.
5 Resolution effects
| Model | ||||
|---|---|---|---|---|
| LR | ||||
| HR |
The results presented in this paper have all been for fixed resolution. In this section, we present results from a limited study of how varying the resolution affects the X-ray properties of the groups. Table 2 lists properties of the two simulations studied here, a low-resolution simulation (labelled LR) with the same resolution used for the runs studied previously, and a high-resolution simulation (HR) with 8 times as many particles. Both runs were performed for a comoving box-size of and contain the same large-scale power. Although such a box is too small for quantitative predictions, it allows us to compare a small sample of the same objects at different resolution, without requiring a large investment in CPU time. The fiducial feedback parameters were adopted, namely and keV.
The final column in Table 2 lists the cooled baryon fraction for the 2 runs; a factor of 8 increase in resolution only increases this fraction by per cent. This is because the majority of the mass in galaxies is already resolved at the lowest resolution (i.e. 32 or more particles, the lowest number than can cool efficiently.). Furthermore, the feedback acts to stabilize gas cooling since the heating rate is directly proportional to the cooling (star formation) rate. As was stated previously, an overall increase in the cooled fraction must therefore come from choosing a lower value of and/or higher metallicity of cooling gas.
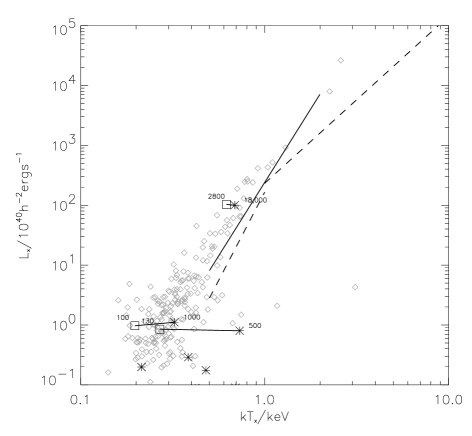
All runs resolve 3 common objects; the corresponding “relation” for each simulation is plotted in Fig. 12. Particles from within the cooling radius of each object are excluded from the calculation (which affects only the luminosity of the largest object). Note that the luminosities are more or less unchanged for all 3 objects when the resolution is varied, due to the stabilizing effect of feedback. For the largest object, which contains between 2800 (LR) and 18,000 (HR) hot gas particles, its X-ray temperature increases only a little, unlike the smaller 2 objects (between 100 and 1000 particles), where it increases significantly. We therefore expect the slope of the relation to steepen when the emission-weighted temperatures for all objects have converged.
6 Summary and conclusions
In this paper, we examined the influence of the galaxy population on the X-ray properties of groups at that form in a cosmological simulation. In particular, we were interested in determining how including feedback of energy from supernovae in the simulations (which decreases the star formation rate) affects the X-ray properties of the groups. Motivated by the “break” in the X-ray luminosity-temperature relation at the interface between group and cluster scales (keV), we devised a feedback model based on heating the gas to a fixed temperature, independent of the available energy budget. A given heating temperature, , and energy budget, , then determines the star formation rate and the corresponding mass of reheated gas.
For our main results, we studied a model with strong feedback (, twice the available energy from supernovae) and a heating temperature, keV, comparable to the break. This model generated the required excess entropy in the cores of the groups and so was able to adequately reproduce the X-ray scaling relations over the range of temperatures appropriate to groups (keV). However, the fraction of baryons in galaxies was around a factor of 3 lower than observed (assuming a Salpeter IMF).
We then compared our fiducial feedback model to a model with no feedback, and found that the relations were similar in normalization, but the feedback relation was slightly steeper. Radiative cooling acts to reduce the hot gas fraction (and hence X-ray luminosity) in groups, removing low-entropy material (which forms stars) and causing higher-entropy gas to flow in to replace it. In low-mass groups (where ), feedback reduces the luminosity further because the outflowing reheated material increases the pressure of the hot gas. However, as , the effect of feedback on the hot gas diminishes due to the group’s increasing ability to retain a larger fraction of material. As a result, some of the gas that was turned into stars in the radiative run is still within the virial radius in the feedback run, leading to an increase in the luminosities of high-mass groups.
The fraction of reheated material per mass of stars scales as , and so the star formation rate ought to vary inversely with this parameter combination, since more reheated gas leaves less material available to form stars. This is only true if the heating temperature is comparable to or larger than the virial temperature of the systems being studied. For such a case, decreasing allows a reasonable match to both the global fraction of baryons in stars and the X-ray properties of the groups. However, when the heating temperature is low compared to the virial temperature of groups (we studied the case when keV), reheated gas cannot escape from the gravitational potential and instead re-cools and forms more stars. As a result, this excess of cooling gas decreases the core entropy of the groups and consequently boosts their luminosity.
Finally, increasing the resolution of our simulations appears to have little effect on the X-ray luminosities of groups but the temperatures of the smaller, poorly-resolved objects increased. Based on these results, numerical convergence for the range of group masses will act to steepen the relation.
Acknowledgments
The work presented in this paper was carried out as part of the programme of the Virgo Supercomputing Consortium (http://virgo.sussex.ac.uk). The majority of data were generated using COSMOS, the UK Computational Cosmology Consortium supercomputer, an SGI Origin 3800 at the Department of Applied Mathematics and Theoretical Physics, Cambridge. STK is supported by PPARC; PAT and TT thank PPARC for a Lecturer Fellowship and Advanced Fellowship respectively.
References
- [1] Allen S. W., Schmidt R. W., Fabian A. C., 2002, MNRAS, 328, L37
- [2] Balogh M. L., Pearce F. R., Bower R. G., Kay S. T., 2001, MNRAS, 326, 1228
- [3] Borgani S., Governato F., Wadsley J., Menci N., Tozzi P., Quinn T., Stadel J., Lake G., 2002, MNRAS, 336, 409
- [4] Bower R. G., 1997, MNRAS, 288, 355
- [5] Bower R. G., Benson A. J., Lacey C. G., Baugh C. M., Cole S., Frenk C. S., 2001, MNRAS, 325, 497
- [6] Bryan G. L., 2000, ApJ, 544, L1
- [7] Bryan G. L., Voit G. M., 2001, ApJ, 556, 590
- [8] Cole, S., et al., 2001, MNRAS, 326, 255
- [9] Couchman H.M.P., 1991, ApJ, 368, L23
- [10] Couchman H.M.P., Thomas P.A., Pearce F.R., 1995, ApJ, 452, 797
- [11] Davé R., Katz N., Weinberg D. H., 2002, ApJ, 579, 23
- [12] Edmunds M. G., Phillips S., 1997, MNRAS, 292, 733
- [13] Eke V. R., Navarro J. F., Frenk C. S., 1998, ApJ, 503, 569
- [14] Evrard A. E., Henry J. P., 1991, ApJ, 383, 95
- [15] Fukugita M., Hogan C. J., Peebles P. J. E., 1998, ApJ, 503, 518
- [16] Heckman T., 2000, Gas and Galaxy Evolution, ASP Conference series, edts. J.E. Hibbard, M.P. Rupen and J.H. van Gorkom
- [17] Helsdon S. F., Ponman T. J., 2000, MNRAS, 315, 356
- [18] Hultman J., Pharasyn A., 1999, A&A, 347, 769
- [19] Kaiser N., 1986, MNRAS, 222, 323
- [20] Kaiser N., 1991, ApJ, 383, 104
- [21] Kay S.T., Pearce F.R., Frenk C.S., Jenkins A., 2002, MNRAS, 330, 113 (K2002)
- [22] Kennicutt R. C., 1998, ApJ, 498, 541
- [23] Knight, P. A., Ponman T. J., 1997, MNRAS, 289, 955
- [24] Kravtsov A. V., Yepes G., 2000, MNRAS, 318, 227
- [25] Lahav O., et al., 2002, MNRAS, 333, 961
- [26] Lia C., Portinari L., Carraro G., 2002, MNRAS, 330, 821
- [27] Lloyd–Davies E. J., Ponman T. J., Cannon D. B., 2000, MNRAS, 315, 689
- [28] McKee C. F., Ostriker J. P., 1977, ApJ, 218, 148
- [29] Monaghan J.J., 1992, ARA&A, 30, 543
- [30] Muanwong O., Thomas P. A., Kay S. T., Pearce F. R., Couchman H. M. P., 2001, ApJ, 552, L27
- [31] Muanwong O., Thomas P. A., Kay S. T., Pearce F. R., 2002, MNRAS, 336, 527 (M2002)
- [32] Pearce F. R., Thomas P. A., Couchman H. M. P., Edge A. C., 2000, MNRAS, 317, 1029
- [33] Pen U.-L., 1999, ApJ, 510, L1
- [34] Pettini M., Shapley A. E., Steidel C. C., Cuby J., Dickinson M., Moorwood A. F. M., Adelberger K. L., Giavalisco M., 2001, ApJ, 554, 981
- [35] Ponman T. J., Cannon D. B., Navarro J. F., 1999, Nature, 397, 135
- [36] Portinari L., Chiosi C., Bressan A., 1998, A&A, 334, 505
- [37] Raymond J. C., Smith B. W., 1977, ApJS, 35, 419
- [38] Refregier A., Rhodes J., Groth E. J., 2002, ApJ, 572, L131
- [39] Schaye J., Rauch M., Sargent W. L. W., Kim T.-S., 2000, ApJ, 541, L1
- [40] Seljak U., 2002, MNRAS, 337, 769
- [41] Springel V., White S. D. M., Tormen G., Kauffmann G., 2001, MNRAS, 328, 726
- [42] Springel V., Hernquist L., 2002a, MNRAS, 333, 649
- [43] Springel V., Hernquist L., 2003, MNRAS, 339, 289
- [44] Steinmetz M., White S. D. M., 1997, MNRAS, 288, 545
- [45] Sutherland R. S., Dopita M. A., 1993, ApJS, 88, 253
- [46] Thornton K., Gaudlitz M., Janka H.-Th., Steinmetz M., 1998, ApJ, 500, 95
- [47] Thomas P. A., Couchman H. M. P., 1992, MNRAS, 257, 11
- [48] Thomas P. A., Muanwong O., Kay S. T., Liddle A. R., 2002, MNRAS, 330, L48
- [49] Theuns T., Leonard A., Efstathiou G., Pearce F. R., Thomas P. A., 1998, MNRAS, 301, 478
- [50] Theuns T., Viel M., Kay S., Schaye J., Carswell R. F., Tzanavaris P., 2002, ApJ, 578, L5
- [51] Voit G. M., Bryan G. L., 2001, Nature, 414, 425
- [52] Voit G. M., Bryan G. L., Balogh M. L., Bower R. G., 2002, ApJ, 576, 601
- [53] White S. D. M., Rees M. J., 1978, MNRAS, 183, 341
- [54] Wu K. K. S., Fabian A. C., Nulsen P. E. J., 2000, MNRAS, 318, 889
- [55] Wu K. K. S., Fabian A. C., Nulsen P. E. J., 2001, MNRAS, 324, 95
- [56] Wu X.-P., Xue Y.-J., 2002a, ApJ, 569, 112
- [57] Wu X.-P., Xue Y.-J., 2002b, ApJ, 572, L19
- [58] Xu H., Jin G., Wu X.-P., 2001, ApJ, 553, 78
- [59] Xue Y.-J., Wu X.-P., 2000, ApJ, 538, 65
- [60] Yepes G., Kates R., Khokhlov A., Klypin A., 1997, MNRAS, 284, 235