Comparative Absorption and Emission Abundance Analyses of Nebulae: Ion Emission Densities for IC 418 111Based on observations made with the NASA/ESA Hubble Space Telescope, obtained from the STScI, which is operated by AURA, Inc. under NASA contract NAS 5-26555, and on observations made at CTIO/NOAO, which is operated by AURA, Inc. under cooperative agreement with the NSF.
Abstract
Recent analyses of nebular spectra have resulted in discrepant abundances from CNO forbidden and recombination lines. We consider independent methods of determining ion abundances for emission nebulae, comparing ion emission measures with column densities derived from resonance absorption lines viewed against the central star continuum. Separate analyses of the nebular emission lines and the stellar UV absorption lines yield independent abundances for ions, and their ratio can be expressed in terms of a parameter , the “emission density” for each ion. Adequate data for this technique are still scarce, but separate analyses of spectra of the planetary nebula and central star of IC 418 do show discrepant abundances for several ions, especially Fe II. The discrepancies are probably due to the presence of absorbing gas which does not emit and/or to uncertain atomic data and excitation processes, and they demonstrate the importance of applying the technique of combining emission- and absorption-line data in deriving abundances for nebulae.
1 Introduction
Much of our knowledge of physical conditions and abundances in diffuse emission regions such as H II regions, planetary nebulae (PNe), and supernova remnants derives from an analysis of the emission-line spectra. The results from studying these objects, particularly H II regions, are then key ingredients in the study of abundance gradients on galactic scales and as a function of lookback time. The methods of analysis have been well developed over the past half century, and have been applied to virtually every type of emission-line object (Osterbrock, 1989; Dopita & Sutherland, 2002). The strongest lines of H and He are due to electron recapture to higher levels whereas collisionally excited forbidden lines from lower levels tend to dominate the heavy element spectrum, and these lines form the cornerstone of most spectral analyses of nebulae.
It became evident from some of the early IUE UV spectra of PNe that the relative intensities of the stronger recombination and collsionally excited lines originating from the same ion were in disagreement with theory and that some additional process might be the cause (Harrington, Lutz, & Seaton, 1981). Similar types of discrepancies have arisen in the past and various processes have been invoked to explain them, e.g., fluctuations in electron temperature (Peimbert, 1967) and density (Viegas & Clegg, 1994), fluorescence scattering of continuum radiation (Seaton, 1968), and selective excitation mechanisms involving charge transfer (Williams, 1973) and dielectronic recombination (Storey, 1981), with some success achieved for selected lines.
Recently, however, relative intensities of a large sample of CNO forbidden and recombination lines have been determined from high signal-to-noise spectroscopy of PNe, and the problem of discrepant forbidden and recombination line intensities within the same ion has persisted (Liu et al. 1995, 2000; Garnett & Dinerstein 2001a) . Some objects exhibit the problem, while others do not, and its manifestation is the variation in the intensities of an ion’s recombination lines as a whole relative to the forbidden lines of that ion among different objects. No convincing explanation has emerged that accounts for this phenomenon (Garnett & Dinerstein 2001b; Liu 2002a, 2002b). Analyses of optical and IR spectra of various PNe have now extended the problem generally to CNO ions and to H II regions (Peimbert, Storey, & Torres-Peimbert, 1993; Esteban et al., 1999; Tsamis et al., 2002), and the discrepancies between the predicted and observed intensities of forbidden lines relative to the recombination lines from the same ion in selected nebulae can exceed an order of magnitude. The consequence of this situation is that abundances derived from the emission lines may be incorrect, and it is not clear which lines produce reliable results.
There have been additional signs of problems related to the excitation of forbidden lines in elements heavier than CNONe. It was already established some years ago that the observed fluxes of [Fe II] and [Ca II] emission in nebulae are frequently orders of magnitude weaker than predicted from model calculations (Shields, 1978; Kingdon, Ferland, & Feibelman, 1995), and this has been attributed to selective gas depletion of these elements by condensation into dust grains. In the other direction, strengths of certain lines observed in emission objects, such as [Fe X] 6375 and [Ni II] 7378, often greatly exceed their expected, calculated intensity relative to other ions (Filippenko & Halpern, 1984; Henry & Fesen, 1988). This phenomenon has been attributed to the selective excitation of the lines from scattering of stellar continuum radiation by a strong resonance transition that populates the upper level of the forbidden line (Korista & Ferland, 1989; Lucy, 1995).
The discrepancies that persist between predicted and observed line strengths demonstrates that assumed excitation processes may be incorrect and, in turn, some abundances derived from emission-line analyses may not be valid. Element abundances and physical conditions that are derived from emission lines are fundamental to our understanding of diffuse gas, and an independent method of determining abundances is essential to elucidate the present situation. An alternative method of deriving ion abundances does exist and is frequently applied to non-emitting regions of the ISM and IGM: analysis of the absorption lines produced by the gas against a more distant continuum source. For ions whose absorption lines are not strongly saturated column densities can be determined relatively free of uncertain parameters, and this technique can provide an independent check of emission line results.
Absorption analyses of emission nebulae have been performed for a relatively small number of objects, and studies for which the results have been compared with an emission analysis of the same ions in the same object are virtually non-existent. Jenkins, Silk, & Wallerstein (1976) and Schweizer & Middleditch (1980) recognized that the Vela and SN 1006 supernovae remnants are seen against a background of more distant stars and they obtained high resolution spectra of some of the stars in the UV and optical, identifying various ion species produced by the gas of the SNR’s. The first abundance determinations of nebular gas in PNe from absorption lines were attempted by Pwa, Mo, & Pottasch (1984) and Pwa, Pottasch, & Mo (1986) from high resolution UV specta of the central stars of NGC 6543 and BD+30o3639 obtained with IUE. They derived column densities for certain ions and compared them to those inferred from relative emission line intensities, finding general agreement between the emission and absorption strengths. Dinerstein, Sneden, & Uglum (1995) independently surveyed neutral gas outside the H+ zone in PNe shells by observing the Na I D absorption lines in the continua of their central stars, and made positive detections in more than 30% of their sample from which they deduced column densities. Walborn et al. (2002) determined column densities for the eta Carinae nebulosity by observing the UV absorption lines produced by the ejecta in the spectra of more distant hot stars lying behind it in the galactic plane. In none of the above studies were absolute emission intensities of the nebular lines used to determine emission measures for the same ions as those for which column densities had been determined from the absorption lines.
We present here a technique that can be used to determine ion abundances in nebulae, and which makes independent use of both (a) the resonance absorption lines produced in the central star continuum by the shell of the nebula, and (b) the emission lines from the nebula along an adjacent line of sight. Unfortunately, good signal/noise data for emission and absorption lines from the same ion in the same object currently exist for only one nebula: the PN IC 418. We determine comparative abundance ratios using the two methods of analysis for several ions in this nebula which demonstrate the value of combining the two methods. The results reveal inconsistencies between the two methods that cast some doubt on the usual assumptions governing the excitation of certain forbidden lines.
2 The Emission Density
The observed extinction-corrected flux of an optically thin forbidden line can be written
| (1) |
where is the angular area of the gas being observed, is the line excitation coefficient appropriate for the transition, is the nebula radius, and and are the electron and ion densities. The first integral in equation 1 is taken over the entire emission line of sight through the nebula and is the emission measure, , of the ion times the coefficient . The parameter is a geometrical factor that converts the line integral through half the nebula to the star to the appropriate integral for the observations, which sample a longer path through the entire nebula offset from the central star. The factor thus normalizes the emission and absorption line strengths to the same path length for comparison purposes, and its value, normally of order unity, depends on the geometry of the nebula and the placement of the spectrograph slit, as will be discussed further in § 3.2.
For most forbidden lines is the collisional excitation coefficient corrected for any collisional de-excitation, which consists of contributions from multiple levels but is almost always dominated by direct impact excitation of the upper level of the line from the ground state. Under some circumstances consists of additional terms when other processes such as dielectronic recombination or resonance fluorescence of stellar continuum radiation contribute to the line excitation, and in this case the additional terms can cause to have a density dependence.
The column density of an ion, , and the intensities of its emission lines differ in their dependence upon gas density and temperature. It is straightforward to determine both the column density and the emission measure of an ion from observations of the absorption line equivalent widths and the absolute fluxes of the emission lines. A useful way to relate the absorption and emission line strengths from an ion is to take the ratio of the ion’s emission measure to its column density. This ratio defines a density-weighted mean electron density for that ion, , which we designate as the emission density of the ion,
| (2) |
and where we have removed the emission coefficient from the integral by having the line emission from individual ions be represented by single electron temperatures.
The physical interpretation of the emission density is that it is the mean electron density required to produce the observed emission line fluxes of an ion given the column density of that ion as determined from its absorption lines. Its value can be determined for an ion from the emission and absorption lines, for an assumed electron temperature, although inhomogeneities in the gas can produce departures of the emission density from the electron density if the absorption and emission lines of sight are dissimilar. Generally, however, the derived from the emission and absorption lines should take on values close to that of the local electron density of the emitting gas.
In making observations of absorption features against the continuum of the ionizing star, one samples a column of gas having a cross section equal to that of the star, normally cm across and frequently orders of magnitude smaller. However, to obtain good quality spectra of diffuse emission regions usually requires observations which sample more than 1″ along the slit, which for an object at 1 kpc distance corresponds to a size cm. Thus, emission lines of sight sample much larger cross sections than absorption observations. An asymmetrical distribution of gas, such as jets or unusual clouds that intersect one of the emission or absorption lines of sight but not the other, can clearly lead to values of the emission density for an ion that differs from the electron density because the emission and absorption sample gas having different characteristics. However, the values of for two ions whose elements have very similar ionization potentials should be the same, irrespective of inhomogeneities or the geometry of the object, because such ions should be co-spatial and share the same physical conditions. A comparison of the emission densities for two similar ions is a valuable check on the assumed excitation processes for their emission lines.
3 Observations of the Planetary Nebula IC 418
Data that would allow abundance determinations from both absorption and emission lines exist for very few objects. With the exception of Ca II, which has forbidden and resonance lines in the visible, no other abundant ion has both resonance lines and observable emission lines in the visible spectral region. Most absorption lines produced by diffuse gas originate from the ground state and occur in the UV, so space observations are necessary unless the object has large redshift. The local ISM produces strong absorption troughs from many of the same transitions that are formed in Galactic emission regions, hence the detection of discrete absorption components from any object requires that it have a different radial velocity than that of the ISM along the line of sight. The best candidate objects to observe are PNe because many of them have relatively bright central stars in the UV, relatively high surface brightness emission shells, and radial velocities that differ from that of the intervening disk ISM. The compact PN IC 418 satisfies all these criteria and its central star has already been observed at high spectral resolution with HST/STIS, with the data publicly available from the HST archive222The data are available via http://archive.stsci.edu/cgi-bin/nph-hst as Datasets 052902010, -030, and -040 (PI: H. Dinerstein).. We had recently embarked upon a program to obtain high signal/noise optical spectra of selected PNe which included IC 418, thus relevant data to determine ion abundances separately from emission and absorption already exist for this one object.
3.1 Ultraviolet Absorption Features
The central star of IC 418 was observed in the UV in 1999 March with HST/STIS over the wavelength region 1150-1687Å at a resolution of 8 km s-1. We obtained the on-the-fly calibrated data on 2002 January 4 from the HST archive running CALSTIS version 2.12a, which includes a two-dimensional correction for scattered light (Lindler, 1998). The spectrum consists of a stellar continuum interspersed with discrete absorption features, the great majority of which are produced by gas in the intervening ISM. At a distance of roughly 1 kpc IC 418 has galactic coordinates of (215, -24) deg and a heliocentric radial velocity of +60 km s-1, so absorption produced by the nebular shell is adequately velocity-shifted away from all but the strongest and broadest of the corresponding ISM absorption features.
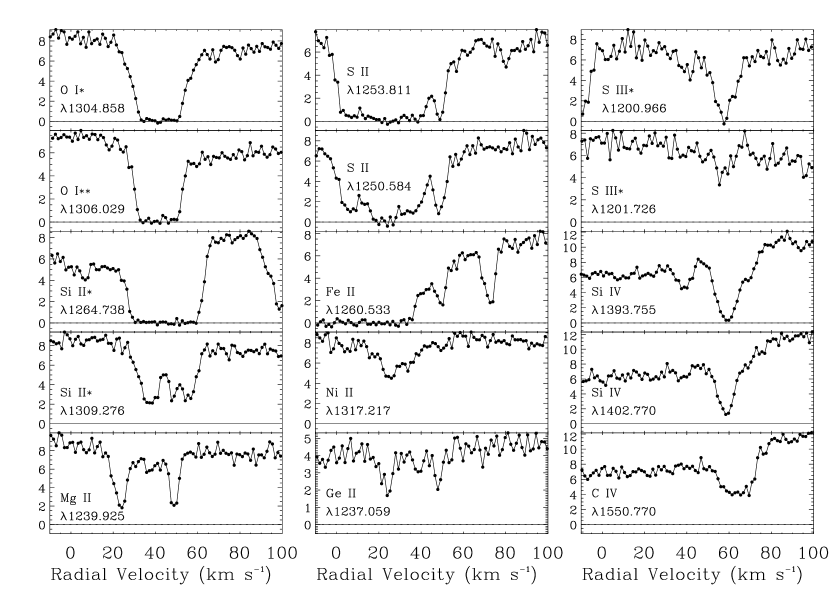
We have identified the nebular absorption lines that appear in the spectrum, specifically noting unblended lines at the PN shell velocity that belong to ions which also have emission lines observed in the visible. A number of relevant absorption features are either badly saturated or blended with stronger ISM components and cannot provide column densities. For this reason the sample of ions for our combined analysis is limited to just the five species O I, S II, S III, Fe II, and Ni II, although nebular absorption from other ions is present. Moreover, there are several velocity components near the velocity of the shell, as best shown by the profile of Si II* 1309.276Å (cf. Fig. 1). Note that a line denoted by one or two asterisks refers to a transition originating from the first or second excited fine-structure level, respectively, within the ground state.
Absorption features whose velocities are in the vicinity of v=+45 km s-1 are assumed to be associated with the foreground part of the expanding (at km s-1) shell of IC 418. The list of detected absorption lines having a nebular origin is given in Table 1 together with our measurements of the equivalent widths of these lines, the relevant atomic parameters of the transitions, and the resultant column densities when determinable. Plots of most of the absorption features are shown in Fig. 1. The entries for the elements in the table are ordered by their rank in the periodic table and according to line strength (strongest line first), while the panels in the Figure are segregated by ionization. In the Figure, there is a clear progression toward somewhat higher velocities for the more highly ionized species, with C IV reaching a velocity of about v +60 km s-1. This is expected in a differentially expanding shell in which the lower ionization gas has the larger expansion velocity, and our emission line data are entirely consistent with this. They were taken with a slit set off-center on the nebula, and inspection of the two-dimensional long-slit spectra clearly shows that the low ionization lines come from the outer regions with larger expansion velocity, while the higher ionization lines originate closer to the ionizing star and have a lower expansion velocity relative to the star.
To measure equivalent widths we used continuum levels defined by least squares fits of Legendre polynomials to intensities on either side of each line, following the methods described by Sembach & Savage (1992). The principal foreground interstellar absorption features are found at v=+25 km s-1, and for S II and Fe II they overlap the components associated with IC 418. The continuum levels for these lines were defined by the intensities along the apparent edges of the foreground lines, and thus are not as certain. The 1- errors listed in Table 1 reflect the combined uncertainties arising from two effects: one is the uncertainty of the defined continuum level, and the other is the error produced by random noise for intensities within the wavelength interval of the line. These effects should be independent of each other, hence their magnitudes can be added in quadrature to arrive at a final error estimate.
The circumstances under which the column densities have been calculated differ considerably for the different species, reflecting the large disparities in line strengths. We summarize the four approaches we used for deriving , together with the applicable ions in each case:
-
1.
The line is undetected or marginally detected: the listed upper limit equals the formally derived value plus a 2 error (Fe II 1611, Fe II*, Ni II).
-
2.
A single line of moderate strength is measured: the listed value assumes no saturation, so the true amount could be somewhat greater if there are unresolved saturated components present (C IV, Fe II 1261, Ge II).
-
3.
Two lines are measured and they are probably saturated: the listed limits correspond to a standard doublet-ratio calculation assuming the lower limit for the column density is given by the weak line’s W and the strong line’s W, while the upper limit is given by the weak line’s W and the strong line’s W (Mg II, Si IV, S II, S III**).
-
4.
The line is flat-bottomed and heavily saturated. A lower limit is derived assuming (O I*,O I**).
Although two lines of Fe II lie within our observed spectral range, we could only show that the stronger line is not saturated since the other line is weaker by a factor of 14, and is not detected. The column density range for S III* was calculated assuming the velocity dispersion was identical to each of the two solutions we found by performing the doublet ratio analysis of S III**. The upper limit of infinity arises from the fact that the upper limit calculation for S III** gives a value b=1.1 km s-1 that makes the S III* line too saturated to give a reliable column density limit. We emphasize that for ions having multiple levels within the ground term the derived column densities in Table 1 apply only to those ions occupying the specific lower level of the transition listed. The total column density of the ion must account for ions occupying other levels within the ground state.
3.2 Nebular Emission Lines
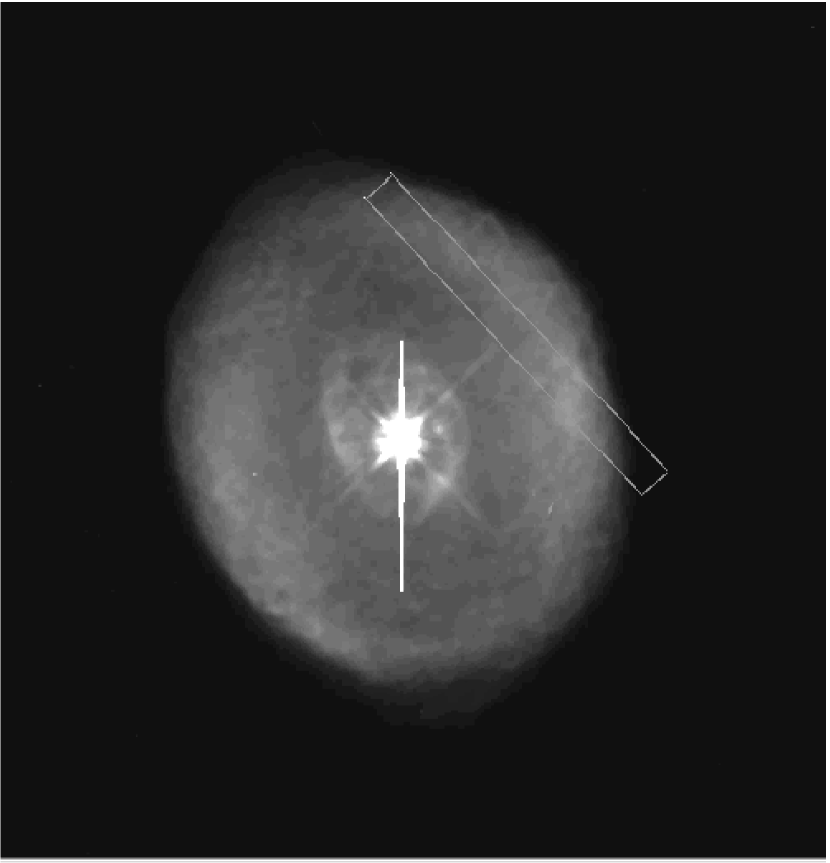
As part of a detailed study of faint emission lines in nebulae, we obtained high resolution spectra of a section of the nebular shell of IC 418 in 2001 December using the CTIO 4m echelle spectrograph with the long camera in order to measure relative emission line intensities. The observations were made at a spectral resolution of 9 km s-1 through a 1″ 11″ slit oriented N-S, i.e., roughly parallel to the major axis of the nebula, and offset 4.3″ to the west of the central star, as shown in Fig. 2. It should be emphasized that this line of sight is offset from that for which the absorption lines were observed, and therefore a comparison of emission and absorption results should bear in mind differences that may be due to inhomogeneities. A sufficiently high signal to noise was obtained over five nights of observing to record fluxes for lines between 3500-9850Å having intensities down to 10-5 that of H. Standard spectroscopic reduction techniques were applied to produce extracted flux calibrated spectra, with special care taken to subtract out echelle ghost and airglow features and system noise in order to achieve the faintest possible detection limits. Night sky lines were removed by using a combination of criteria that enabled such features to be characterized, including their presence on the portion of the spectral image that extended beyond the shell of IC 418, their narrow profiles, and their known wavelengths from the airglow atlas of Osterbrock et al. (1996). A complete description of the data processing and the resultant emission line fluxes is presented by Sharpee (2003). For the present study the emission lines from those ions for which we were also able to identify resonance absorption in the stellar continuum are listed in Table 2, together with the specific transitions, the extinction-corrected emission fluxes, and atomic parameters relevant to electron impact excitation of the lines. The fluxes refer to the region of the PN shell, which has roughly constant surface brightness, that was sampled by our 1″ 11″ slit. Although we observed many forbidden and recombination lines the only published atomic data we could find for transitions from ions with reliable column densities were for the brighter forbidden lines listed, and these should be predominantly collisionally excited.
The emission measures of the ions have been calculated in Table 2 from eq. 1 based upon the reddening-corrected absolute fluxes of the lines, using the reddening curve of Seaton (1979) with an absolute extinction at H of (nebular extinction parameter , as determined from the ratios of Balmer and Paschen lines originating from the same upper level), and taking collisional excitation to be the primary mechanism of excitation for an assumed 3-level atom. The latter assumption should provide reasonably accurate excitation rates, although the inclusion of additional levels will serve to increase the line excitation coefficient, especially for a complicated ion such as Fe II. The were calculated using the atomic parameters listed in Table 2 (cf. Pradhan & Zhang 1993; Bautista & Pradhan 1996) and electron temperatures of K, respectively, for the neutral, singly, and doubly ionized ions, and the results are given in column 5. The temperatures are taken from the values determined for IC 418 by Hyung, Aller, & Feibelman (1994) from their spectroscopic study and solutions for the forbidden line intensities. The resultant emission density , for each ion has been computed from the ratio of the emission measure to the column density for the ion, and these are listed in the final column of Table 2.
The ion column densities used to calculate the emission densities have been determined from the data in Table 1, with a correction for the population of all fine structure levels within the ground state. The corrections are as follows for the different ions:
-
1.
O I was assumed to have a Boltzmann population among the ground levels because of the large column densities determined for the first and second excited levels, and their critical densities of =104 cm-3.
-
2.
S II has only the one ground level.
-
3.
S III was also assumed to have a Boltzmann distribution because of the large column densities observed for the first and second excited levels, and their critical densities of =104 cm-3.
-
4.
Fe II was assumed to occupy only the ground level because of the low column density limit observed for the Fe II* line, and the high critical densities of =106 cm-3 for the excited levels of the ground state.
-
5.
Ni II was assumed to occupy only the ground level due to the high critical density of =107 cm-3 for the excited fine-structure level of the ground state doublet.
The geometrical factor used in the calculation of the emission densities is determined in the following manner. For a rectangular spectrograph slit that extends across a chord of a spherical nebula, having its nearest edge at an angular distance from the center and the far edge at ,
| (3) |
for a nebular shell having angular radius with a uniform, including clumpy, distribution of inside, and assuming the slit to project across the full extent of the nebula. In this circumstance, is usually only a few tens of percent different from unity. By contrast, if the ions are confined within a thin shell having a thickness much less than ,
| (4) |
provided the shell extends beyond . Here, is independent of the offset from the center of the nebula and can signify a substantial enhancement of the flux over that which emanates from a similar sized column that is immediately adjacent to the central star. Models of IC 418 indicate that its geometry is that of a thick spherical shell (Flower, 1969; Reay & Worswick, 1979), consistent with its fairly uniform surface brightness. For the slit position used for our IC 418 observations should therefore have values between the extremes represented by eqs. 3 and 4, resulting in values . We have chosen the intermediate value =2 for our calculations. Because of the uncertainties associated with the column densities due to blending and line saturation effects, the emission densities derived for most of the ions span a relatively large range of values.
3.3 Comparative Abundances and Emission Densities
Relative abundances of ions can be obtained from either the emission measures or the column densities by taking simple ratios if the ions are co-spatial. Because they are derived from independent techniques, a comparison of the relative abundances from the different methods should provide a measure of their reliability. An alternative way to test the consistency of the results for an individual ion is to compare the emission density of that ion with the measured value of the electron density in the nebular shell. Any departure of the from the measured electron density indicates discrepant results between the emission and absorption analyses for that ion.
Our observations of the doublet ratios of [O II] 3729/3726, [S II] 6731/6716, and [Cl III] 5538/5518 can be used to derive values of of, respectively, cm-3 for IC 418, in agreement with the results of Stanghellini & Kaler (1989). A plot of the emission densities for the five ions for which we were able to determine values is given in Fig. 3, shown as a function of the ionization potential required to produce each ion. Unfortunately, the quality of the data are such that we have been able to establish only lower or upper limits to the column densities, rather than a specified range, and this restricts our useful data points for IC 418 to a small number. Clearly, in order to exploit this technique a much larger database of high resolution UV spectra of nebular central stars is required than is presently available, but this situation should soon be rectified with the current instrumentation on HST.
The horizontal dashed line in Fig. 3 represents the mean electron density of the IC 418 shell as determined from the above doublet line ratios, and except for Fe II, which has a notably low emission density, the allowable ranges of the other emission densities include the mean value of for the nebula. The emission density for Ni II is a bit high, which might indicate a possible contribution to the line excitation by a process other than electron impact, as mentioned previously and elaborated on below.
Given that the mean value of in IC 418 is close to or above the upper limits to the emission densities for S II and Fe II, the data are suggestive that the emission densities for the low ionization ions may be generally lower than the electron density. If true, it would either require unknown processes which act to decrease the emission line intensities below the collisional excitation rates, or the existence of an appreciable amount of (presumably cool) gas which absorbs but does not radiate. The presence of significant amounts of neutral and low ionization gas associated with ionized nebulae has been documented for various objects, and it may be a more extensive phenomenon than previously believed (Dinerstein, Sneden, & Uglum, 1995; Huggins et al., 1996).
There is an additional feature of Fig. 3 that is important to understand and which demonstrates the value of the emission density parameter. Ions which occupy the same regions of gas should have the same emission densities. Stated differently, abundance ratios derived for co-spatial ions should be invariant to both the line of sight and whether determined from emission or absorption lines. The ions Fe+ and Ni+ are expected to be co-spatial because iron and nickel have very similar ionization potentials for their first five stages of ionization, and similar condensation temperatures. In addition, the ratios of the photoionization cross sections to the recombination coefficients for the ions of Fe and Ni are very similar over a wide range of energies except those just above the thresholds (cf. Fig. 3 of Sofia & Jenkins 1998). Thus, the gas phase abundance ratios of Fe+/Ni+ derived from either the emission or the absorption lines should have similar values. This is not the case for the IC 418 data.
The column densities derived from the nebular absorption equivalent widths of Fe II 1260.5 and Ni II 1317.2 yield Fe+/Ni (Table 1), compared to the solar value of 19. This ratio is consistent with that found for the ISM, in which Ni is depleted slightly more than Fe (Savage & Sembach, 1996). The relative emission fluxes of [Fe II] 8617 and [Ni II] 7378, on the other hand, lead to an abundance ratio of Fe+/Ni+ = 5, assuming predominant collisional excitation of the lines (Table 2). The discrepancy between these two values is greater than can be accounted for by observational uncertainties, suggesting that either the f-values and collision strengths used in the calculation are in error or the proper excitation mechanisms have not been accounted for in the emission calculation. Collisional quenching of the lines is not a factor since the critical densities for their upper levels exceed cm-3.
The possibility that the atomic cross sections for the relevant transitions may be in error by combined factors of five cannot be ruled out, although this is believed to be unlikely. A more realistic possibility is that we have overlooked a significant source of excitation for the [Ni II] line. The complicated structure of Fe II makes it likely that our assumption of a 3-level atom underestimates the excitation of the [Fe II] line (Bautista, Peng, & Pradhan, 1996), but that only serves to exacerbate the discrepancy by decreasing the emission-determined Fe+/Ni+ ratio further.
The formation of the absorption lines is rather straightforward because they originate from the ground state, so attention can be focused on the excitation processes for the emission lines. There have been independent suggestions of problems in this regard, as anomalously high nickel abundances derived for various nebulae from the [Ni II] 7378 line (Henry & Fesen, 1988) have previously led to the suggestion that this line can be excited predominantly by fluorescence of stellar continuum radiation.
Lucy (1995) has shown that resonance fluorescence of stellar continuum radiation can be important in exciting [Ni II] 7378 near a strong UV source, and Bautista, Peng, & Pradhan (1996) have extended that work to a number of [Ni II] and [Fe II] lines. We have investigated this process for our observations, and at the slit position we have used resonance scattering does compete with the collisional excitation of [Ni II] 7378, although it is not important for the other lines. Using the observed IUE stellar continuum flux for IC 418 at 1742Å (the pumping wavelength for the Ni II resonance fluorescence) and the parameters derived by Patriarchi, Perinotto, & Cerruti-Sola (1989) for the central star, we find that at most 25% of the observed emission of [Ni II] 7378 should be due to resonance fluorescence if all of the line emission were to originate from the slit position corresponding to the minimum distance of 4.3″ , roughly cm, from the central star. Since the distribution of the line emission is moderately uniform along the slit the actual contribution of resonance fluorescence to the observed 7378 flux should be less than 25%. Thus, resonance fluorescence does make a contribution to the [Ni II] line, but it fails to account for most of the line flux that we have observed.
We are left with the following facts regarding the emission and absorption line strengths in IC 418:
-
1.
The intensity of [Fe II] and probably also [S II] emission is weaker than it should be for their derived column densities and the nebular electron density of cm-3.
-
2.
The relative [Fe II] and [Ni II] intensities differ from the values they should have based on the measured Fe+ and Ni+ column densities, assuming collisional excitation of the lines, and fluorescent excitation of the [Ni II] does not account for this discrepancy.
We have explored various alternatives that might explain the difference between the Fe+/Ni+ abundance derived from the emission and the absorption lines, but no satisfactory explanation has emerged. The fact that the Ni II emission density is closer to the electron density than that of Fe II suggests that the [Fe II] should be considered to be abnormally weak more than the [Ni II] is overly strong. It would be instructive to determine the emission densities for Ni II in those nebulae for which Henry & Fesen (1988) deduced a high Ni abundance from the [Ni II] emission lines in order to resolve this dilemma.
The data from IC 418 show that there are some discrepancies in the abundances derived for various ions from their absorption versus emission lines. Nevertheless, inconsistent line strengths for ions should not be considered too problematical on the basis of data from just this one object. If a pattern emerges for the same ions in other objects, however, it would signal problems with either the atomic data or the excitation processes assumed for those ions. Data from additional nebulae are necessary to resolve the questions posed here, and we have performed a search of the electronic edition of the Acker et al. (1992) catalogue of PNe in order to identify good candidate PNe for such future studies. Table 3 lists those objects which have relatively bright central stars (), radial velocities that deviate by more than 40 km s-1 from the LSR, and higher surface brightnesses. These PNe should be among the prime targets for followup work.
4 Summary
The combination of both absorption and emission analyses provides important information on the structure of emission regions, physical conditions in the gas, and element abundances, and should be utilized in the abundance analyses of nebulae. It is imperative that UV spectroscopy of a larger sample of stars embedded in and behind emission regions be obtained in order to address the reliability of abundance determinations from absorption versus emission lines. Because of the different lines of sight and techniques employed, a combined emission and absorption analysis provides more complete information about the objects, including their gas distribution and inhomogeneities, than individual emission or absorption analyses alone. The emission density of an ion is an important parameter that characterizes its emission and absorption properties, and also provides information on the gas geometry, especially the nature of inhomogeneities, and line excitation mechanisms.
The combined analyses of IC 418 suggest that some forbidden lines, particularly those of low ionization, may not lead to correct gas phase ion abundances using standard assumptions of emission analysis. This is particularly evident for Fe+. The data also suggest the likely existence of non-emitting gas in IC 418 whose presence is revealed by the absorption lines. Additional data are needed that provide more tightly constrained column densities for a larger sample of objects in order to fully exploit the technique. However, it is clear that the comparison of emission- and absorption-line data for the same object is a important tool for determining abundances from nebular spectra and for establishing which emission lines are reliable indicators of ion abundance.
References
- Acker et al. (1992) Acker A., Ochsenbein, F., Stenholm, B., Tylenda, R., Marcout, J., & Schohn, C. 1992, ”Catalogue of Galactic Planetary Nebulae,” (Garching: ESO)
- Bautista, Peng, & Pradhan (1996) Bautista, M.A., Peng, J., & Pradhan, A.K. 1996, ApJ, 460, 372
- Bautista & Pradham (1996) Bautista, M.A. & Pradhan, A.K. 1996, A&AS, 115, 551
- Dinerstein, Sneden, & Uglum (1995) Dinerstein, H.L, Sneden, C., & Uglum, J. 1995, ApJ, 447, 262
- Dopita & Sutherland (2002) Dopita, M.A. & Sutherland, R.S. 2002, Astrophysics of the Diffuse Universe (Berlin: Springer-Verlag)
- Esteban et al. (1999) Esteban, C., Peimbert, M., Torres-Peimbert, S. Garcia-Rojas, J., & Rodriguez, M. 1999, ApJS, 120, 113
- Filippenko & Halpern (1984) Filippenko, A.V. & Halpern, J.P. 1984, ApJ, 285, 458
- Flower (1969) Flower, D.R. 1969, MNRAS, 146, 243
- Garnett & Dinerstein (2001a) Garnett, D.R. & Dinerstein, H.L. 2001a, ApJ, 558, 145
- Garnett & Dinerstein (2001b) Garnett, D.R. & Dinerstein, H.L. 2001b, Rev. Mex. Astron. Astrof. (Ser. Conf.), 10, 13
- Harrington, Lutz, & Seaton (1981) Harrington, J.P., Lutz, J.H., & Seaton, M.J. 1981, MNRAS, 195, 21P
- Henry & Fesen (1988) Henry, R.B.C. & Fesen, R.A. 1988, ApJ, 329, 693
- Huggins et al. (1996) Huggins, P.J., Bachiller, R., Cox, P., & Forveille, T. 1996, A&A, 315, 284
- Hyung, Aller, & Feibelman (1994) Hyung, S., Aller, L.H., & Feibelman, W.A. 1994, PASP, 106, 745
- Jenkins, Silk, & Wallerstein (1976) Jenkins, E.B., Silk, J., & Wallerstein, G. 1976, ApJS, 32, 681
- Kingdon, Ferland, & Feibelman (1995) Kingdon, J., Ferland, G.J., & Feibelman, W.A. 1995, ApJ, 439, 793
- Korista & Ferland (1989) Korista, K.T. & Ferland, G.J. 1989, ApJ, 343, 678
-
Lindler (1998)
Lindler, D. 1998, CALSTIS Reference Guide
http://hires.gsfc.nasa.gov/stis/software/software.html - Liu et al. (1995) Liu, X.-W., Storey, P.J., Barlow, M.J., & Clegg, R.E.S. 1995, MNRAS, 272, 369
- Liu et al. (2000) Liu, X.W., Storey, P.J., Barlow, M.J., Danziger, I.J., Cohen, M., & Bryce, M., 2000, MNRAS, 312, 585
- Liu et al. (2002a) Liu, X.-W. 2002a, Rev. Mex. Astron. Astrof. (Ser. Conf.), 12, 70
- Liu et al. (2002b) Liu, X.-W. 2002b, in Proc. IAU Symp. 209: Planetary Nebulae, ed. M. Dopita (San Francisco: ASP), in press
- Lucy (1995) Lucy, L.B. 1995, A&A, 294, 555
- Morton (1991) Morton, D.C. 1991, ApJS, 77, 119
- Morton (2000) Morton, D.C. 2000, privately circulated updated version of Morton (1991)
- Osterbrock (1989) Osterbrock, D.E. 1989, Astrophysics of Gaseous Nebulae & Active Galactic Nuclei (Mill Valley: University Science)
- Osterbrock et al. (1996) Osterbrock, D.E., Fulbright, J.P., Martel, A.R., Keane, M.J., & Trager, S.C. 1996, PASP, 108, 277
- Patriarchi, Perinotto, & Cerruti-Sola (1989) Patriarchi, P. Perinotto, M., & Cerruti-Sola, M. 1989, ApJ, 345, 327
- Peimbert (1967) Peimbert, M. 1967, ApJ, 150, 825
- Peimbert, Storey, & Torres-Peimbert (1993) Peimbert, M. Storey, P.J., & Torres-Peimbert, S. 1993, ApJ, 414, 626
- Pradhan & Zhang (1993) Pradhan, A.K. & Zhang, H.L. 1993, ApJ, 409, L77
- Pwa, Mo, & Pottasch (1984) Pwa, T.H., Mo, J.E., & Pottasch, S.R. 1984, A&A, 139, L1
- Pwa, Pottasch, & Mo (1986) Pwa, T.H., Pottasch, S.R., & Mo, J.E. 1986, A&A, 164, 184
- Reay & Worswick (1979) Reay, N.K. & Worswick, S.P. 1979, A&A, 72, 31
- Savage & Sembach (1996) Savage, B.D. & Sembach, K.R. 1996, ARA&A, 34, 279
- Schweizer & Middleditch (1980) Schweizer, F. & Middleditch, J. 1980, ApJ, 241, 1039
- Seaton (1968) Seaton, M.J. 1968, MNRAS, 139, 129
- Seaton (1979) Seaton, M.J. 1979, MNRAS, 187, 73P
- Sembach & Savage (1992) Sembach, K.R., & Savage, B.D. 1992, ApJS, 83, 147
- Sharpee (2003) Sharpee, B. 2003, Ph.D. dissertation, Michigan State University
- Shields (1978) Shields, G.A. 1978, ApJ, 219, 559
- Sofia & Jenkins (1998) Sofia, U. & Jenkins, E.B. 1998, ApJ, 499, 951
- Stanghellini & Kaler (1989) Stanghellini, L. & Kaler, J.B. 1989, ApJ, 343, 811
- Storey (1981) Storey, P.J. 1981, MNRAS, 195, 27P
- Tsamis et al. (2002) Tsamis, Y.G., Barlow, M.J., Liu, X.-W., Danziger, I.J., & Storey, P.J. 2002, MNRAS, in press
- Viegas & Clegg (1994) Viegas, S. & Clegg, R.E.S. 1994, MNRAS, 271, 993
- Walborn et al. (2002) Walborn, N.R., Danks, A.C., Vieira, G., & Landsman, W.B. 2002, ApJS, 140, 407
- Williams (1973) Williams, R.E. 1973, MNRAS, 164, 111

| aaWavelengths and -values from Morton (2000), except for C IV and Si IV which were taken from Morton (1991). | aaWavelengths and -values from Morton (2000), except for C IV and Si IV which were taken from Morton (1991). | Species | error | |
|---|---|---|---|---|
| (Å) | (mÅ) | () | ||
| 1550.770 | 2.167 | C IV | 50.6 | |
| 1304.858bbThis feature is seen twice, at opposite ends of two adjacent orders of diffraction. | 1.830 | O I* | 115.3 | |
| 112.4 | ||||
| 1306.029 | 1.830 | O I** | 98.9 | |
| 1239.925 | Mg II | 13.6 | ||
| 1240.395 | Mg II | 10.1 | ||
| 1264.738 | 3.128 | Si II* | 151.7 | ccThe profile of Si II* is complex and probably represents absorptions by many unrelated regions. For this reason, we are not supplying a result for the column density. |
| 1533.431 | 2.303 | Si II* | 130.9 | |
| 1197.394bbThis feature is seen twice, at opposite ends of two adjacent orders of diffraction. | 2.242 | Si II* | 93.1 | |
| 94.9 | ||||
| 1265.002 | 2.174 | Si II* | 91.7 | |
| 1309.276 | 2.078 | Si II* | 77.0 | |
| 1393.755 | 2.855 | Si IV | 64.7 | |
| 1402.770 | 2.554 | Si IV | 44.9 | |
| 1253.811 | 1.136 | S II | 17.7 | |
| 1250.584 | 0.832 | S II | 18.2 | |
| 1194.058 | 1.315 | S III* | 49.4 | |
| 1200.966bbThis feature is seen twice, at opposite ends of two adjacent orders of diffraction. | 1.364 | S III** | 40.8 | |
| 42.8 | ||||
| 1201.726 | 0.616 | S III** | 9.4 | |
| 1260.533 | 1.484 | Fe II | 12.5 | |
| 1611.200 | 0.339 | Fe II | ||
| 1621.686 | 1.823 | Fe II* | 4.5 | |
| 1317.217ddThis spectrum covering the location of this transition was observed three times: once in one exposure, and at opposite ends of two adjacent orders of diffraction another exposure. | 2.284 | Ni II | ||
| 2.5 | ||||
| 2.9 | ||||
| 1370.132 | 2.254 | Ni II | ||
| 1237.059 | 3.035eeMorton (1991) lists this value as 2.035, which is incorrect. | Ge II | 7.2 |
| Line | F0 | A21 | ||||||
|---|---|---|---|---|---|---|---|---|
| (erg cm-2 sec-1) | (sec-1) | (cm-6 pc) | (cm-3) | |||||
| [O I] | 0. | 12 | 197. | |||||
| [S II] | 4. | 8 | 1. | 2 | ||||
| 3. | 2 | 1. | 7 | |||||
| [S III] | 8. | 4 | 7. | 1 | ||||
| [Fe II] | 0. | 93 | 0. | 025 | ||||
| [Ni II] | 0. | 75 | 0. | 0052 | ||||
| PN G | Common Name | RA (J2000) | Dec (J2000) | Vel(LSR) | Diam (″) | SB (H)aaSurface brightness in units of absolute H flux per square arcsec | |
|---|---|---|---|---|---|---|---|
| 118.0-08.6 | Vy 1-1 | 00:16:00 | +53:36:00 | -42.9 | 14.2 | 5.2 | 1.4 |
| 118.8-74.7 | NGC 246 | 00:44:32 | -12:08:44 | -51.1 | 12.0 | 245.0 | 6.3 |
| 165.5-15.2 | NGC 1514 | 04:06:08 | +30:38:43 | 51.9 | 9.4 | 132.0 | 7.7 |
| 215.2-24.2 | IC 418 | 05:25:09 | -12:44:15 | 42.1 | 10.2 | 12.0 | 2.3 |
| 197.8+17.3 | NGC 2392 | 07:26:13 | +21:00:51 | 63.4 | 10.5 | 19.5 | 1.4 |
| 320.1-09.6 | He 2-138 | 15:51:19 | -66:00:26 | -49.7 | 10.9 | 7.0 | 5.2 |
| 341.6+13.7 | NGC 6026 | 15:58:07 | -34:24:16 | -96.5 | 13.3 | 40.0 | 1.8 |
| 326.0-06.5 | He 2-151 | 16:11:25 | -59:46:34 | -129.2 | 13.1 | 3.0 | 1.6 |
| 325.8-12.8 | He 2-182 | 16:49:49 | -64:09:39 | -92.8 | 13.4 | 3.0 | 1.6 |
| 353.7+06.3 | M 2-7 | 17:02:02 | -30:28:24 | -46.7 | 14.0 | 7.8 | 5.3 |
| 345.0-04.9 | Cn 1-3 | 17:22:34 | -44:08:54 | -72.7 | 14.3 | 5.0 | 4.1 |
| 345.2-08.8 | Tc 1 | 17:41:52 | -46:04:10 | -78.2 | 11.4 | 9.6 | 3.1 |
| 096.4+29.9 | NGC 6543 | 17:58:34 | +66:38:05 | -50.1 | 11.1 | 19.5 | 8.2 |
| 002.4-03.7 | M 1-38 | 18:02:55 | -28:40:54 | -59.6 | 14.4 | 3.3 | 1.2 |
| 342.5-14.3 | Sp 3 | 18:03:22 | -51:01:35 | 48.6 | 12.6 | 35.5 | 8.0 |
| 003.3-04.6 | Ap 1-12 | 18:08:25 | -28:23:21 | 162.5 | 13.3 | 12.0 | 3.5 |
| 011.7-00.6 | NGC 6567 | 18:10:48 | -19:05:13 | 132.4 | 14.4 | 7.6 | 2.6 |
| 002.0-06.2 | M 2-33 | 18:11:53 | -30:16:32 | -102.1 | 14.4 | 5.8 | 9.5 |
| 016.4-01.9 | M 1-46 | 18:25:04 | -15:34:53 | 43.9 | 12.8 | 11.0 | 3.3 |
| 015.4-04.5 | M 1-53 | 18:32:53 | -17:38:38 | 76.3 | 14.3 | 6.0 | 2.2 |
| 003.9-14.9 | Hb 7 | 18:52:23 | -32:19:49 | -56.4 | 14.0 | 4.0 | 4.5 |
| 082.5+11.3 | NGC 6833 | 19:48:20 | +48:50:01 | -91.0 | 14.5 | 2.0 | 1.8 |
| 054.1-12.1 | NGC 6891 | 20:12:48 | +12:32:54 | 58.9 | 12.4 | 15.0 | 1.3 |
| 058.3-10.9 | IC 4997 | 20:17:51 | +16:34:22 | -49.5 | 14.4 | 1.6 | 1.5 |
| 093.4+05.4 | NGC 7008 | 20:59:05 | +54:20:41 | -58.8 | 13.2 | 86.0 | 2.4 |