Kinematic outliers in the LMC: constraints on star-star microlensing
Abstract
Although a decade of microlensing searches towards the Large Magellanic Cloud (LMC) has detected possible microlensing events, the nature and the location of the lenses, being either halo machos or LMC stars, remains a subject of debate. The star-star lensing models generically predict the existence of a small population (more than %) of stars with a spatial and kinematic distribution different from the thin, young disc of the LMC. Here we present the results of a large spectroscopic survey of the LMC, consisting of more than 1300 radial velocities measured accurately with the 2dF instrument. In this large sample, no evidence is found for any extraneous population over the expected LMC and Galactic components. Any additional, kinematically distint, population can only be present at less than the 1% level. We discuss the significance of this finding for the LMC self-lensing models.
keywords:
gravitational lensing - dark matter - galaxies: halos - galaxies: individual (LMC) - galaxies: kinematics and dynamics1 Introduction
About a decade of searches for microlenses along the line of sight to the Magellanic Clouds (MCs) by MACHO/OGLE/EROS and a number of follow-up surveys have found more than candidate microlensing events towards the LMC and two towards the SMC. The MACHO collaboration (Alcock et al., 2000) conclude that the lenses are mostly machos residing in the halo of the Galaxy, perhaps in the form of ancient white dwarfs (WDs). These WDs would make up 10-20% of the halo dynamical mass, with the remaining 80-90% in some other component. The detection of high proper motion white dwarfs (Hambly et al. 1997; Hodgkin et al. 2000; Ibata et al. 2000; Oppenheimer et al. 2001) supports this interpretation.
The assertion that WDs make up at least 3% of the expected local dark matter density Oppenheimer et al. (2001) has been hotly contested (see review by Richer, 2001). Some argue very strongly that these WDs trace the thick disk kinematics instead (Reid et al. 2001). If the thick disk interpretation is true, then the halo would have very few WDs, but the big question remains: what objects are responsible for microlensing the LMC stars?
The answer is perhaps the LMC stars themselves. From the very beginning there have been many variations of star-star self-lensing proposals as first advocated by Sahu (1994). Star-star lensing models typically invoke an unvirialised component of the LMC and the SMC (e.g., a puffed up disc or a hot stellar halo with a surface brightness only a few percent of the LMC disc, a wrapped-around tidal ring, an offset bar etc, all due to tidal shocking among the LMC, SMC and the Galaxy) because of the low self-lensing optical depth of a thin virialised LMC disk (Gould 1995). Any unvirialised component of the LMC can then lense with stars in the thin disc of the LMC. Some recent theoretical models (Zhao & Evans, 2001; Jetzer et al., 2002, e.g.,) argue that there could be enough stellar lenses in the LMC bar and disk to account for from half to all of the observed events. These models generally predict that the events should have peculiarities in photometry, kinematics and spatial distribution because the lensing optical depth is higher in some regions than the others. These are highlighted in at least five of the dozen observed events: the LMC near-clump event MACHO-LMC-1 and LMC binary events MACHO-LMC-9 and MACHO-LMC-14, the SMC caustic event MACHO-98-SMC-1 and long duration event MACHO-97-SMC-1. Although there are no strong direct evidences, it is reasonable to expect that all of the dozen observed lenses belong to the same LMC or SMC population as for these exotic events because ordinary single stars should be at least as common as binary stars in a given LMC or SMC stellar population, and they all have similar lensing cross-sections and detection efficiencies.
Zhao (1999a, b) discussed a number of observational tests to differentiate the two competing classes of lensing model. In particular, stars in any proposed unvirialised component should be identifiable as kinematic outliers, meaning that they deviate from the rotation curve of the LMC, as traced by the majority of LMC disc stars and by HI gas. The objective of the present contribution is to analyse the kinematics of large sample of stars towards the LMC to investigate whether outliers can be singled out. These kinematic outliers may reveal the presence of any hot component around the LMC, or any cold halo stream either in the Galactic halo or the LMC halo (Graff et al. 2000). We aim to be able to detect a kinematically distinct population (polar ring or thickened disk) in the LMC present at the % level. If such a population is identified their relation to the microlensed sources can be studied.
We foresaw two possible outcomes of this experiment:
-
1.
The LMC microlensed sources and the randomly selected LMC field stars have disk kinematics: This would imply that the lenses are in the halo, supporting the MACHO interpretation of a dark baryonic component in the halo in the form of white dwarfs and consistent with the high-velocity, blue, old white dwarfs in the solar neighbourhood detected by Ibata et al. (2000) and Oppenheimer et al. (2000).
-
2.
The sample of microlenses or the sample of field stars contain many outliers from the LMC rotation curve, implying that the Galactic dark halo is almost entirely made of a non-compact component. The solar neighbourhood white dwarfs are merely a local peculiarity.


2 Observations
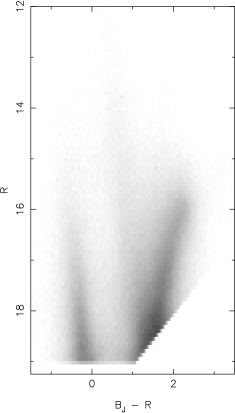
A sample of stars was selected from an LMC Color Magnitude Diagram (CMD) produced from UKST photographic plates measured on the APM facility (see Figure 1). These stars were randomly selected with magnitudes and colours in the ranges and , in order to have as few biases as possible on the sample selection. The fields were chosen centered on each previously microlensed star.
The present dataset is the result of 3 observing campaigns from 1999-2002, using the 2dF (2 Degree Field) instrument at the 3.9m Anglo-Australian Telescope. This instrument is a fibre spectrograph coupled to a robot positioner that is capable of observing the spectra of up to 400 sources simultaneously over a 2-degree diameter circular field. Due to adverse weather conditions only 5 field setups were obtained, all in UK Schmidt Telescope field 56, for a total of 1576 target stars observed. Figure 2 shows the distribution of these sources over the face of the LMC. Table 1 provides a summary of the observing log. The 1200V grating was used, giving spectra with dispersion of 1.1Å/pixel over the wavelength range 4625ÅÅ. For each fibre setup, three 1800 sec exposures were combined.
| Date | Field | RA | DEC | Epoch |
|---|---|---|---|---|
| Nov 24 2000 | F056 Conf 05 | 05 04 03 | -69 33 18 | 2000 |
| Jan 5 2002 | F056 Conf 01 | 05 14 44 | -68 48 01 | 2000 |
| Jan 5 2002 | F056 Conf 02 | 05 17 14 | -70 46 58 | 2000 |
| Jan 5 2002 | F056 Conf 04 | 05 26 14 | -70 21 14 | 2000 |
| Jan 5 2002 | F056 Conf 21 | 05 24 03 | -68 49 12 | 2000 |
The spectral images were debiased, flat-fielded and wavelength calibrated using the excellent 2dF pipeline software. The spectrum of the night sky was monitored with fibres in each setup, and mean sky spectrum was subtracted from the object spectra. Judging from the residuals at the position of the bright [OI]5577Å sky line, the sky subtraction process is accurate to better than %. After combining the 3 exposures, the average quality of the spectra of our survey stars was greater than . The wavelength calibration was checked by fitting the peak of the [OI]5577Å sky line. We estimate that the typical velocity error is .
Due to the wide colour range of the stars observed (), the cost of observing a sufficient number of radial velocity standard stars of spectral types covering this colour range would have been prohibitive with 2dF. Instead we chose to use survey stars as radial velocity standards, picking 10 high S/N stars at roughly even intervals of colour over the above range. Each survey star was crosscorrelated against each template star, giving a relative velocity measurement, the corresponding uncertainty, and Tonry-Davis cross-correlation “R” parameter (Tonry & Davis, 1979). The template spectrum that gave the highest “R” value was considered to provide the best crosscorrelation match with a particular survey star, and the resulting radial velocity difference was used to compute the heliocentric radial velocity of the survey star. The zero-point velocity of one of the (K-type) LMC radial velocity “standards” was measured with respect to a genuine radial velocity standard of the same spectral type. The radial velocity offsets of the remaining 9 LMC radial velocity “standards” were calculated by fitting the peak of the numerous LMC population (where we assume that there is no systematic offset in velocity between stars of different spectral types in the LMC).
To ensure a good quality sample, we applied three parameter cuts to the dataset: we require the Tonry-Davis cross-correlation parameter to be ; the heliocentric radial velocities are constrained to have ; and the radial velocity uncertainties (determined from the fit of the cross-correlation peak) were set to be . The resulting dataset, cleaned of low signal to noise spectra and spectra that were not well matched by our library of 10 “standard” stars, comprises 1347 objects. The velocity histogram of this sample is displayed in Figure 3. A scatter diagram is also shown in Figure 4 for the velocity and the color of our sample stars.


3 The expected Galactic and LMC populations
The LMC is located at , i.e. roughly toward the direction of anti-rotation, and is below the disk at . Since the Sun rotates about the Galactic Centre faster than the LSR (Dehnen & Binney, 1998), most local stars will be seen towards lower heliocentric radial velocities. However, the main effect is that the projection of the circular velocity vector of the disk decreases beyond the tangent point. Thus the majority of Galactic disk stars seen along the line of sight towards the LMC will be seen with . In Figures 4(lower-panel) and 5 we display a kinematic star-counts model, which contains disk, thick disk and spheroid populations. The expected number of sources per square degree within our magnitude range is 1012 (disk: dashed), 620 (thick disk: dot-dashed) and 370 (spheroid: dotted) (Ibata, 1994).
Note that, of the stars with , most have intermediate colours , and are therefore typically Solar-luminosity main-sequence stars with (e.g. Binney & Merrifield, 1998). The distance range corresponding to our magnitude selection range , is then . Given the Galactic latitude of the fields, these disk stars are located several scale heights below the disk, and mostly beyond the tangent point. Nearby, intrinsically fainter, and redder disk dwarfs hardly make it into the magnitude selection region.
The simplest explanation of our data is as follows:


-
1.
The 40 stars with are normal disk dwarfs, and display an expected radial velocity distribution.
-
2.
The 1291 stars with are drawn from a single simple Gaussian distribution, with intrinsic dispersion .
-
3.
The 3 stars with and have suspect velocities because their radial velocities as derived from different (but similar) templates do not agree.
-
4.
The 11 stars with and are spheroid stars.
-
5.
The 2 stars with are halo stars.
According to the model displayed in Figure 5, the number of stars in the velocity range should number only 5% of the number in the velocity range . The observed number is 35%. Is the excess of stars due to an extraneous unexpected population that could account for the observed microlensing? This population, however, would only represent a small fraction of the mass required to account for the observed frequency microlensing. Hence this data effectively rules out the existence of an extraneous kinematic population that exceeds 1% of the LMC.
4 Comparison with previous work
The distribution of radial velocities of LMC stars has been studied by many authors. The kinematical properties of the LMC have been studied with many different tracers, including HI (Kim et al., 1998, e.g.), star clusters (Freeman et al. 1983; Schommer et al. 1992), planetary nebulae (Meatheringham et al., 1988), HII regions and supergiants (Feitzinger et al., 1977). Recently van der Marel et al. (2002) have combined the carbon stars dataset of Kunkel et al. (1997). which covers the periphery of the LMC at all position angles, with 573 stars from Hardy et al. (2002), which were selected from the surveys of Blanco et al. (1980). van der Marel et al. (2002) describe the radial velocity field with a rotation of stars in the LMC centered on and , which is about away from the gas kinematical center. The kinematics of stars are roughly described by a flat rotation of outside with an inclination and a position angle . The velocity dispersion for the carbon stars is 20– between and from the center, followed by a decline to 16– between and from the center, and a subsequent increase to 21– between and . The velocity dispersion increases with age (Gyuk et al., 2000, e.g.), with a range from for the youngest populations (e.g., supergiants, HII regions, HI gas) to for the oldest populations (e.g., old long-period variables, old clusters). The carbon stars are part of the intermediate-age population which is believed to be fairly representative for the bulk of the mass in the LMC. Our sample appear to be consistent with the carbon star sample of van der Marel et al. (2002). Figure 6 is made to examine the question whether there is any significant velocity variation with spatial position. Given the sparseness of our sample, we do not see any strong systematic variation across our fields. Our fields are also mostly on the short-axis of the LMC disk, hence the signature due to rotation is also very weak. This supports our treatment of our sample as a whole.

5 Analysis
We now investigate the question of whether we could have detected a significant population superimposed on the LMC.
Figure 4 is a diagram similar to the Hess diagram, but shows the Galactic model projected in the radial velocity and colour plane. We normalise the Galactic model using those neighbouring field histograms. Compare this with the distribution of possible Galactic stars in our sample e.g. the 4 blue stars with km/s. It is difficult for a standard Galactic model to account for the velocity distribution we are observing even for the redder objects in the km/s range.
We also test the Galactic model by comparing it with a colour histogram from our plate data in that region in the magnitude range. With plausible assumptions about completeness, Figure 7 shows the color histograms in a few UKST fields #54, #56 and #58. Except for the reference field #56, which is on the LMC, these fields are sufficiently away from the LMC to represent the Galactic distribution in the general direction of the LMC. While there are significant differences between #54 and #58, the overall distribution resembles the prediction from our Galaxy model (cf. Fig. 5), i.e., most of Galactic stars in the LMC direction have a largely bimodal color distribution peaked around and . Our Galaxy model, albeit simple, should not significantly bias our conclusion.

6 Conclusions
If the microlensing in the LMC is indeed due to self-lensing, then kinematic outliers are expected towards the LMC in their distributions of radial velocity, proper motion, projected distance from the center of the LMC, distance modulus and reddening (Zhao 1999a,b). The lack of features in our radial velocity sample argues tentatively for a relatively smooth and uniform distribution of stars in the LMC with very few outliers. Our data does not support the notion that there is a large fluffy stellar halo around the LMC (e.g., Evans & Kerins 2000).
On the other hand, it is very unlikely for the hypothetical (Milky Way) halo white dwarfs to account for the lensing in the LMC. Zhao (2002) argues that any violent galactic winds following early epoch of star bursts would significantly weaken the potential wells of galaxies. The Milky Way galaxy would have been disintegrated if more than half of its dynamical mass were blown off violently in a wind generated by the formation of numerous macho progenitors. Since the Milky Way galaxy is very tightly bound, and there is no sign of any globular cluster escaping from the Milky Way either, these should imply an upper limit on the baryons participating the early star bursts and baryons locked in stellar remnants, such as white dwarfs. The white dwarfs should not make up more than 1-5% of the total mass of the Galaxy. Similar arguments also imply upper limits for the amount of neutron stars and stellar black holes, in galaxy halos. This dynamical upper limit is exceeded by the amount of halo white dwarfs claimed in recent proper motion searches and in earlier microlensing observations (Alcock et al. 2000) in the Galactic halo, suggesting these interpretations of observations to be problematic theoretically.
We propose that the most likely one of existing models for microlensing in the LMC is perhaps the “mutual-lensing” models of Zhao & Evans (2001), where the LMC stars are on two distinct planes with different inclinations or warped 111The LMC disk is known to have a poorly defined inclination observationally, and is perhaps warped (e.g., Olsen & Salyk 2002) so that stars on the front plane could lense those in the plane kpc behind. One of the planes may be the LMC disk, and the other may well be the irregular bar of the LMC, which is known to be offset from the LMC disk. Such a unvirialised configuration could only be a transient phase of the general process of merging, after perhaps recent interactions with SMC and the Milky Way. In this type of models we do not expect the stars in the two planes to share the same rotation around the LMC disk, but the differences in systematic velocities should be small because they share a common potential well. Our data can exclude any systematic offset of safely, but not yet exclude the possibility of smaller velocity distortion due to different inclinations in the LMC. A larger sample with more accurate velocity would be needed to reveal small differences among disk or bar stars of the LMC, and set stronger limits on star-star lensing in the LMC.
We thank Brian Boyle for undertaking the service observing at the AAT.
References
- Alcock et al. (2000) Alcock, C. et al. 2000, ApJ 542, 281
- Binney & Merrifield (1998) Binney J. & Merrifield M. 1998, Galactic Astronomy, Princeton Univ. Press
- Blanco et al. (1980) Blanco, V., Blanco, B., McCarthy, M. 1980, ApJ 242, 938
- Dehnen & Binney (1998) Dehnen, W., Binney, J. 1998, MNRAS 298, 387
- Evans & Kerins (2000) Evans N. Wyn & Kerins E. 2000, ApJ, 529, 917
- Feitzinger et al. (1977) Feitzinger, J., Schmidt-Kaler, T., Isserstedt, J. 1977, A&A 57, 265
- Freeman et al. (1983) Freeman, K., Illingworth, G., Oemler, A. 1983, ApJ 272, 488
- Gould (1995) Gould A., 1995, ApJ, 441, 77
- Graff et al. (2000) Graff D., Gould A., Suntzeff N., Schommer R. & Hardy E. 2000, ApJ, 540, 211
- Gyuk et al. (2000) Gyuk, G.; Dalal, N.; Griest, K. 2000, ApJ 535, 90
- Hambly et al. (1997) Hambly, N., Smartt, S., Hodgkin, S. 1997, ApJ 489, L157
- Hardy et al. (2002) Hardy, E., Schommer, R., Suntzeff, N. 2002, in preparation
- Hodgkin et al. (2000) Hodgkin, S., Oppenheimer, B., Hambly, N., Jameson, R., Smartt, S., Steele, I. 2000, Nature 403, 57
- Ibata (1994) Ibata, R, 1994, PhD thesis, Cambridge
- Ibata et al. (2000) Ibata, R, Irwin, M., Bienaymé, O., Scholz, R., Guibert, J. 2000, ApJ 532, 41L
- Jetzer et al. (2002) Jetzer Ph. , Mancini L., Scarpetta G. 2002, A& A, 393, 129
- Kim et al. (1998) Kim, S., Staveley-Smith, L., Dopita, M., Freeman, K., Sault, R., Kesteven, M., McConnell, D. 1998, ApJ 503, 674
- Kunkel et al. (1997) Kunkel, W., Irwin, M., Demers, S. 1997, A&AS 122, 463
- van der Marel et al. (2002) van der Marel R., Alvels D. R., Hardy E. & Sunzeff N. B. 2002, AJ, in press
- Meatheringham et al. (1988) Meatheringham, S., Dopita, M.., Ford, H., Webster, B. 1988, ApJ 327, 651
- Olsen & Salyk (2002) Olsen K.A.G. & Salyk C. 2002, AJ in press (astro-ph/0207077)
- Oppenheimer et al. (2001) Oppenheimer, B., Hambly, N., Digby, A., Hodgkin, S., Saumon, D. 2001, Science 292, 698
- Reid et al. (2001) Reid N., Sahu K. & Hawley S. 2001, ApJ, 559, 942
- Richer (2001) Richer H. B., 2001, in proceedings of “The Dark Universe: Matter, Energy and Gravity” (astro-ph/0107079)
- Sahu (1994) Sahu, K. 1994, Nature 370, 275
- Schommer et al. (1992) Schommer, R., Suntzeff, N., Olszewski, E., Harris, H. 1992, AJ 103, 447
- Tonry & Davis (1979) Tonry J., Davis M., 1979, AJ, 84, 1511
- Zhao (1999a) Zhao H.S. 1999a, ApJ 526, 141
- Zhao (1999b) Zhao H.S., 1999b, ApJ 527, 167
- Zhao (2002) Zhao H.S. 2002, MNRAS, 336, 159
- Zhao & Evans (2001) Zhao, H.S., & Evans, N.W., 2001, ApJ 545, L35