Does the fine structure constant vary? A detailed invest-igation into systematic effects
Abstract
We have previously presented 5.7 evidence for a smaller at redshifts from a sample of 128 Keck/HIRES quasar absorption systems: . A non-zero manifests itself as a distinct pattern of shifts in the measured absorption line wavelengths. The statistical error is now small: we do detect small line shifts in the HIRES data. Whether these shifts are due to systematic errors or due to real variation in is now the central question. Here we summarize the two potentially most important systematic effects: atmospheric dispersion and isotopic abundance evolution. Previously, these have been difficult to quantify/model but here we find that neither of them can explain our results. Furthermore, the HIRES spectra themselves contain no evidence for these effects. Independent measurements of with a different telescope and spectrograph are now crucial if we are to rule out or confirm the present evidence for a variable .
keywords:
line: profiles – instrumentation: spectrographs – methods: data analysis – techniques: spectroscopic – quasars: absorption lines1 Introduction
In \inlineciteMurphyM_02a and \inlineciteWebbJ_03b we presented new evidence for a smaller fine structure constant, , in high redshift quasar absorption clouds: . This preliminary result is the weighted mean from a many-multiplet (MM) analysis of 128 absorption systems and represents a significant improvement on our previously published result from 49 systems [Murphy et al. (2001a), Webb et al. (2001)]: . Such a potentially fundamental result requires extreme scrutiny, including a thorough consideration of possible systematic errors. In \inlineciteMurphyM_01b we explored a wide range of possibilities: laboratory wavelength errors, wavelength calibration errors, atmospheric dispersion effects, unidentified interloping transitions, isotopic ratio and/or hyperfine structure effects, intrinsic instrumental profile variations, spectrograph temperature variations, heliocentric velocity corrections, kinematic effects and large scale magnetic fields. All but two of these – atmospheric dispersion effects and isotopic abundance variation – were shown to be negligible.
Here we present an updated analysis of these two effects. We also present new results from a line removal test which constrains systematic errors associated with individual transitions or species.
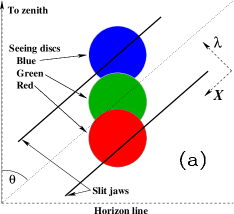
2 Atmospheric dispersion effects
Fig. 1a illustrates how atmospheric dispersion results in an angular separation between different wavelengths as they enter the spectrograph slit. This separation increases with increasing zenith angle, . For the particular optical design of the Keck/HIRES, the component of angular separation across the slit (i.e. in the wavelength direction as projected from the CCD) will cause a compression of the quasar spectrum. Such a compression will mimic for the Mg/Fe ii systems observed at , the effect being complicated at high- by the diversity of coefficients111The coefficient measures the sensitivity of a transition wavelength to changes in . See [Dzuba et al. (2002)] for details and updated values. (see Fig. 2a). A wavelength dependent asymmetry will also be introduced into the instrumental profile (IP) due to truncation of the seeing discs by the slit edges. These effects will not be applied to the thorium-argon (ThAr) calibration spectra since the ThAr lamp illuminates the slit uniformly in all cases.


An image rotator is usually employed to hold the slit axis perpendicular to the horizon as the quasar is tracked across the sky. This eliminates the compression and IP asymmetry effects. Only 51 of our 128 absorption systems were observed in this way; 77 systems were observed before August 1996 when Keck/HIRES was fitted with an image rotator. However, the values of for the 77 affected and 51 unaffected systems are consistent, with weighted mean values and respectively. We also expect to observe a correlation between and , especially for the low- Mg/Fe ii systems (see Fig. 2a). This expectation is confirmed in the simulations below. However, no such correlation is observed in our quasar data. Therefore, the data themselves suggest a negligible effect on due to atmospheric dispersion effects.
Nevertheless, we used the atmospheric and telescope parameters for each quasar observation to model the potential effect of atmospheric dispersion on . The angular separation of two wavelengths entering the slit is determined by the refractive index of air at the telescope (which depends on temperature, pressure and relative humidity). The slit angle with respect to the vertical, , is equal to for the pre-rotator Keck/HIRES. We applied the resulting wavelength shifts to a high S/N simulation of our data and determined , giving a correction which we apply to the values measured from the quasar spectra. We compare the corrected values of with the uncorrected values in Fig. 1c. Overall, our model of atmospheric dispersion has an opposite effect on the low- systems compared to the high- systems: it can not explain the observed deviation from . Once we apply the correction, the apparent evolution of with look-back time is enhanced.
3 Isotopic ratio evolution
Mg, Si, Cr, Fe, Ni and Zn have several stable isotopes and so the transitions used in the MM method will have unresolved isotopic structure. However, only the isotopic structures of the Mg lines have been determined experimentally [Hallstadius (1979), Drullinger et al. (1980)]. The Mg and Si transitions involve similar energy levels and so, in \inlineciteMurphyM_01b, we estimated their isotopic structure by scaling the Mg ii 2796 structure by the mass isotopic shift. We fitted the Mg and Si absorption lines with these isotopic structures using the terrestrial values of the isotopic abundances [Rosman and Taylor (1998)]. However, Galactic observations of Mg [Gay and Lambert (2000)] and theoretical models of Si [Timmes and Clayton (1996)] in stars strongly suggest that only the 24Mg and 28Si isotopes will exist in quasar absorption clouds with significant abundances. Fig. 1b illustrates the effect this would have on a measured Mg i 2852 absorption line position (the isotopic separations are exaggerated by a factor of 25).
To obtain an upper limit on the effect of isotopic ratio evolution on , we refit the Mg and Si transitions using only the 24Mg and 28Si isotopes, i.e. zero abundances of 25,26Mg and 29,30Si in the absorption clouds. We compare these new, corrected values of with the uncorrected values in Fig. 1c (middle panel). As expected, the potential effect is most prominent in the low- Mg/Fe ii systems. Note that is more negative after the correction: isotopic ratio evolution can not explain our results. Although the isotopic structures of the other transitions in our analysis are not known, they should be more compact since the mass isotopic shift is inversely proportional to the square of atomic mass. The line removal test described below largely rules out such strong effects.
4 Line removal tests
A non-zero manifests itself as a distinct pattern of line shifts (Fig. 2a). Thus, with a large set of fitted transitions, one or more transitions can be removed from a given system and will remain well-constrained. In the absence of systematic errors associated with the transition removed or with the wavelength scale of the quasar spectra, should not change systematically for all systems. For example, removing a single transition (e.g. Mg ii 2796) from our fits to the quasar data directly probes possible systematic errors due to line blending, isotopic/hyperfine structure effects and errors in the laboratory wavelengths. Removing entire species (e.g. all transitions of Si ii) also tests for isotopic/hyperfine structure effects.
Given a set of fitted transitions, we only remove transitions that can be removed. To clarify this, consider removing Mg ii 2796 (Fig. 2b). For the low- Mg/Fe ii systems, a well-constrained value of can only be obtained when at least one Mg line is fitted since the difference between the coefficients for the various Fe ii transitions is small (see Fig. 2a). If the only available anchor line is Mg ii 2796 then we can not remove it from the system. Similarly, we only remove the entire Mg ii species if the Mg i 2852 line is fitted.
In Fig. 2c we present line removal results for all transitions and species. The left panel shows the overall effect line removal has on the systems where line removal is possible (cf. upper panel of Fig. 2b). The right panel shows the effect on the entire sample (cf. lower panel of Fig. 2b). We see no evidence for systematic errors associated with particular transitions or species.


5 Conclusions
We have extended our previous analysis of systematic errors [Murphy et al. (2001b)] to include the new, significantly augmented sample of 128 absorption systems outlined in \inlineciteMurphyM_02a and \inlineciteWebbJ_03b. We cannot explain the observed value of with known systematic errors. Here we have outlined our analysis of the two most important of these: atmospheric dispersion effects and possible isotopic ratio evolution. The former is an instrumental effect that should have affected 77 of the 128 absorption systems. However, the data themselves suggest that atmospheric dispersion had a negligible effect on . Furthermore, modelling indicates that the resulting low-order distortion of the wavelength scale should have shifted the low- and high- values of in opposite senses, clearly at odds with our observations. An upper limit on the effect on of strong isotopic ratio evolution was obtained by assuming zero isotopic abundances for 25,26Mg and 29,30Si in the quasar absorption clouds. Although the isotopic structures of the other transitions used in the MM method are not known, strong isotopic ratio evolution for these elements is strongly constrained by the line removal test (Fig. 2c).
All 128 absorption systems were observed with the Keck/HIRES. Although we have ruled out many instrumental systematic errors, independent measurements of must be carried out with a different telescope and spectrograph. Using the MM method to analyse VLT and Subaru spectra will be a crucial check on possible systematic errors.
References
- Drullinger et al. (1980) Drullinger, R. E., Wineland, D. J. and Bergquist, J. C.: 1980, Appl. Phys. 22, 365.
- Dzuba et al. (2002) Dzuba, V. A., Flambaum, V. V., Kozlov, M. G. and Marchenko, M.: 2002, Phys. Rev. A 66, 022501.
- Gay and Lambert (2000) Gay, P. L. and Lambert, D. L.: 2000, Astrophys. J. 533, 260.
- Hallstadius (1979) Hallstadius, L.: 1979, Z. Phys. A 291, 203.
- Murphy et al. (2001b) Murphy, M. T., Webb, J. K., Flambaum, V. V., Churchill, C. W. and Prochaska, J. X.: 2001b, Mon. Not. Roy. Soc. 327, 1223.
- Murphy et al. (2002) Murphy, M. T., Webb, J. K., Flambaum, V. V. and Curran, S. J.: 2002, astro-ph/0209488.
- Murphy et al. (2001a) Murphy, M. T., Webb, J. K., Flambaum, V. V., Dzuba, V. A., Churchill, C. W., Prochaska, J. X., Barrow, J. D. and Wolfe, A. M.: 2001a, Mon. Not. Roy. Soc. 327, 1208.
- Rosman and Taylor (1998) Rosman, K. J. R. and Taylor, P. D. P.: 1998, J. Phys. Chem. Ref. Data 27, 1275.
- Timmes and Clayton (1996) Timmes, F. X. and Clayton, D. D.: 1996, Astrophys. J. 472, 723.
- Webb et al. (2003) Webb, J. K., Murphy, M. T. and Flambaum, V. V.: 2003, in: C. J. A. P. Martins (ed.): The cosmology of extra dimensions and varying fundamental constants, Netherlands, Kluwer.
- Webb et al. (2001) Webb, J. K., Murphy, M. T., Flambaum, V. V., Dzuba, V. A., Barrow, J. D., Churchill, C. W., Prochaska, J. X. and Wolfe, A. M.: 2001, Phys. Rev. Lett. 87, 091301.