Ahmedabad – 380 009, India
email: orion, ashok@prl.ernet.in
Near Infra-red Spectroscopy of V838 Monocerotis
Abstract
Near - IR, multi - epoch, spectroscopic and photometric observations of the enigmatic, eruptive variable V838 Mon in the bands are reported. One of unusual features of the spectra is the detection of several strong neutral TiI lines in emission in the band. From the strength of these lines, the mass of the ejected envelope is estimated to be in the range 10-7 to 10-5 ⊙. The spectra also show the strong presence of the first and second overtone 12CO bands seen in the and bands. The CO bands show a complex evolution. Deep water bands at 1.4 m and 1.9 m are also seen later in the object’s evolution. Blackbody fits to the photometric data show that V838 Mon has evolved to temperatures between 2400-2600 K by 130 days after outburst. The spectra at this stage have the general characteristics of a very cool M giant.
Key Words.:
Stars: individual: V838 Mon - Stars: supergiants - Infrared: stars - Stars: novae - Techniques: spectroscopic1 Introduction
The eruptive variable V838 Mon was first reported to be in outburst on 6 January 2002 by Brown (2002). A first maximum ( 9.8) in its lightcurve was reached around 11 January. Subsequently there was a slow steady decline followed by a second strong outburst on 2 February which changed the brightness by 4.3 magnitudes to a peak value of 6.7. The overall evolution of the light curve has thus been complex. The initial spectra of the object in the optical have shown several emission lines, in general having P Cygni profiles, of BaII, LiI and those of several process elements (Munari et al. 2002a). However, the most striking development was the detection of an expanding light echo around the object seen most clearly in band images (Munari et al. 2002a). Being a rare phenomenon, this heightened interest in an already puzzling object, resulting in several IAU circulars on the subject and also warranting special Director’s Discretionary Time allocation on the HST (Bond et al. 2002). The light echo seems to be caused by scattered light from dust shells which existed even before the outburst. This is supported by the fact that the progenitor of V838 Mon was detected by IRAS in the 60 and 100 m bands indicating the presence of low temperature dust. In this work, we present results from observations of V838 Mon which have been made at five, fairly evenly-spaced epochs and which should help in following the temporal evolution and understanding the nature of V838 Mon - questions of considerable importance and interest at present.
2 Observations
Near-IR spectra at a resolution of 1000 were obtained at the Mt. Abu 1.2m telescope using a Near Infrared Imager/Spectrometer with a 256256 HgCdTe NICMOS3 array. We present here the spectroscopic observations of five days viz. 2 February, 25 March, 9 April, 2 May and 14 May 2002. It may be noted that the 2 February spectra were acquired between 2.729 - 2.762 UT and coincide with the time when the second outburst of V838 Mon was just underway as indicated by VSNET reports. VSNET reports, centered around the second outburst, give photometric values of = 10.67, 10.708, 8.193 and 8.02 at epochs of February 1.487, 1.858, 2.799 and 2.913 UT from which an idea can be obtained when the outburst began. In each of the and bands a set of at least two spectra were taken and sometimes as many as ten. In each set the star was offset to two different position of the slit (slit width 2 arc sec. ). The signal to noise ratio of the spectra, as determined using IRAF, is moderate and ranges between 30 - 50 in , 30 - 60 in and 30 - 80 in the band. The exposure times for the spectra presented here are as follows (given in order of and ): 2 Feb - 120, 90, 90s; 25 March - 15, 10, 15s; 9 April - 15, 10, 15s; 2 May - 120, 45, 45s and 14 May - 120, 60, 60s. Spectral calibration was done using the OH sky lines that register with the spectra. The comparison stars that were used for ratioing the spectra, were either HR 2714 or HR 3314 in all cases. The spectra of the comparison stars were taken at similar air-mass as that of V838 Mon and the ratioing process thereby removes the telluric lines.
Photometry in the bands was done on 3 and 14 May using the NICMOS3 array, mentioned above, in the imaging mode. A large number of dithered frames in 4 positions offset by 30 arcsec were obtained in all the filters. The times for all the individual frames ranged between 70 and 250ms. The sky frames were generated using these dithered frames. The mean air-mass at the time of observations for V838 Mon was 1.79 on 3 May and 2.04 on 14 May. HR 2714 ( Mon, = 4.15, spectral type A2V) was used as the standard star on both the days and observed soon after V838 Mon at similar airmasses. The atmospheric extinction corrections were done using average values of J = 0.15, H = 0.15 and K = 0.1 mag for the Mt. Abu observatory site. The adopted magnitudes for HR 2714 ( = 4.06, = 4.03, = 4.02) were calculated from the colors of an A2V star as given by Koornneef (1983). The near-IR photometric and spectroscopic data were all reduced using IRAF.
3 Results
3.1 Near-IR band spectra
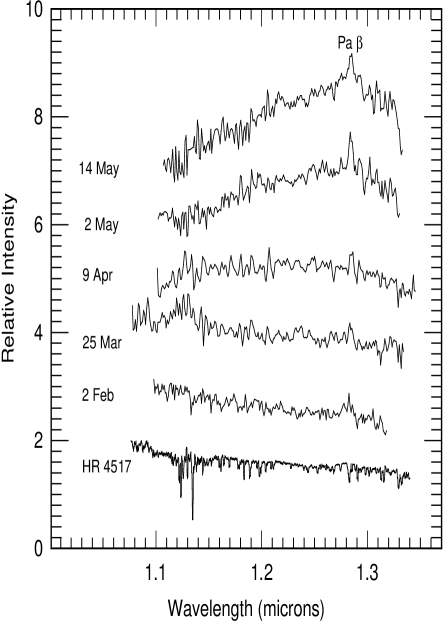
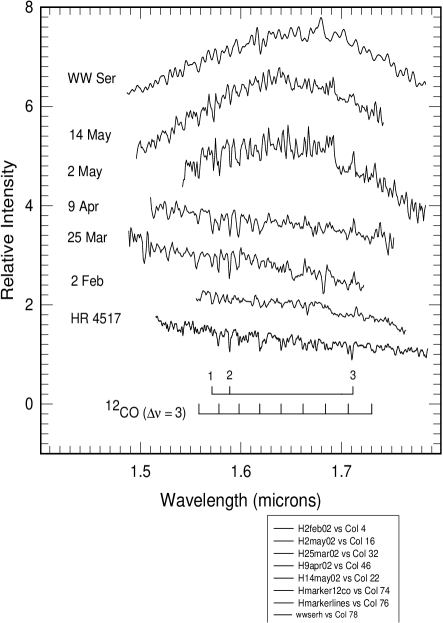
The spectra are shown in Figs. 1, 2 and 3. We first discuss the spectral
features that are observed and later discuss the shape of the
continuum in the bands. We have compared our spectra, with the aim of
classification and line identification, with the spectral classification
catalogs of spectra compiled by Meyer et al. (1998),
Wallace & Hinkle (1997), Lancon & Roca-Volmerange (1992), Wallace et al.
(2000)
and Forster Schreiber (2000). The spectra from some of these last-mentioned
references are available in electronic form from the ADC & CDS data centers
and also from the site http://www.noao.edu/archives.html.
To guide the reader in interpretation/comparison of our observed data,
we have added two reference spectra to Figs. 1, 2 and 3
- one at the bottom and the other at the top. The selected comparison
spectra of HR 4517 (spectral type M1 III) and WW Ser (M8 III) are close to
the spectral type of V838 Mon as on 2 February and 14 May. However it
was not possible to add a comparison band spectra for 14 May
because V838 Mon had cooled to spectral class M8 or 9 by then and similar
comparison spectra were not available. It must be pointed out that the
spectra of HR 4517 in Figs. 1, 2 and 3 have been
smoothed by a seven point moving average to degrade them somewhat from a higher
resolution (R = 3000) to a comparable resolution as our observations.
Further the slope of the and band spectra of HR 4517 have been
tilted to match those of
our spectra because in the original data the spectra had been normalized to be
flat. The slope correction does not alter the spectral features at all and
the moving-average smoothing ( instead of a convolution with the instrument
function) should adequately serve the primary purpose of enabling a comparison
between spectral features. The spectra for WW Ser, which are from Lancon &
Roca-Volmerange (1992) are at a resolution of 500.
In the Band, the only feature which appeared weakly but persistently in emission is Paschen beta at 1.2818 m. We give the equivalent widths for this line in case they can be used in conjunction with other Hydrogen line data (obtained in other studies) to study some properties of V838 Mon ( for e.g. interstellar extinction towards it). The measured equivalent widths are 2.7, 5.0, 5.9, 8.3 and 6.9 on 2 February, 25 March , 9 April, 2 May and 14 May respectively. The errors in measurement typically lie between 10 to 20 percent of the measured values. The band spectra show a multitude of spectral features which are rather characteristic of the spectrum of cool M type giant stars. Some of the principal spectral features listed by Meyer et al. (1998) which characterize the band spectra of stars are also seen here. Among these are the second overtone 12CO ( 3) bands whose positions are marked in Fig. 2. Although weak, the = 3-0 (1.558 m), 4-1 (1.578 m), 5-2 (1.598 m) and 6-3 (1.619 m) bands are consistenly seen. The positions of the higher vibrational transitions are also marked in the diagram but they are not clearly present in the data. Three other features (marked 1, 2, and 3 in Fig. 2) are also persistent. Feature 1 at 1.5711 m could be the HI Brackett 15 line while feature 2 at 1.5892 m is attributable to SiI (Forster Schreiber 2000). Feature 3 is seen in emission at all phases and although it coincides well with the position of MgI 1.7113 m it is expected to be in absorption had it been due to MgI (Meyer et al. 1998). The spectra in the band, in general, resemble those of later M type giant stars, but not completely. However it must be pointed out that the spectra of V838 Mon is a superposition of photospheric absorption lines and also emission lines from the ejecta and their coaddition can cause deviations from standard stellar spectra.
3.2 TiI lines and the mass of the envelope
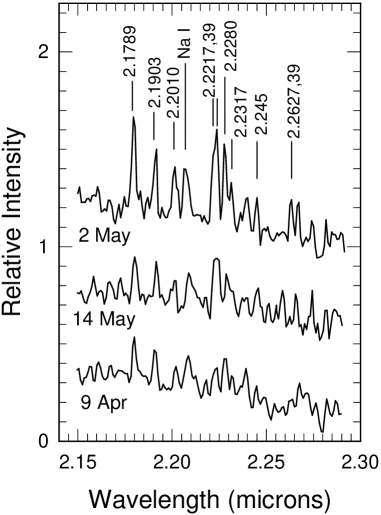
The band spectra have two striking features. The first of these are several emission lines seen around 2.2 m which were first visible on 9 April, peaked in strength on 2 May and again weakened by 14 May . A magnified section around these lines is shown in Fig. 4. The preliminary indication that they could be due to TiI was their presence in absorption, at similar wavelengths, in the high resolution spectra of Arcturus ( Hinkle et al. 1995). We believe these lines are due to neutral Titanium (Banerjee & Ashok 2002) after having matched the observed wavelengths of these lines with the laboratory spectrum of TiI as given by Forsberg (1991). It is quite remarkable that all the significantly strong lines listed by Forsberg (1991) in the band appear in our spectrum. The laboratory wavelengths of these lines are marked in Fig. 4. As can be seen there is a good match. The intensities of the lines also match fairly well the intensities given by Forsberg (1991). We therefore feel the identification is secure. The detection of TiI emission lines in the band is certainly rare in eruptive variables or even in astronomical objects - in fact it’s unclear whether these lines have ever been seen before and their presence adds to the mystery of V838 Mon. Being in emission, they cannot be of photospheric origin (not in a cool object) and must therefore arise from the circumstellar ejecta. Except for the 2.2627 m line which arises from a transition between the 3G4 - 3F4 levels of the 33(2G)4 - 32(3F)44(3P) configuration, all the other lines arise from transitions between different levels (not listed here) of the 33(4P)4 - 32(3F)44(3P) configuration. The excitation energies for the lower levels of all the TiI lines shown in Fig. 4 range between 1.734 to 1.749 ev except for the 2.2639 m for which it is 1.879 ev (the ionization potential of TiI is 6.83 ev). Thus all these lines emanate from low-lying energy levels vis-a-vis the ground state and suggest that they may be collisionally excited in a low temperature gas. The heating of the gas is likely to be caused by the mass outflow from V838 Mon during the present outburst impinging on pre-existing matter. The indication for such pre-existing matter is suggested from the light-echo and the evidence for a mass outflow from V838 Mon is confirmed by the strong P-Cygni profiles seen in its optical spectra. The above mechanism of excitation can also be the cause for the NaI doublet at 2.2056 m and 2.2084 m, which appear blended into a broad feature (marked in Fig. 4) and for which the lower level excitation energy is 3.19 ev. From Forsberg’s (1991) line list, 3 other lines of TiI are also expected to be seen at 2.2896, 2.2970 and 2.3348 m. However the position of these lines coincide with the locations of the deep 12CO bands observed and hence their presence can be masked. There are certain other features which remain unidentified in the band. Among these is a cluster of five closely spaced emission lines at 2.0325, 2.0374, 2.0427, 2.0483 and 2.0515 m which are weak but clearly seen in both the 2 and 14 May spectra. It may be pointed out that at these line positions there are no matching lines (unlike the TiI lines) in the Arcturus spectral atlas (Hinkle et al., 1995).
From the observed strength of the TiI lines we estimate the amount of TiI in the ejecta and from this calculate the mass of the shell. The observed luminosity in an individual TiI line is first calculated which will be given by:
| (1) |
where is the observed equivalent width of the line (in Angstroms) and is the distance to V838 Mon. is the observed continuum flux in ergs/cm2/s/ at the line center. Since the TiI lines are situated close to the band center (2.2 microns), the observed band magnitude of V838 Mon has been used for all the lines to calculate the flux . Photometric results of the band magnitudes which are used here are presented later.
If the line originates in a downward transition from level 2 to 1 then, line is also given by:
| (2) |
where 2 is the number density of TiI atoms in the excited state 2, is the total number density of the TiI atoms, 21 is the Einstein coefficient of spontaneous emission, is the energy of the emitted photon and is the volume of the emitting gas.
By equating Eq. (2) to Eq. (1) the number of TiI atoms in the shell ( equal to ) can be found.The two unknown quantities of Eq. (2) viz. 21 and 2/ are found as follows. The value of 21 for any particular line is given by
| (3) |
| (m) | (Å) | log() | 2 | E1(cm-1) | E2(cm-1) | ||||||||||||||||||||
|---|---|---|---|---|---|---|---|---|---|---|---|---|---|---|---|---|---|---|---|---|---|---|---|---|---|
| 2.1789 | 8.06 | -1.161 | 9 | 14105.68 | 18695.23 | 0.43 | |||||||||||||||||||
| 2.1903 | 5.88 | -1.449 | 7 | 14028.47 | 18593.99 | 0.59 | |||||||||||||||||||
| 2.2010 | 4.86 | -1.877 | 5 | 13981.75 | 18525.07 | 1.30 | |||||||||||||||||||
| 2.2217 | -1.77 | 3 | 13981.75 | 18482.86 | |||||||||||||||||||||
| 2.2239 | 23.81 | -1.658 | 5 | 14028.47 | 18525.07 | 1.361 | |||||||||||||||||||
| 2.2280 | -1.756 | 7 | 14105.68 | 18593.99 | |||||||||||||||||||||
| 2.2317 | -2.124 | 1 | 13981.75 | 18462.83 | |||||||||||||||||||||
| 2.245 | 2.83 | -2.251 | 3 | 14028.47 | 18482.86 | 1.87 | |||||||||||||||||||
| 2.2627 | 2.022 | -2.607 | 5 | 14105.68 | 18525.07 | 2.292 | |||||||||||||||||||
| 2.2639 | -2.85 | 9 | 15156.79 | 19573.97 |
where is the weighted oscillator strength for the transition, 2 is the statistical weight of level 2 ( equal to 2 + 1) and is the wavelength in microns. The log() and 2 values for all the TiI lines observed here have been listed in a compilation by Kurucz (http://kurucz.harvard.edu/linelists.html) and these values have been used to determine 21. To estimate 2/ we make the assumption that the gas is in local thermal equilibrium and therefore the population of atoms in different excited levels can be described by a Boltzmann distribution i.e.
| (4) |
where is the partition function, is the temperature of the gas and 02 is the energy difference between the ground state and level 2. The energy level values for the different states have been taken from Kurucz’s line list. The partition function values, for different temperatures, have been taken from Allen (1976) and Aller (1963).
The number of TiI atoms in the shell, as computed from Eqs. (1) to (4), is listed in Table 1 along with some of the other relevant parameters needed in the calculations. The values in Table 1 are for the 2 May 2002 observations when the TiI lines were strongest and the signal-to-noise ratio in the continuum was about 50. To reduce errors in the measured equivalent widths, an average was measured from at least two (at times four) different spectra. However, as can be seen from Fig. 4, the 2.2217, 39, 80 and 2.2317 lines are blended ( blend 1 ) and so also the 2.2627 & 2.2639 lines (blend 2) and so the individual equivalent widths cannot be measured. To calculate for these lines is still possible by the following method. The combined equivalent width of blend 1 and 2 was measured separately. The line luminosity corresponding to this combined equivalent width for a blend ( as calculated from Eq. (1)) will be equal to the summation of the right hand side of Eq. (2) for all the blended lines in the group. Thus an average for the blended lines can be determined. The equivalent widths for the blend 1 and 2 lines in Table 1 is therefore the combined equivalent width. In the calculations we have adopted a value of = 790 pc (Munari et al., 2002a), = 3600 K and = 23 ( for T = 3600 K). The temperature of the shell is not known, but is possibly low, in the range 3000 to 5000 K. Such a possibility is indicated because, as mentioned earlier, the TiI lines are all low excitation lines. Secondly the presence of CO which is seen in emission in the band (discussed subsequently) is generally associated with this temperature range.
From Table 1 it is seen that , as derived from the different lines, is reasonably consistent with a variation of 5 among the individual values. We use a mean value of = 1.31 for calculating an important parameter viz. the mass of the shell. Assuming that the and abundances in the shell are adequately represented by cosmic abundances (Allen, 1976), the mass of the ejecta shell can be determined. This is found to have a value shell = 1.110-6 ⊙. Similar calculations, as described above, have been computed for different temperatures yielding a shell mass ranging between shell = 1.6710-5 to 1.710-7 ⊙ for a variation in the temperature between = 2600 to 5000 K respectively. Within the uncertainties of the parameters used, a reasonable constraint for the shell mass would be in the range between 10-7 to 10-5 ⊙. The derived value of shell compares reasonably well with lower values of envelope masses determined for novae. In novae an average value of shell = 10-5 ⊙ can be taken though deviations by more than an order of magnitude (on both lower and higher side) are often seen (Williams 1994). It may be noted that shell derived here may be underestimated because we have assumed that the TiI emission originates entirely from the matter ejected in the present eruption and not from any pre-existing material. Further, even if the TiI emission arises only from the ejected material, it could be arising only from a fraction of it. Thus the shell mass may be underestimated and this may be borne in mind while trying to classify V838 Mon into known categories of eruptive variables - an aspect which is discussed later in Sect. 4.
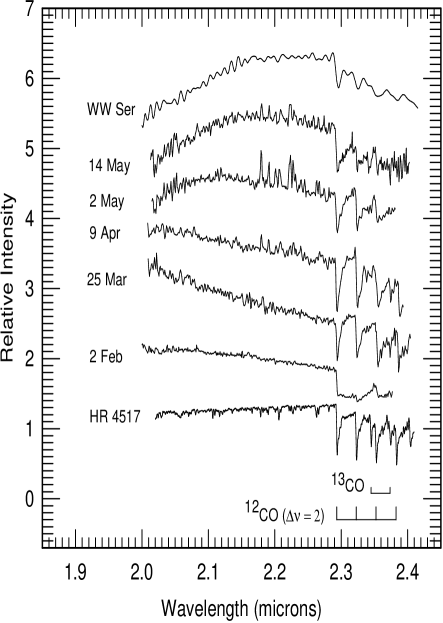
3.3 CO Bands
The other prominent feature of the band spectra are the 12CO bands. As shown in Fig. 3, the first overtone 12CO ( 2) bands are seen very strongly in V838 Mon along with the weaker 13CO ( 2) bands. The presence of these CO bands was first seen on 12 January ( Geballe et al. 2002a). The 12CO bands show a complex evolution with time. In the 2 February spectra, recorded at around the time of the massive second outburst, the 2-0 band has a deep drop at the 2.293 m bandhead but then does not rise back to the continuum level. Instead it levels off till the 3-1 band head is encountered. We have verified this in both the spectra we have of this epoch. Although the reason for such a behavior is not too clear to us, a tentative explanation for this leveling could be that the individual rotational lines of the R branch which makeup the band are deeply saturated. Another unusual aspect is that the 25 March, 9 April and 2 May spectra show a raised emission plateau between the bands - a fact first noticed in the 9 March observations of Geballe et al. (2002b). This implies that there is an emission component in the CO also. Such emission is generally seen in post-AGB stars and is attributable to mass loss (Oudmaijer et al., 1995). High resolution (R = 50,000) FTS spectra of 13 February by Hinkle et al. (2002) show the individual rotational lines of the 12CO 2-0 band to have a nominal heliocentric velocity of -10 km/s. Such a small radial velocity would imply that the deep absorption component of the 12CO bands are likely to be photospheric. The additional emission component must therefore arise from the circumstellar ejecta. It is therefore seen that the CO band structure in V838 Mon is multicomponent and rather complex and needs to be modeled carefully. Such a model can try to determine factors such as the excitation temperature of the different CO components, the isotopic ratio of 13C/12C in V838 Mon ( the solar value is 1:90 ) and also the kinematics of the ejected matter.
3.4 Near Infrared photometry
Finally, we use our photometry results to discuss the evolution of V838 Mon as seen from the shape of its near-IR continuum. The details of the photometry are given in Table 2.
| Obs. date (UT) | |||
|---|---|---|---|
| 3.614 May 2002 | 5.15 0.14 | 4.16 0.15 | 3.63 0.14 |
| 14.604 May 2002 | 5.43 0.04 | 4.43 0.07 | 3.72 0.03 |
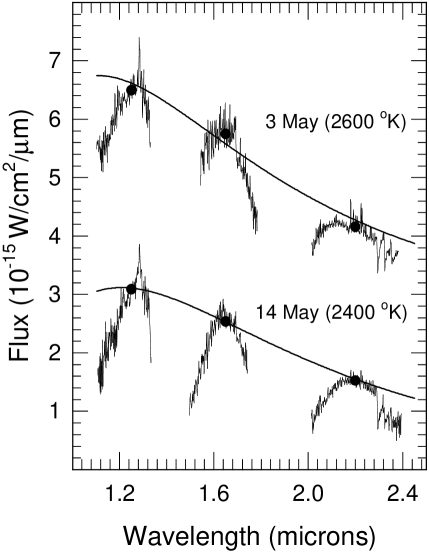
The value for V838 Mon is uncertain and lies between 0.25 to 0.8 ( Munari et al. 2002a). Following Munari et al. (2002a), we have adopted a midpoint value of 0.5. We have used Koornneef’s (1983) relations viz. V 3.1, J 0.265 V, H 0.155 V and K 0.090 V to correct for interstellar extinction. Absolute flux calibration was done by adopting zero magnitude fluxes from Koornneef (1983). The broad band fluxes from V838 Mon are shown in Fig. 5 as filled circles. These broad band fluxes were fitted by black body curves. Different black body curves generated for temperature increments of 100 K were tried - the best fit was decided by least squares minimization of the deviation. Black body fits of 2600 and 2400 K are seen to fit the data reasonably well for the 3 and 14 May data respectively. A temperature of 2600 K for 3 May is identical with the findings of Munari et al. (2002b) at around the same time. The overall temporal evolution of V838 Mon since outburst has been towards cooler temperatures. This is confirmed by a large body of photometric data as given by Munari et al. (2002a, b) and also from reports in several IAU circulars. We have superposed the spectra of 2 and 14 May in Fig. 5 so as to juxtapose them side by side. This enables to highlight the strong dips seen in the spectra of 2 and 14 May between the & and the & bands. However in doing so, we assume that errors caused by applying photometric data of 3 May to the spectra of 2 May are marginal because of the small time-difference involved. The strong absorption bands between the near-IR bands is attributed to water vapor in V838 Mon which if present in the atmospheres of cool stars is known to cause deep and broad absorption features at 1.4 m and 1.9 m ( Lancon & Rocca-Volmerange 1992; Terndrup et al. 1991). These absorption features are seen to be most prominent in giant stars even cooler than M5 (Lancon & Roca-Volmerange 1992). However, an additional factor that could enhance the band hump is the H- ion which has an opacity minimum at 1.6 m. It must be mentioned that a slightly elevated band continuum near 1.6 m was also seen during the 26 January observations of Lynch et al. (2002).
4 Discussion
From the near-IR data it is thus seen that V838 Mon, near 130 days after outburst, shows an energy distribution similar to a very cool M-type giant. However, many of the spectral features seen here like the TiI lines and the structure of the CO bands are markedly different. In many of the IAU circulars issued on V838 Mon, the exact nature of the object has been debated. Munari et al. (2002a) have dubbed the object’s outburst as ‘mysterious’ and have summarized the difficulties in classifying it within the existing categories of eruptive variables. Apart from the similarities and differences brought out by Munari et al. (2002a, b), we see what light our near IR data can shed on this issue. The spectra of V838 Mon are certainly different from those of classical novae. First the Hydrogen Brackett series lines are not seen and Paschen beta is much weaker in strength than expected. OI emission lines in the near-IR ( for example the 1.1287 and 1.3166 m lines), another common feature of novae spectra, are also not present. Further, we are not aware of CO bands being seen in absorption in novae - in emission they are seen but rarely (for e.g. Evans et al. 1996). Classical novae also evolve towards higher stages of ionization with time ( the nebular and coronal phases) but there is no indication of such an evolutionary trend here.
V838 Mon does not also fit easily into the scenario of a born again AGB star like FG Sge, V605 Aql and Sakurai’s object. Most of the discrepancies that arise in such a scheme are given by Munari et al. (2002a) including the fact that the rise to maximum is too fast in comparison with known cases. To this we add that not only the rise time, but also the decline time of V838 Mon is much faster than the known cases. For the rise and decline timescales, the reader may refer to Duerbeck et al. (2000) for Sakurai’s object, Harrison (1996) for V605 Aql and Fig. 1 of Blocker & Schonberner (1997) for FG Sge.
Bond et al. (2002) have proposed that the closest resemblance of V838 Mon is to a red variable star (M31 RV) that erupted in M31 (Rich et al. 1989; Mould et al. 1990). This view is shared by Munari et al. (2002a) who also cite the outburst of V4332 Sgr (Martini et al. 1999) as being similar to the present case and propose that V838 Mon, M31 RV and V4332 Sgr belong to a new genre of astronomical objects. Unfortunately there is no near-IR spectroscopic data for either M31 RV or V4332 Sgr with which we can compare our spectra to check for similarities. However, there is a point of dissimilarity between M31 RV and V838 Mon that arises from our data. As mentioned earlier, in the case of V838 Mon an envelope mass of 10-7 to 10-5 ⊙ was found - a value comparable to novae shell masses. In the the case of M31 RV the mass of the ejected shell is estimated to be much higher i.e in the range of 0.1 to 0.001 ⊙. These figures are arrived at by assuming equipartition between the kinetic energy of the shell and the total radiative energy i.e by equating the total energy of 1046 ergs radiated in the first 100 days (Mould et al. 1990) to the kinetic energy of the shell computed for expansion velocities in the range 100 - 500 km/s. Iben & Tutukov (1992) have modeled M31 RV in the scenario of a very cold white dwarf accreting matter at a very slow rate from its binary companion and show that under such conditions thermonuclear runaway will not take place until the accreted mass is much larger than in models which represent the novae phenomenon. As a result larger envelope masses and outburst luminosities are predicted - as is found in the case of M31 RV. How V838 Mon fits into such a model needs to be addressed and worked out. Other similarities and differences between V838 Mon, M31 RV and V4332 Sgr have been brought out by Munari et al (2002a) and Martini et al. (1999). Based on such comparisons, there is a fair possibility that all three objects belong to a new class of astronomical objects.
Acknowledgements.
The research work at Physical Research Laboratory is funded by the Department of Space, Government of India. We thank Varricatt W.P. of Joint Astronomy Centre, Hawaii for help in photometric reductions. We thank the anonymous referee whose constructive comments helped improve the paper. This work has made use of data available from the ADC and CDS data centers and also from data available at the following websites viz. http://www.noao.edu/archives.html, http://kurucz.harvard.edu/linelists.html and http://www. kusastro.kyoto-u.ac.jp.vsnet.References
- (1) Allen C.W. 1976, Astrophysical Quantities (Athlone Press, London and Dover)
- (2) Aller L.H. 1963, The Atmospheres of the Sun and Stars (Ronald Press, New York)
- (3) Banerjee D.P.K., & Ashok N.M. 2002, IAU Circ. 7914
- (4) Blocker T., & Schonberner D. 1997, A&A 324, 991
- (5) Bond H.E., Panagia N., Sparks W.B., Starrfield S.G., & Wagner R.M. 2002, IAU Circ. 7892
- (6) Brown N.J. 2002, IAU Circ. 7785
- (7) Duerbeck H.W., Liller W., Sterken C. et al. 2000, AJ 119, 2360
- (8) Evans A., Geballe T.R., Rawlings J.M.C., & Scott A.D. 1996, MNRAS 282, 1049
- (9) Forsberg P. 1991, Phys. Scr. 44, 446
- (10) Forster Schreiber N.M 2000, AJ 120, 2089
- (11) Geballe T.R., Evans A., Smalley B., Tyne V.H., & Eyres S.P.S. 2002b, IAU Circ. 7855
- (12) Geballe T.R., Eyres S.P.S., Evans A., & Tyne V.H. 2002a, IAU Circ. 7796
- (13) Harrison T.E. 1996, PASP 108, 1112
- (14) Hinkle K., Joyce R., Wallace L., & Rodgers B. 2002, IAU Circ. 7834
- (15) Hinkle K., Wallace L., & Livingston W. 1995, Infrared Atlas of the Arcturus Spectrum, 0.9-5.3 m (A.S.P., San Francisco)
- (16) Iben I. Jr, & Tutukov A.V. 1992, ApJ 389, 369
- (17) Koornneef, J. 1983, A&A 128, 84
- (18) Lancon A., & Rocca-Volmerange B. 1992, A&AS 96, 593
- (19) Lynch D.K., Rudy R.J., Mazuk S., & Venturini C. 2002, IAU Circ. 7829
- (20) Martini P., Wagner R., Tomaney A. et al. 1999, AJ 118, 1034
- (21) Meyer M.R., Edwards S., Hinkle K.H., & Strom S.E. 1998, ApJ 508, 397
- (22) Mould J., Cohen J., Graham J.R. et al. 1990, ApJ 353, L35
- (23) Munari U., Henden A., Corradi R.M.L., & Zwitter T. 2002b, to appear in the Conf. Proc. of Classical Nova Explosions, ed M. Hernanz & J. Jose (A.I.P) [astro-ph/0207088]
- (24) Munari U., Henden A., Kiyota S. et al. 2002a, A&A 389L, 51
- (25) Oudmaijer R.D., Waters L.B.F.M., vander Veen, W.E.C.J., & Geballe T.R. 1995, A&A 299, 69
- (26) Rich R.M., Mould J., Picard A., Frogel J.A., & Davies R. 1989, ApJ 341, L51
- (27) Terndrup D.M., Frogel J.A., & Whitford A.E 1991, ApJ 378, 742
- (28) Wallace L., & Hinkle K. 1997, ApJS 111, 445
- (29) Wallace L., Meyer M.R., Hinkle K., & Edwards S. 2000, ApJ 535, 325
- (30) Williams R.E. 1994, ApJ 426, 279