The Universe Was Reionized Twice
Abstract
We show the universe was reionized twice, first at and second at . Such an outcome appears inevitable, when normalizing to two well determined observational measurements, namely, the epoch of the final cosmological reionization at and the density fluctuations at , which in turn are tightly constrained by Ly forest observations at . These two observations most importantly fix the product of star formation efficiency and ionizing photon escape fraction from galaxies at high redshift. The only major assumption made is that the initial mass function of metal-free, Population III stars is top-heavy.
To the extent that the relative star formation efficiencies in gaseous minihalos with cooling and large halos with atomic cooling at high redshift are unknown, the primary source for the first reionization is still uncertain. If star formation efficiency in minihalos is at least 10% of that in large halos, then Pop III stars in the minihalos may be largely responsible for the first reionization; otherwise, the first reionization will be attributable largely to Pop III stars in large halos. In the former case, cooling in minihalos is necessarily efficient. We show that gas in minihalos can be cooled efficiently by molecules and star formation can continue to take place largely unimpeded throughout the first reionization period, as long as gas is able to accumulate in them. This comes about thanks to two new mechanisms for generating a high X-ray background during the Pop III era, put forth here, namely, X-ray emission from the cooling energy of Pop III supernova blast waves and from miniquasars powered by Pop III black holes. Consequently, formation in the cores of minihalos is significantly induced to be able to counteract the destruction by Lyman-Werner photons produced by the same Pop III stars. In addition, an important process for producing a large number of molecules in relic HII regions of Pop III galaxies, first pointed out by Ricotti, Gnedin, & Shull, is quantified here. It is shown that molecules produced by this process may overwhelm the Lyman-Werner photons produced by stars in the same Pop III galaxies. As a result, the Lyman-Werner background may never build up in the first place during the Pop III era.
The long cosmological reionization and reheating history is complex. From Pop III stars gradually heat up and ionize the intergalactic medium, completing the first reionization at , followed by a brief period of , during which the intergalactic medium stays completely ionized due to sustained ionizing photon emission from concomitant Pop III galaxies. The transition from Pop III stars to Pop II stars at suddenly reduces, by a factor of , ionizing photon emission rate, causing hydrogen to rapidly recombine, marking the second cosmological recombination. From to , Compton cooling by the cosmic microwave background and photoheating by the stars self-regulate the Jeans mass and the star formation rate, giving rise to a mean temperature of the intergalactic medium maintained nearly at constant of K. Meanwhile, recombination and photoionization balance one another such that the intergalactic medium stays largely ionized during this stage with . Most of the star formation in this period occurs in large halos with dominant atomic line cooling.
We discuss a wide range of implications and possible tests for this new reionization picture. In particular, the Thomson scattering optical depth is increased to , compared to for the case of only one rapid reionization at . Upcoming Microwave Anisotropy Probe observation of the polarization of the cosmic microwave background should be able to distinguish between these two scenarios.
1 Introduction
The conventional view is that the universe becomes reionized at some point in the redshift range , when the UV emission rate in galaxies with virial temperatures greater than K (where hydrogen atoms are efficient coolants) exceeds the overall recombination rate (e.g., Barkana & Loeb 2001; Madau 2002). At the time of this writing the redshift range has been narrowed to a point at , as suggested by recent observations of high redshift quasars from the Sloan Digital Sky Survey (SDSS) (e.g., Fan et al. 2001; Becker et al. 2001, Barkana 2001; Cen & McDonald 2002; Litz et al. 2002).
In this paper we present a new scenario. In the context of the standard cold dark matter cosmological model we show that the universe was first reionized at by Population III (Pop III) stars and second reionized at . Following the first reionization, the transition from Pop III stars to Pop II stars occurs. At this point photoionization becomes insufficient to counterbalance the rapid recombination process and the intergalactic medium (IGM) recombines to become opaque to Ly and ionizing photons, again! As time progresses, with increased density fluctuations and the nonlinear mass scale star formation rate gradually picks up. At the global star formation rate exceeds the global recombination rate and the universe is completely reionized for the second time, and for all. From the first cosmological reionization through the second cosmological reionization the mean temperature of the IGM is maintained at K balanced between Compton cooling and photo-heating and hydrogen is more than half ionized balanced between recombination and photoionization.
We show that this new reionization picture is inevitable, as long as Pop III initial mass function (IMF) is top-heavy, thanks to a new, powerful constraint placed on the product of star formation efficiency and ionizing photon escape fraction from galaxies at high redshift, which otherwise would be unknown. This constraint comes from two solid pieces of observations: 1) the universe is required to be reionized at and 2) the density fluctuation in the universe at is well determined by the same small-scale power traced by the observed Ly forest observed at .
While it is clear that the ionizing sources for the second cosmological reionization are stars in large galaxies with efficient atomic line cooling, the ionizing sources for the first cosmological reionization are uncertain to the extent that we do not know what the relative star formation efficiencies in large halos and minihalos are. We define “minihalos” as those whose virial temperature is less than K where only cooling is possible in the absence of metals, and large halos as those with virial temperature above K capable of cooling via atomic lines. We show that, if star formation efficiency in minihalos with cooling is not more than a factor of ten less efficient than in large halos with atomic cooling, then Pop III stars in minihalos may be largely responsible for the first reionization. Conversely, the first reionization may be attributable largely to Pop III stars in large halos.
In order to enable efficient cooling in minihalos it is necessary to maintain an adequate level of molecule fraction within their cores. As is well known, molecules are fragile and easily destroyed by photons in the Lyman-Werner (LW) bands (eV; Field et al. 1966; Stecher & Williams 1967), to which the universe is largely transparent. Primeval molecules have been completely destroyed well before enough ionizing photons are produced to reionize the universe (Gnedin & Ostriker 1997; Haiman, Rees, & Loeb 1997; Tegmark et al. 1997). Therefore, an adequate production rate of molecules is required to counteract the destruction rate to keep fraction at a useful level. A sufficiently high X-ray background at high redshift could serve as a requisite catalyst for forming molecules by deeply penetrating into and generating a sufficient number of free electrons in the cores of minihalos (Haiman, Rees, & Loeb 1996; Haiman, Abel, & Rees 2000; Ricotti, Gnedin, & Shull 2001, RGS hereafter; Glover & Bland 2002).
We put forth two new mechanisms for generating a high X-ray background during the Pop III era. We point out that at Pop III supernova remnants and miniquasars powered by Pop III black holes are efficient X-ray emitters. The much higher density of the interstellar medium at high redshift results in a much more rapid and earlier cooling phase of the supernova blast waves, emitting a large fraction of the cooling energy in X-ray energy (keV). [In contrast, supernova blast waves in the local galaxies are known not to cool efficiently until their temperatures have dropped well below the X-ray regime (e.g., Cox 1972; Chevalier 1974,1982)]. Miniquasars powered by Pop III black holes of mass are expected to emit a large fraction of the radiation in X-rays at keV. The combined X-ray emission from these two sources is sufficient to enable efficient formation and cooling in the cores of minihalo galaxies in the redshift period in question.
In addition, an important process for producing a large number of molecules in relic HII regions of Pop III galaxies is quantified. It is shown that molecules produced by this process may overwhelm the Lyman-Werner photons produced by stars in the same Pop III galaxies. As a result, the Lyman-Werner background may have never built up in the first place during the Pop III era. In combination, we suggest that star formation in gas-rich minihalos can continue to take place largely unimpeded throughout the first reionization period.
The outline of this paper is as follows. Two new sources of X-ray radiation, namely, the Pop III supernova cooling radiation and X-ray emission from miniquasars are quantified in §2. In §3 we quantify the formation in relic HII regions of Pop III galaxies. In §4 we compute in detail the evolution of the IGM from to . We discuss possible implications and significant consequences and tests of this new scenario in §5, and conclude in §6. Throughout a spatially flat cold dark matter cosmological model with , , , km/s/Mpc and is adopted (e.g., Bahcall et al. 2002).
2 X-ray Emission From Pop III Supernovae and Miniquasars, and Molecular Hydrogen Formation in Minihalos
The important role that molecules play in the collapse of gas clouds to form Pop III stars and the initial mass function of Pop III stars have a long history of investigation (Saslaw & Zipoy 1967; Hirasawa, Aizu, & Taketani 1969; Takeda, Sato, & Matsuda 1969; Hutchins 1976; Silk 1977; Hartquist & Cameron 1977; Shchekinov & Edelman 1978; Yoshii & Sabano 1979; Tohline 1980; Carlberg 1981; Lepp & Shull 1984; Yoshii & Saio 1986; Lahav 1986; Stahler 1986; Shapiro & Kang 1987; Uehara et al. 1996; Haiman, Thoul, & Loeb 1996; Padoan, Raul, & Jones 1997; Nakamura & Umemura 1999,2001,2002; Larson 1995,2000; Abel et al. 1998; Abel, Bryan, & Norman 1999,2000,2002; Bromm, Coppi, & Larson 1999, 2002; Fuller & Couchman 2000; Machacek, Bryan, & Abel 2001). Many authors have examined the possibility of Pop III stars in minihalos reionizing the universe (e.g., Couchman & Rees 1986; Fukugita & Kawasaki 1994; Haiman & Loeb 1997) or partially reionizing the universe (e.g., Gnedin & Ostriker 1997; Gnedin 2000a; RGS). The primary difficulty for Pop III stars in minihalos to reionize the universe has by now been realized to be the destruction of molecules by photons in the LW bands produced by the same Pop III stars, long before the completion of reionization process (Gnedin & Ostriker 1997; Haiman, Rees, & Loeb 1997; Tegmark et al. 1997); photodissociation time becomes shorter than the Hubble time when the ionizing radiation intensity at the Lyman limit reaches erg/cm2/sec/hz/sr at the redshift of interest, about three orders of magnitude below what is required to ionize the universe.
With regard to the initial mass function of Pop III stars a new picture is emerging from a number of recent theoretical studies of the collapse of primordial gas clouds at high redshifts, induced by cooling. At redshift primordial gas clouds are shown to collapse to form very massive stars with mass (Abel et al. 2002; Bromm et al. 2002; Nakamura & Umemura 2002). This outcome is basically determined by the Jeans mass of the collapsing cloud, involving a complicated interplay between cooling and fragmentation. For Pop III galaxies at the redshift in question () the initial (i.e., interstellar) gas density is less than the threshold value of cm-3 identified by Nakamura & Umemura (2001,2002) and fragmentation is to occur at low density with fragment mass of . We adopt this new theory for Pop III stars, called Very Massive Stars (VMS). However, we note that the main conclusions drawn in this paper will remain unchanged as long as the initial mass function of Pop III stars is substantially top-heavy (e.g., Umeda & Nomoto 2003).
We point out two new important sources for X-ray emission in this section, capable of creating a high X-ray background at high redshift to enable the formation of enough molecules to induce continuous cooling and star formation in minihalos during the Pop III era.
2.1 X-ray Emission from Pop III Supernova Remnants
We use a simple analytic means to estimate the X-ray emission from Pop III supernova remnants assuming that a spherical supernova blast wave propagates into a uniform-density interstellar medium. A spherically expanding supernova remnant at sufficiently late times follows the simple, adiabatic, self-similar Sedov-Taylor solution (Sedov 1959; Taylor 1950; Shklovsky 1968; Cox 1972; Ostriker & Cowie 1981). Specifically, the shock radius (), shock velocity () and postshock temperature () (for ) obey:
| (1) |
| (2) |
| (3) |
where is the explosion energy in ergs, is the time elapsed since the onset of explosion in yr and is the density of the interstellar medium in cm-3.
The Sedov-Taylor phase ends with a rapid cooling phase, resulting in the formation of a thin dense shell (e.g., Ostriker & McKee 1988). This radiative cooling phase of the shocked gas sets in abruptly approximately when the cooling time is equal to the time elapsed, i.e., when
| (4) |
where hydrogen is assumed in computing the internal energy and the electron density for simplicity (but not for the cooling function ; see below); is the Boltzmann’s constant; is the postshock electron density; is the volume cooling function for a primordial plasma with hydrogen and in helium by mass, taken from Sutherland & Dopita (1993). Since the blast waves of the first generation of supernovae propagate into a primordial gas free of metals, metal cooling is non-existent. More importantly, complex processes due to dust need not to be considered; in particular, X-ray emission would not suffer significantly from dust absorption (Ostriker & Silk 1973; Burke & Silk 1974; Draine & Salpeter 1979; Shull 1980; Wheeler, Mazurek, Sivaramakrishnan 1980; Tielens et al. 1987; Draine & McKee 1993). Combining equations (3,4) and solving for as a function of give results shown in Figure 1, for two cases with and , respectively, where the former may be appropriate for supernovae/hypernovae resulting from very massive Pop III stars (Woosley & Weaver 1982; Ober et al. 1983; Bond et al. 1984; Nakamura et al. 2001; Heger & Woosley 2002) and the latter for present-day normal supernovae.
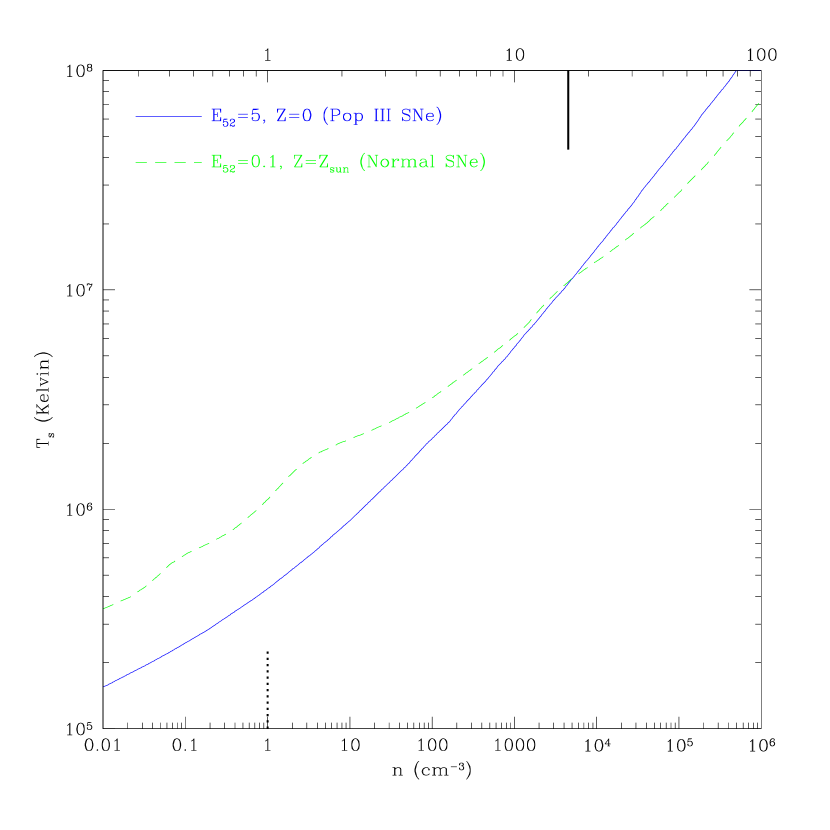
A critical point to note is that the density of the general interstellar medium should scale with , being significantly higher at high redshift than that of the local interstellar medium. This assumption should hold in the context of cosmological hierarchical structure formation for the following reasons. First, the mean gas density scales with . Second, halos at low and high redshift in cosmological simulations show similar properties when density and length are measured in their respective comoving units (e.g., Navarro, Frenk, & White 1997; Del Popolo 2001). Third, the spin parameters (i.e., angular momentum distribution) of both high and low redshift halos have very similar distributions peaking at a nearly identical value (Peebles 1969; White 1984; Barnes & Efstathiou 1987; Ueda et al. 1994; Steinmetz & Bartelmann 1995; Cole & Lacey 1996; Bullock et al. 2001; Cen et al. 2003). Thus, cooling gas in galaxies at low and high redshift should collapse by a similar factor before the structure becomes dynamically stable (e.g., rotation support sets in), resulting in interstellar densities scaling as . Direct simulations (Abel et al. 2000,2002; Bromm et al. 2002) suggest a gas density of cm-3 by the end of the initial free fall for minihalos at , verifying this simple analysis. The same argument was given in Kaiser (1991) on a somewhat larger scale for clusters of galaxies. Peebles (1997), using the same scaling of density with respect to redshift, suggested that an early epoch of galaxy formation may be favored. Observationally, the higher density in bulges of spiral galaxies or elliptical galaxies are consistent with their earlier formation epochs. In Figure 1 we have used , with cm-3 being the density of the local interstellar medium, to translate the bottom x-axis () to the top x-axis ().
In Figure 1 we see that, at (or cm-3), the blast wave enters the rapid cooling phase at a postshock temperature slightly above K. Most of the energy is radiated away during the brief cooling phase (Falle 1975,1981) with photon energy . [Subsequent evolution of the cooling shell will be subject to various instabilities (e.g., Chevalier & Imamura 1982; Vishniac 1983; Bertschinger 1986; Cioffi, McKee & Bertschinger 1988). Following that, the evolution enters snowplow phase driven by the pressure of a still hot interior gas (McKee & Ostriker 1977; Ostriker & McKee 1988).] For a primordial gas cooling at K, it is found that of the instantaneously radiated energy is at photon energies above keV, respectively. Clearly, a significant amount of the total energy of the supernova blast wave will be turned into X-ray photons. As we will see later, will be identified as the redshift of the first cosmological reionization by Pop III stars. At higher redshift, the emitted photons from supernova remnant shell cooling would be still harder.
As a consistency check we find that, for cm-3, at the onset of the rapid cooling phase, the elapsed time is yr, the shell radius is pc, the swept-up interstellar medium mass is . The fact that is much larger than the mass of the supernova ejecta () guarantees the Sedov-Taylor solution for the regime in question (until cooling sets in). The fact that the shell radius is much smaller than the size of galaxies (pc) and is much smaller than the total baryonic mass in the galaxies () in question indicates that the blast wave at the cooling time is still sweeping through high density interstellar medium, as was assumed. As another consistency check, the time required for electrons and ions to reach temperature equilibrium is yr for the case considered, which is much shorter than , indicating that electrons can radiate away the shock heated thermal energy and that Sedov-Taylor phase is valid. In contrast, in the star-burst model for AGN (Terlevich et al. 1992), the proposed supernova remnants interact with a much higher density medium (cm-3) such that the Sedov-Taylor phase is never reached due to extremely rapid cooling before thermalization.
In brief, a large fraction of supernova explosion energy in Pop III galaxies at , possibly as large as , is shown to be converted into X-ray photons with energy greater than keV. The X-ray background produced by this process will be shown below to be able to play a positive feedback role in the formation of and cooling by molecules in minihalos.
Let us now proceed to identify the characteristics of the composite spectrum of the background radiation field produced by both emissions from the VMS and the thermal emission from VMS supernova blast waves. A relevant parameter for our purpose is the ratio of the energy in the LW bands (eV) to the energy in photons with keV, . Photons in the LW bands (eV) are primarily responsible for photodissociating molecules and are not heavily absorbed by intervening intergalactic atomic hydrogen (except for the saw-tooth modulation by the atomic Lyman line series; Haiman, Abel, & Rees 2000; HAR hereafter). Hard X-ray photons at keV, on the other hand, are also largely unabsorbed by intervening atomic hydrogen and helium and capable of penetrating deeply into the cores of minihalos to produce free electrons through both direct photo-ionization and secondary photo-electron ionization. The abundance of molecules in the cores of minihalos is primarily a result of the competition between the two. In contrast, photons with energy in the range eVkeV are heavily absorbed by atomic hydrogen and helium prior to complete reionization of the universe and thus have little effect on the formation of molecules in the cores of minihalos (byt see RGS for a positive feedback due to ionizing photons on the surface of the expanding HII regions and in relic HII regions). We may write approximately as
| (5) |
where is the fraction of energy in the LW bands emitted by VMS; is the speed of light; is the characteristic mass of VMS (; see §3); is the explosion energy of a typical VMS; is inserted to take into account the effect that some VMS (for example, non-rotating stars with ; Rakavy, Shaviv, & Zinamon 1967; Bond, Arnett, & Carr 1984; Glatzel, Fricke, & El Eid 1985; Woosley 1986) do not produce supernovae (but collapse wholly to black holes). The supernova explosion energy, , released by VMS in the mass range is approximately erg (Woosley & Weaver 1982; Ober et al. 1983; Bond et al. 1984; Nakamura et al. 2001; Heger & Woosley 2002). The VMS has approximately a blackbody radiation spectrum with an effective temperature of K (Tumlinson & Shull 2000; Bromm et al. 2001) for which it is found that , yielding
| (6) |
Is it small enough to enhance formation in minihalos? Let us compare to the results of a systematic study of the effect of X-ray photons on the cooling of minihalo gas by HAR. HAR investigated the effect using a background radiation spectrum, with an upper cutoff at keV. Using to parameterize their results, the findings of HAR are that, when
| (7) |
(for ), formation is enhanced and cooling by is sufficient to allow for the gas in the cores of minihalos with virial temperature K to collapse to form stars. We note that in evaluating above we have taken into account a factor of underestimation of in the original work of HAR due to a factor of underestimation of the LW photon absorption cross section by molecules (Haiman 2002, private communications; RGS; Glover & Brand 2002). The correction factor is a lower limit in the optically thin case for molecules for the cores of minihalos. In the optically thick limit, a substantially larger correction factor needs to be applied (i.e., would be substantially larger than ), although the exact effect would require a re-calculation of the results in HAR. It thus appears that the X-ray emission from Pop III supernova remnants alone may be able to produce enough X-ray photons relative to the number of photons in the LW bands such that production rate of molecules dominates over the destruction rate in most of the minihalos.
2.2 X-ray Emission from Miniquasars Powered by Pop III Black Holes
Another direct consequence of Pop III VMS is an inevitable production of a significant amount of black holes. Pop III VMS more massive than would eventually implode carrying the entire mass to form black holes (Rakavy, Shaviv, & Zinamon 1967; Bond, Arnett, & Carr 1984; Glatzel, Fricke, & El Eid 1985; Woosley 1986) without producing explosions. Pop III VMS less massive than , after about three million years of luminous life, would explode as supernovae or hypernovae leaving behind black holes of mass (Heger & Woosley 2002). These Pop III black holes could accrete gas from surroundings to shine as miniquasars. The likelihood of gas accreting onto these black holes is at least as high as in their lower redshift counterparts since the gas density is higher and halos tend to have somewhat lower spins at high redshift. In the case of the very massive Pop III black holes () formed without explosion, gas may be ready to accrete immediately, as the surrounding gas has not been blown away. The dynamics of the black holes in these environments in the context of cosmological structure formation is a complex subject and can only be treated in separate works. Here we make the assumption that these black holes would accrete gas and grow.
The characteristic gas temperature of a disk powered by accretion onto a black hole is (Rees 1984):
| (8) |
where is the black mass in . For , we have K. While the spectral energy distribution (SED) of quasars powered by supermassive black holes is known to contain a significant fraction in X-rays (e.g., Elvis et al. 1994), the miniquasars at high redshift powered by much smaller black holes will be conspicuous in X-rays, probably emitting predominantly in X-ray band from both thermal and nonthermal emission. A somewhat more quantitative argument may be made as follows. The SED of observed quasars powered by supermassive black holes of mass contains a substantial amount of energy in the X-rays but the largest concentration of energy appears to peak at eV (UV bump; Elvis et al. 1994) barring the unknown gap between UV and X-ray. Under the reasonable assumption that the SED peak frequency scales with the characteristic temperature , then the peak frequency for Pop III black hole powered miniquasars would be shifted (by a factor of compared to quasars) to keV.
Let us now compute the X-ray background produced by miniquasars powered by Pop III black holes. We put this quantitatively in the context of the ratio of energy in LW photons to that of X-ray photons. First, an order-of-magnitude estimate. If a miniquasar has accreted a fraction, , of the initial mass of the black hole, the radiated energy will be
| (9) |
where is the radiative efficiency. Then, the ratio may be written as
| (10) |
where is the fraction of mass collapsed into Pop III stars; is the fraction of mass in that ends in black holes; is radiative efficiency of the miniquasars in units of ; is the fraction of energy radiated by miniquasars with photon energy greater than keV; is the X-ray escape fraction from miniquasars; we have used . The value of is thought to be close to unity (Rees 1984) and the value of is expected to be of order unity. The fraction of mass in Pop III stars ultimately collapsing to black holes is also of order unity, if either Pop III stars are very massive or . The accretion fraction would depend on the gas accretion rate and the formation time of the black hole; parameterization by Equation (10) would be fairly accurate if black holes formed long time ago. But a more accurate way to compute the X-ray energy from miniquasars is to integrate over time over all miniquasars by parameterizing each radiating at times the Eddington luminosity. The results are shown in Figure 2, where the solid and dotted curves show with radiative efficiency of , respectively. The global Pop III star formation rate is computed using Press-Schechter (1974) formula considering all halos with virial temperature greater than K. The reason that the dotted curve with lower radiative efficiency () lie below (i.e., emits more X-ray photons than) the solid curve is that the black hole mass in this case grows at a faster rate, being inversely proportional to the radiative efficiency.

Another useful way to estimate the growth of mass in black holes is to follow the local observed black hole mass-bulge mass relation, , (Magorrian et al. 1998). If the same ratio of the mass in black holes to bulge mass, which at high redshift may be equated to the total stellar mass, holds at high redshift, then we can readily compute the energy liberated by gas accretion onto Pop III black holes as
| (11) |
The horizontal dashed line in Figure 2 indicates computed this way with radiative efficiency of and X-ray escape fraction .
From Figure 2 it is evident that is significantly smaller than (Equation 7), at , required to induce sufficient cooling in minihalos (HAR). The higher value of at higher redshift () is due to the fact that the age of the universe becomes much shorter than the Eddington time of yr and the black holes have not had enough time to accrete a substantial amount of gas; the age of the universe is yr at (for km/s/Mpc, , ).
In summary, two distinctive mechanisms, namely supernova remnants and miniquasars, each appears to be able to generate enough X-ray emission at to provide positive feedback on star formation in subsequent (other) minihalos by making a sufficient number of X-ray photons relative to the number of destructive photons produced in the LW bands. The combination of the two should ensure that enough X-ray radiation is produced as a result of Pop III star formation. In addition, there may be other, significant X-ray emission mechanisms such as inverse Compton emission (e.g., Hogan & Layzer 1979; Oh 2001) or massive X-ray binaries (e.g., Bookbinder et al. 1980; Helfand & Moran 2001). Moreover, additional positive feedback mechanisms, such as that proposed by Ferrara (1998) due to enhanced formation in the supernova cooling shells, that put forth by RGS from the enhanced formation at the surfaces of Strömgren spheres of individual Pop III galaxies and that quantified in the next section (§3) due to formation in relic H II regions produced by Pop III galaxies will further help promote formation. Taking all the processes together, it appears highly likely that the chief obstacle to continuous formation and cooling in minihalos is removed.
Since the assumption that X-ray emission produced by these two processes related to Pop III star formation can produce positive feedback to subsequent star formation is important, it is warranted to have independent checks. We will compare our results to Glover & Brand (2002; GB hereafter). We compare to their X-ray emission model due to inverse Compton, which has luminosity density , where keV and is the fraction of supernova energy transferred to relativistic electrons. Integrating over a range keV we obtain . The luminosity at the LW bands in GB is , which after integration over LW bands gives . Taking the ratio of the above two luminosities yields , for the most optimistic model that they use with . For this model GB find that the critical virial temperature of halos where cooling is sufficient is lowered from K to about K at (see Figure 6 in GB), a significant effect. While even this model is already sufficient to enable molecular cooling in halos with K to reionize the universe at (see Figure 5 below), it is expected that the much smaller computed above for Pop III stars in our model would further drive the critical virial temperature to much lower values and enable star formation in almost all minihalos, consistent with the conclusions reached by HAR.
3 Formation of Molecules in Relic HII Regions Produced by Pop III Galaxies
While the positive feedback due to a high X-ray background produced by Pop III supernovae and miniquasars powered by Pop III black holes seems sufficient to sustain continuous gas cooling in gaseous minihalos, we quantify another important source for production of , which was first pointed out by RGS.
Each Pop III galaxy creates an HII region (Strömgren sphere) around it. Since the lifetime of a Pop III galaxy of yr is comparable to and somewhat shorter than the hydrogen recombination time, yr at , we may assume for simplicity, without causing substantial errors, that the size of the Strömgren sphere is just determined by the number of ionizing photons emitted, . We follow the evolution of such a relic HII region after the death of a Pop III galaxy, in the absence of any external radiation field. We solve a set of rate equations and energy equation for relevant species in an H II region free of metals. The relevant reaction coefficients are taken from Abel et al. (1997).
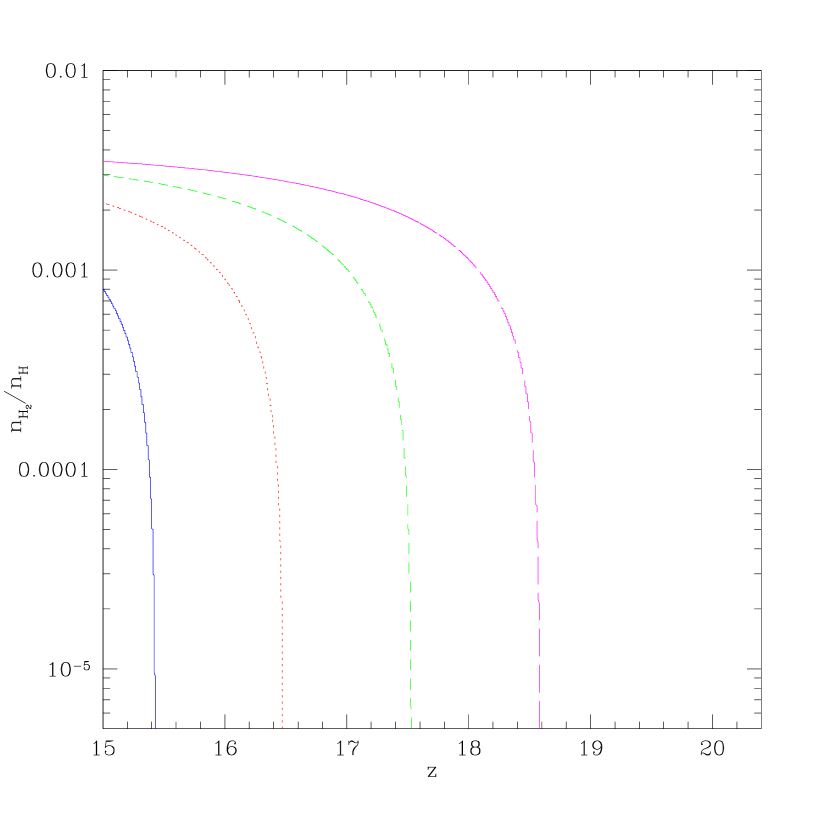
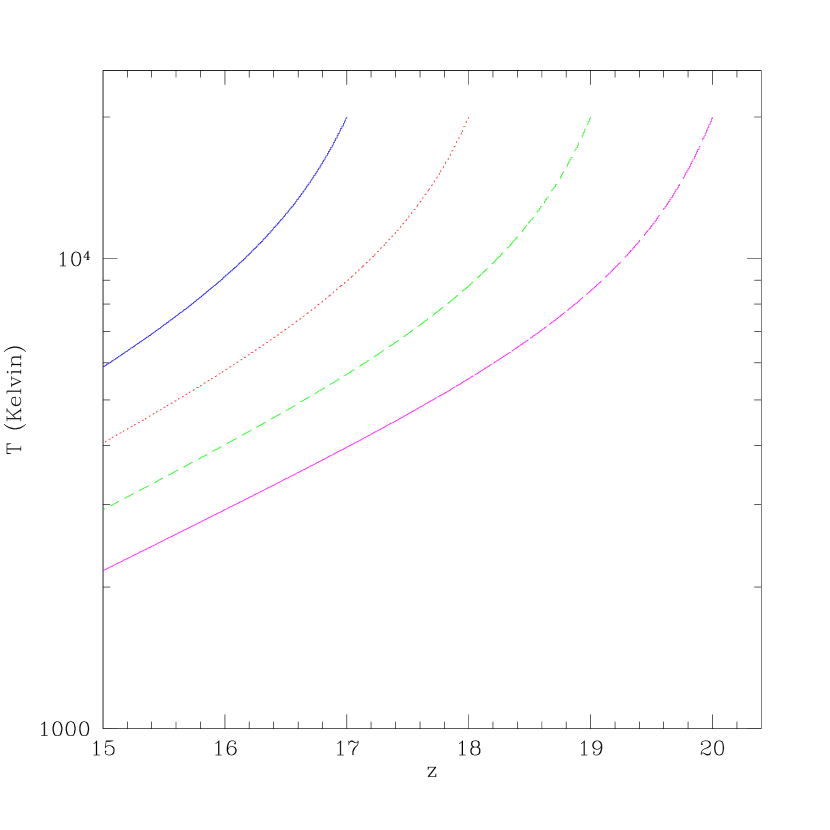
Figure 3 shows the fraction of molecules as a function of redshift for four H II regions formed at , evolved up to redshift , which will be identified as the first reionization epoch by Pop III stars (§4). We see that the fraction in H II regions shows a sharp rise at an early time and flattens out at later times. The reason for this asymtotic convergence may be understood by examining Figure 4, where the temperature evolution of the gas in the region is shown. formation rate decreases with decreasing temperature (Abel et al. 1997), causing the total abundance to flatten out below K. On the high temperature end, since formation rate only becomes significant after the temperature has dropped below about K, we see a slight delay () in the ascent of the abundance in Figure 3.
Let us now assess the significance of the molecules formed in these relic H II regions. A critical ratio here is the number of molecules produced over the number of LW photons produced, denoted as . For ionizing photons emitted by Pop III stars, there will be approximately hydrogen atoms ionized in the H II region. At the same time, the number of LW photons produced by the same stars is . From Figure 3, we take an approximate average for the abundance of molecules produced by . Then, we obtain . Since about LW photons are needed to photodissociate one molecule (RGS; Glover & Bland 2002), the break-even point for the ratio of the number of molecules produced over the number of LW photons produced is about , i.e., no net molecules would be produced. It thus appears that molecules produced in the relic H II regions produced by Pop III stars may be sufficient to offset the production of LW photons by the same stars. Consequently, LW radiation background may never be able to build up during the Pop III era. However, a more careful calculation, taking into account the density fluctuations among others, is needed to precisely quantify this positive feedback effect. But we defer such a calculation to a future work. Nevertheless, it seems possible that this positive feedback in relic H II regions may be more effective than that proposed by Ferrara (1998) due to enhanced formation in the supernova cooling shells and that put forth by RGS from the enhanced formation at the surfaces of Strömgren spheres of individual Pop III galaxies.
In summary, it appears that LW radiation background may have never been able to build up to destroy molecules in subsequent minihalos. In the event that LW radiation background was able to build up, its intensity would have been substantially reduced. The fact that the X-ray background produced by Pop III supernovae and miniquasars powered by Pop III black holes have already been capable of countering an undiminished LW radiation background (i.e., by ignoring all the molecules produced by these positive feedback processes) leads us to conclude that subsequent star formation in minihalos will not be hindered by previous star formation in the Pop III era.
4 The Process of Cosmological Reionization
4.1 Computational Method
We will examine the evolutionary history of the IGM from a very early redshift () until the universe is completely reionized at , as suggested by recent observations. Rather than taking a brute-force approach, which will be deferred to a later work, we will use a new, fast Monte Carlo-like approach to economically sample parameter space. This method, we hope, should be capable of capturing the essential physical processes involved.
At any time the gas in the universe consists of distinct regions in the two-dimensional phase space specified by , where and are the temperature and neutral hydrogen fraction, respectively, and is a varying number. Each phase space region contains mass fraction of the total gas in the universe and its mean gas density is assumed to be equal to the global mean; the sum of all is unity. For each region we solve a combined set of equations simultaneously to follow the coupled evolution of gas and star formation:
| (12) |
| (13) |
| (14) |
where is the global mean hydrogen number density; is the global average of the neutral hydrogen fraction; is the net cooling rate per unit mass (including Compton cooling, atomic line cooling, recombination cooling, photoheating due to ionization and adiabatic cooling due to cosmic expansion), which is a function of , , clumping factor (see below) and redshift ; is the Boltzmann’s constant; is the case B hydrogen recombination coefficient; is the hydrogen collisional ionization coefficient; is the number of ionizing photons emitted per unit volume per unit time, equal to
| (15) |
where is the star formation efficiency; is the fraction of energy (in units of rest mass of stars formed) turned into hydrogen ionizing photons; is the global mean gas mass density; is the speed of light; is the ionizing photon escape fraction from galaxies; is the global rate of fraction of gas formed into stars, equal to
| (16) |
where is the rate of the fraction of gas formed into stars in region . At each time step, we use the Press-Schechter (1974) formula:
| (17) |
to compute the fraction of gas, , that is in halos in region ; where is the complimentary error function and is the rms density fluctuation smoothed over a region of mass at ; is a constant equal to indicating the amplitude of the density fluctuations on a top-hat sphere that collapses at (Gunn & Gott 1972). The threshold halo mass is basically the Jeans mass, given the IGM temperature of region ; i.e., only those halos whose mass is greater than the Jeans mass at that time will accrete gas and contribute to the star formation at that time step. In practice, however, the threshold mass depends on the history of the gas involved as well as non-trivial effects due to dynamically dominant dark matter and is thus best determined by detailed simulations. We will use the empirically determined “filter mass” formula from full hydrodynamic simulations by Gnedin (2000b):
| (18) |
where at the relevant redshift range, , the empirically determined constant is found to be . The results obtained in §4.2,4.3 do not depend on sensitively in the indicated range of .
As has been validated in §2,3 at the Pop III era, star formation occurs in all halos where gas is able to collect, not limited to large halos where atomic hydrogen cooling becomes efficient. It is, however, unclear whether cooling would still be efficient in the Pop II era. We show that even in the absence of the X-ray background, a high residual ionization fraction can be maintained after the first reionization, thanks to the long hydrogen recombination time. Let us make a simple estimate by computing the ratio of the recombination time to the dynamical time of a region of overdensity with ionization fraction . We find
| (19) |
for K. It is thus clear that an ionization fraction of order will be maintained for as high as (the core density is about ), as long as the gas is ionized at least to that level at a higher redshift (of course, the first reionization raises the gas ionization to a much higher level than this). Such a level of ionization is adequate to enable the formation of a sufficient amount of molecules to supply ample cooling at K (HAR; Tegmark et al. 1997) and star formation should continue to take place in any gaseous halo. Looking forward to the results, it turns out that the condition for cooling has a rather small effect for the second cosmological reionization, since the amount of intergalactic gas able to accrete onto minihalos is very small.
The halo mass within the virial radius is related to the virial temperature at by the standard formula:
| (20) |
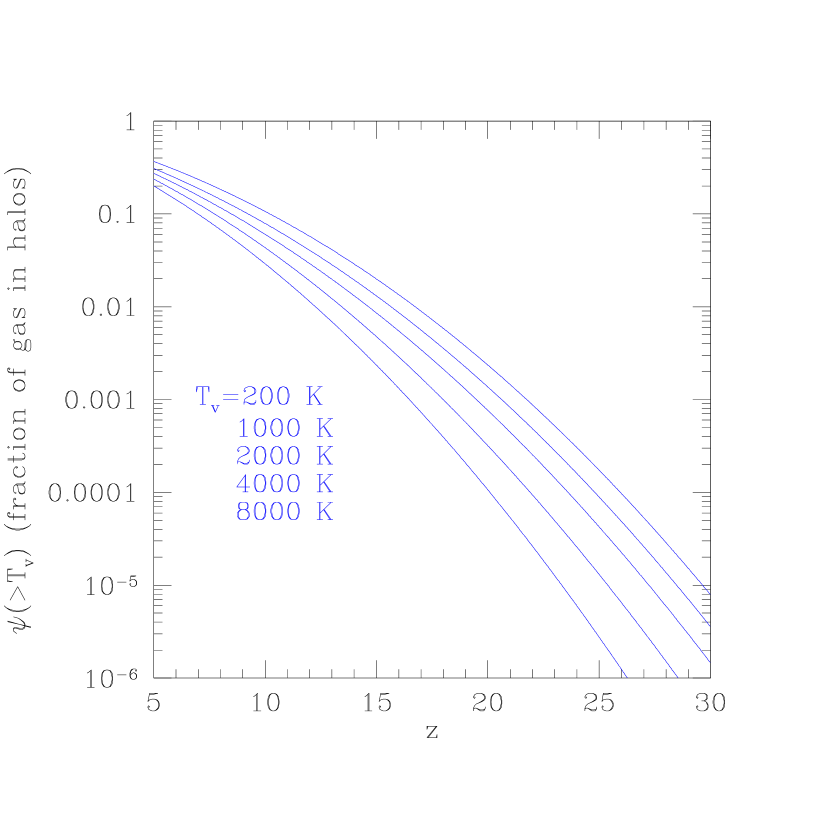
where is the virial temperature in Kelvin and is the matter density at zero redshift in units of the closure density. Figure 5 relates the virial temperature at each redshift to the halo mass for the five indicated virial temperatures. Figure 6 shows the fraction of gas in halos as a function of redshift, with virial temperatures greater than the five indicated values, K.

The clumping factor in each region affects local atomic processes and is defined to be , where is the effective clumping factor of virialized gas and the remaining gas is assumed to have a clumping factor equal to unity for simplicity. We will adjust such that the overall averaged over all regions matches detailed simulations at some appropriate redshift. Note that the adjustment on is necessary in order to take into account complicated radiation shielding effect affecting halos.
Having defined the relevant formulae let us go back to examine the main evolution equations more closely. Equation (12) is the rate equation that mass in region is photoionized; i.e., the rate of the amount of gas swept by the ionization front. The sum of ionized gas over all the phase space regions at each time step creates a separate (HII) region in the phase space with a mean temperature equal to
| (21) |
where the first term inside the parentheses on the right hand side is the temperature of region and the second term accounts for photo-heating, with set to K (varying from K to K does not significantly change the results) We set the initial neutral fraction of the newly created HII region to , although results obtained do not depend on the exact choice for this value, as long as it is a small number. The initial mass fraction of this new HII region is equal to
| (22) |
where is the time step. We formulate that all phase space regions co-exist in real space when averaged over a sufficiently large volume and photoionization ionizes all phase space regions proportionally, as indicated by Equation (12). Figures (13,14) are the energy equation and rate equation for neutral hydrogen in each phase space region.
The attentive reader may have noticed the central idea behind this simple approach. That is, this approach attempts to mimick the stochastic percolation process during cosmological reionization, where individual HII regions are created and their subsequent evolution followed. New HII regions created may originate from a combination of regions, some of which have previously been ionized but subsequently recombined, some of which were never ionized and some of which may be recently created HII regions but now get percolated. We do not include a photoionization term on the right hand side of Equation (14), rather, equivalently, we remove the fraction of gas in that region that is being ionized and add it to a new phase space region according to Equations (12 and 22). This is equivalent to saying that gas is ionized when ionization front passes through, and is not ionized uniformly.
One important difference between this method and another commonly used method which computes the filling factor of HII regions (e.g., Shapiro & Giroux 1987; Haiman & Loeb 1997; Madau et al. 1999; Miralda-Escudé, Haehnelt, & Rees 2000) is that we follow the evolution of all regions including HI, HII regions and partially ionized regions. This is important for our purpose, chiefly because at high redshift HII regions experience rapid recombination and cooling. Needless to say, this method is still highly simplified. More sophisticated calculations would require simulations that follow detailed three-dimensional radiative transfer (e.g., Norman, Paschos, & Abel 1998; Abel, Norman, & Madau 1999; Razoumov & Scott 1999; Kessel-Deynet & Burkert 2000; Gnedin & Abel 2001; Cen 2002) but will be carried out in our future work.
We start a simulation at a very early redshift, say, , when the gas may be safely assumed to cold and neutral. For simplicity we set the initial gas temperature to be equal to the microwave temperature, although the gas may be cooler than that, but the results would not change noticeably. Thus, the initial condition is this: K (where is the starting redshift), , , and the initial number of entries in the phase space is . increases linearly with the number of time steps taken. We can afford to make the timesteps sufficiently small to be able to follow the ionization and energy equations accurately in this simple approach.
To self-consistently compute the IMF, we follow the metal enrichment history of the intergalactic medium. Most importantly, there is a critical transition at some point in redshift in the metallicity of the IGM, when a certain amount of Pop III stars have formed. Subsequent to that transition, sufficient metal cooling would cool collapsing gas inside halos to temperatures lower than achievable by cooling, resulting in the “normal” Pop II stars with a “normal” Salpeter-like IMF. According to Oh et al. (2001) this transition occurs, when a fraction, , of the total gas is formed into VMS with masses in the range . Without fine tuning, it is likely that VMS with masses outside this range should exist. Bearing that in mind we assume conservatively for our calculations a threshold fraction of . We note that between the formation of stars and metal enrichment of the IGM there should be a delay in time. To accommodate this time lag we assume (where is the Hubble time at that time) after a fraction of total gas has formed into VMS, the transition from Pop III VMS to normal stars with Salpeter-like IMF takes place.
The emission spectrum of metal-free VMS with is relatively simple and has, to a very good approximation, a blackbody spectrum with an effective temperature of K, radiating at the Eddington luminosity erg s-1 for about yr, which translates to a hydrogen ionizing photon production rate of photons s-1 for VMS (El Eid, Fricke, & Ober 1983; Bond, Arnett, & Carr 1984; Bromm, Kudritzki, & Loeb 2001; Schaerer 2002). The hydrogen ionizing photon rate for normal Pop II stars with Salpeter-like IMF with a low metallicity is assumed to be photons s-1 , corresponding to a UV emission efficiency of (in units of the rest mass energy of the total amount of stars formed), adopted from Bruzual-Charlot stellar synthesis library (Bruzual 2000) for metal poor stars. With the high effective temperature VMS are efficient emitters of ionizing photons with approximately ten times more hydrogen ionizing photons per unit stellar mass than stars with the Salpeter IMF.
We use a very conservative star formation efficiency for minihalos with cooling (Abel et al. 1997, 2000; Bromm et al. 2001,2002), the fraction of gas formed into stars out of an amount of gas virialized in minihalos. Star formation efficiency in halos with efficient atomic cooling is assumed to be .
4.2 Normalizing Ionizing Photon Escape Fraction
The most important factors determining the ionization process are , , . The first two can be combined (see Equation 15). Thus, effectively, there are two primary factors, and . For the sake of explanation and taking a very conservative stance we use a ratio , as indicated in the previous subsection, to maximize the radiation emission for the second reionization when Pop II stars are responsible and minimize the emission from Pop III stars that are responsible for the first reionization. Consequently, we are left with the freedom to adjust and .
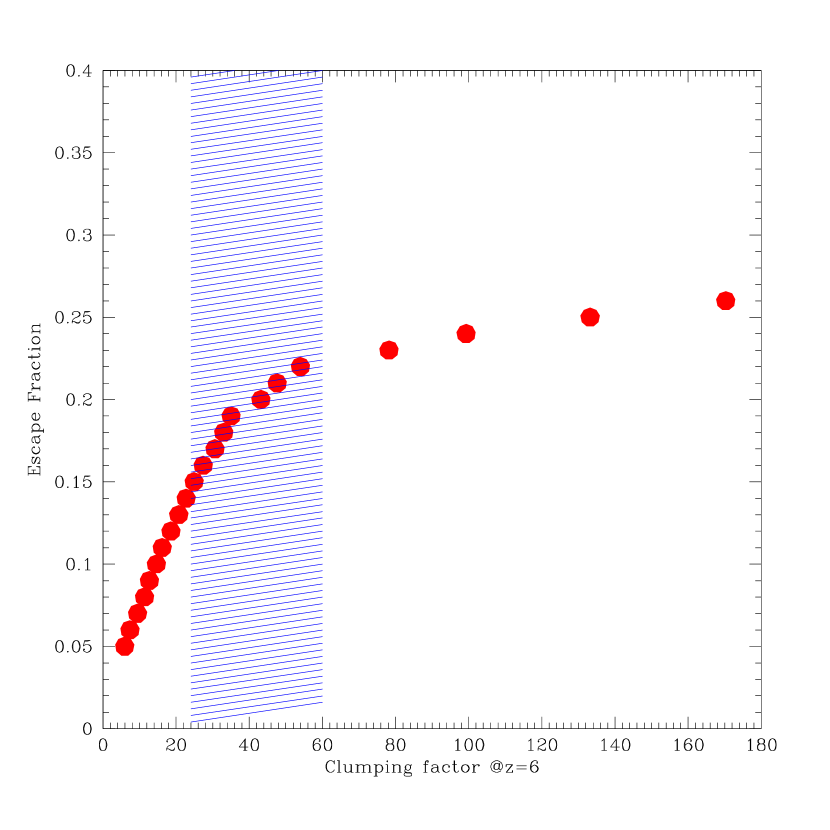
Both theoretically and observationally, we have essentially no direct knowledge about at high redshift in question. One may argue that smaller galaxies at high redshift would result in higher escape fraction. On the other hand, one may also argue that higher density at high redshift may yield lower escape fraction (e.g., Ricotti & Shull 2000). It thus seems most productive to seek empirical constraints on . Our approach is to require that the universe is reionized at , as observations suggest (e.g., Fan et al. 2001; Becker et al. 2001, Barkana 2001; Cen & McDonald 2002; Litz et al. 2002). With such a normalization point and the fact that the clumping factor is well constrained by Ly forest observations, we are able to tightly constrain the range of . Since the same range of waves in the density fluctuation power spectrum traced by the Ly forest are mostly responsible for the clumping of the IGM at . This direct observational constraint is very powerful.
Figure 7 shows the required ionizing photon escape fraction from galaxies as a function of the clumping factor of the IGM at . The cross-shaded area indicates the range of the clumping factor constrained by Ly forest observations (Croft et al. 2002), which is obtained as follows. Based on the latest high signal-to-noise Ly forest observations, Croft et al. (2002) give a constraint on () for a flat cold dark matter model with and . Using slightly different values of does not significantly change the range of . We use simulations to empirically obtain the clumping factor of HII regions at . The high resolution simulations of Gnedin & Ostriker (1997) are the best simulations for this purpose. They give a clumping factor for HII regions at for a low CDM model with , , (see Figure 2 of Gnedin & Ostriker 1997). Since the CDM model at the high redshift behaves like an Einstein-de Sitter universe and as a result we can scale their results approximately as follows. We can obtain the clumping factor at for a model by using the clumping factor at of the Gnedin & Ostriker (1997) simulation and similarly the clumping factor at for a model by using the clumping factor at of their simulation. Constraining to have an ionized universe at we obtain at for the CDM model with (), shown as the cross-shaded region in Figure 7. The solid dots in Figure 7 are obtained by running simulations of the reionization process using the method described §4.1 by requiring that reionization complete at and the clumping factor at matches the value on the x-axis.
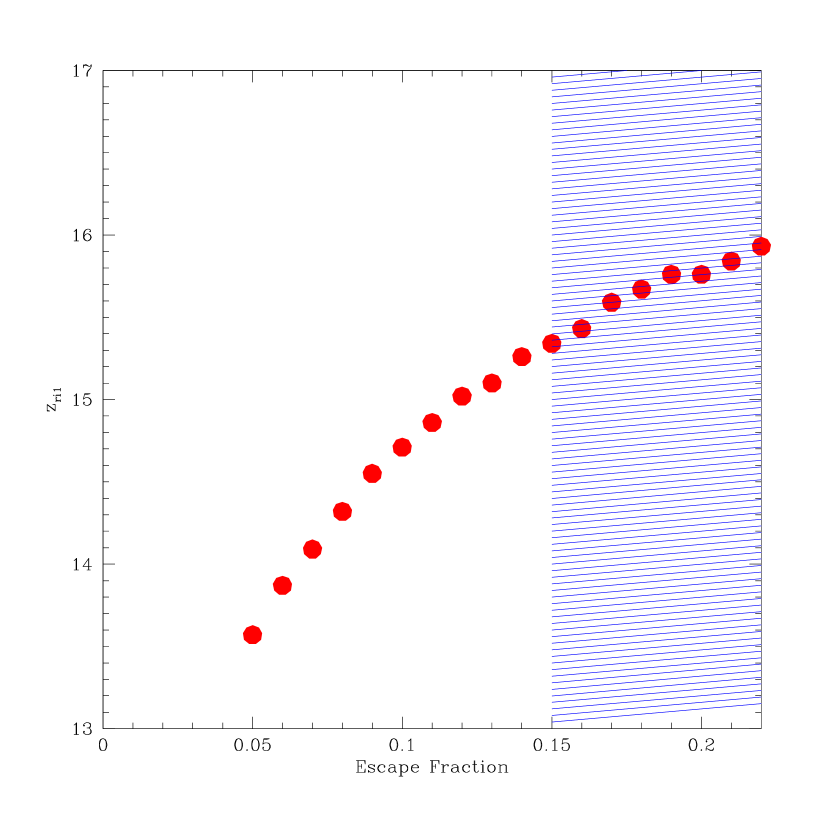
Figure 8 shows the epoch of the first reionization as a function of the normalized escape fraction. The cross-shaded region is constrained by the normalization that the universe is reionized at (see Figure 7). We see that, the required constraint by the Ly forest observations limits the first reionization epoch to .
We note that the required ionizing photon escape fraction of from galaxies at is significantly higher than those of local starburst galaxies. It should stressed that the clumping factor predicted by Gnedin-Ostriker simulations, though high resolution, is nevertheless still underestimated. Thus, the actual required ionizing photon escape fraction from galaxies may be somewhat higher than indicated. For local starburst galaxies Hurwitz et al. (1997) give () for Mrk 496, Mrk 1267, and IRAS 08339+6517 ( in the case of Mrk 66). Deharveng et al. (2001) give an escape fraction of for Mrk 54. Heckman et al. (2001) give from local starburst galaxies. Theoretical models (Dove & Shull 1994; Dove et al. 2000) give an estimate of . Thus, we conclude that, in the context of CDM model, galaxies at appear to demand a higher ionizing photon escape fraction than local starburst galaxies. Upon extrapolation it seems plausible that a higher ionizing photon escape fraction may be expected for galaxies at still higher redshift, those responsible for the first cosmological reionization. For simplicity and being conservative we have assumed that the ionizing photon escape fraction from galaxies at is equal to that as determined in Figure 7.
4.3 Detailed Evolution of Intergalactic Medium
Let us now examine the evolution of IGM in the context of standard cold dark matter model. We use the following model parameters: , , at , . This model lies at the lower (left) bound of the cross-shaded region in Figure 7. Any model to the right of this model would require higher ionizing photon fraction and thus would yield a higher first reionization redshift. A spatially flat cold dark matter cosmological model with , , , km/s/Mpc and is used. The results do not sensitively depend on small variations on the cosmological model parameters. We remind the reader that in our formalism described in §4.1 we have the freedom to adjust to match the required at ; we find that with the adopted cosmological model provides a match to the required at .
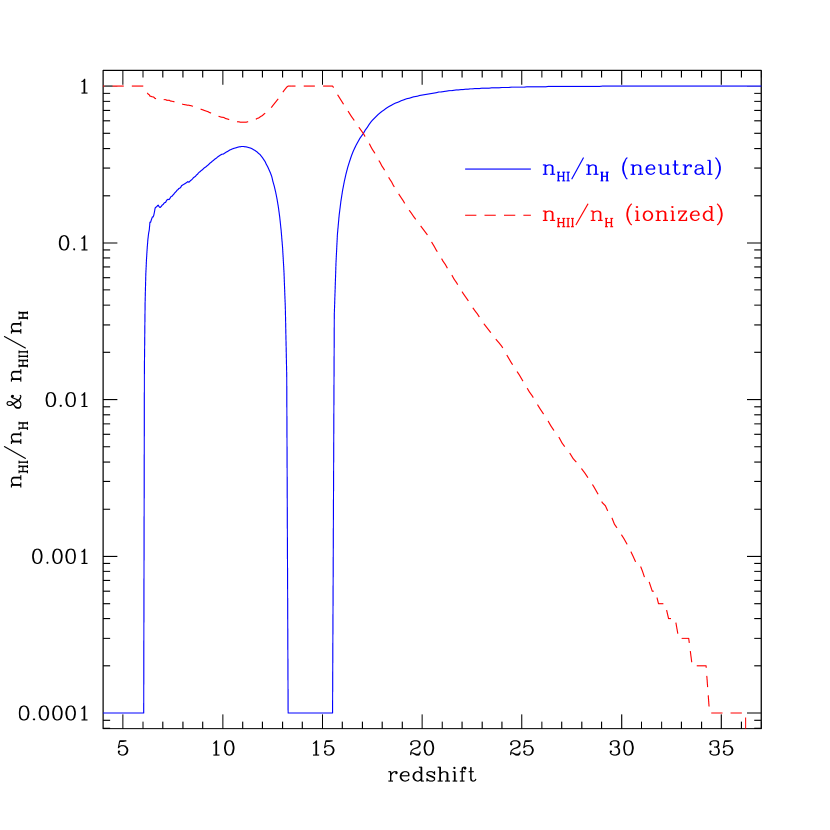
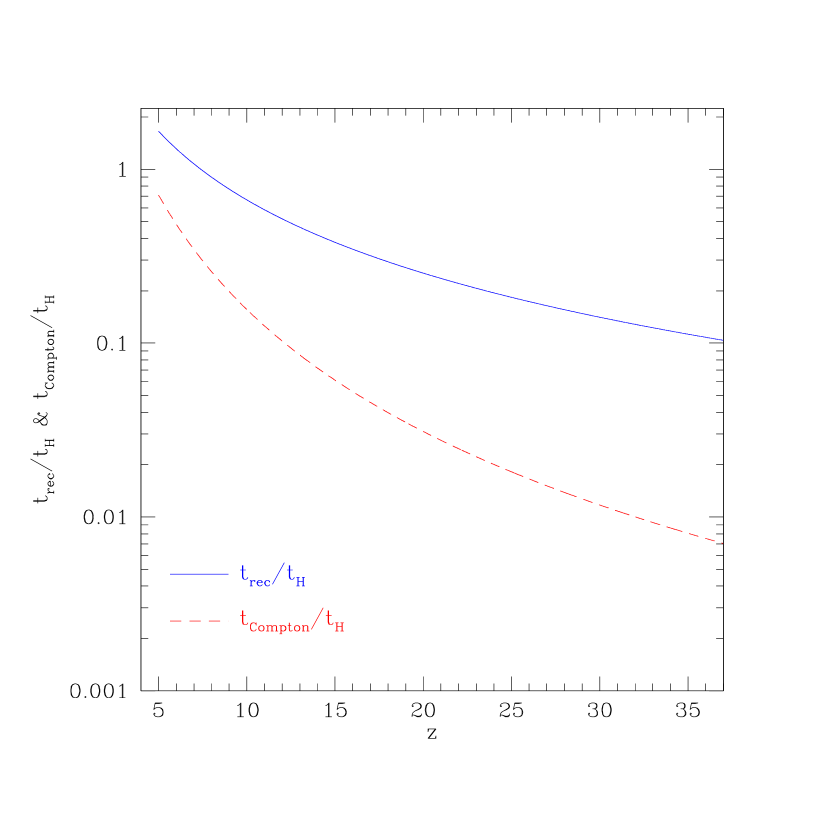
Figure 9 shows the global hydrogen neutral fraction and the complimentary ionized fraction as a function of redshift. The first reionization at as well as the sustained ionized state until is made possible by Pop III VMS. The redshift marks the transition from Pop III stars to Pop II stars, causing the emission of hydrogen ionizing photons to plunge. The suddenly reduced hydrogen ionizing photon emission is no longer able to counter the rapid hydrogen recombination process, resulting in the second cosmological recombination at . Since a very small amount of neutral fraction suffices to blank out all Ly emission, the universe essentially becomes opaque to Ly photons from to .
However, hydrogen is significantly ionized with throughout the long second reionization process from to . To facilitate a better understanding, it is useful to show some important time scales involved. We show in Figure 10 the ratio of hydrogen recombination time over the Hubble time and the ratio of Compton cooling time over the Hubble time. It is noted that at the redshift and density of interest Compton cooling dominates over other cooling terms, although adiabatic cooling starts to become important approaching the end of the second reionization period. We immediately see that the hydrogen recombination time is significantly longer than the Compton cooling time, both of which are shorter than the Hubble time at . Therefore, the IGM at early times heated up by the photoionization would subsequently cool down more rapidly than recombining, resulting in overcooled but significantly ionized IGM, in the absence of subsequent photoheating.
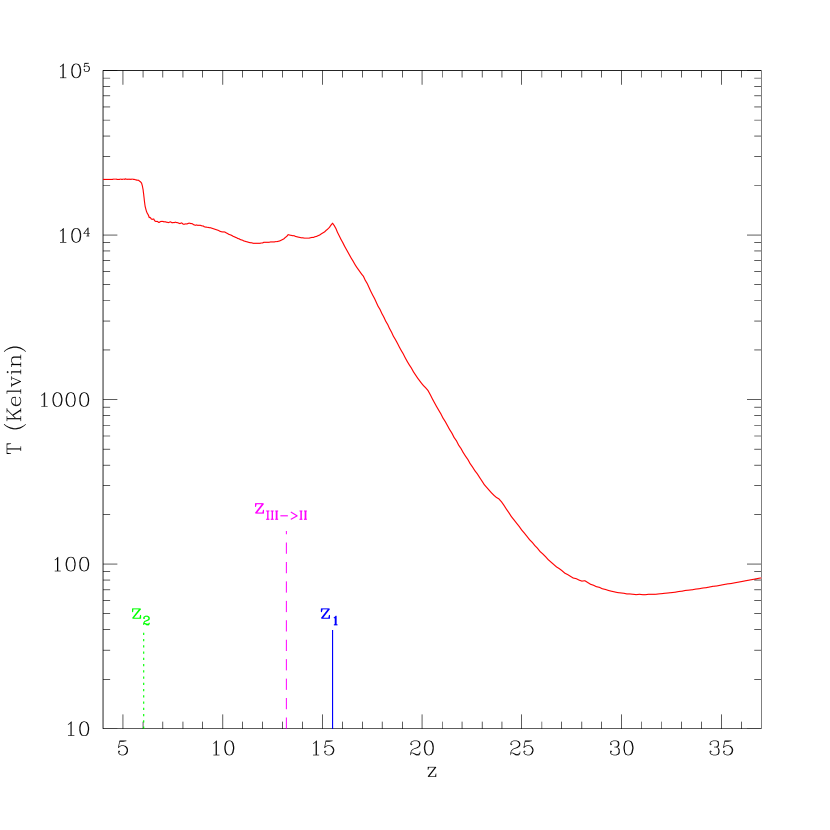
More results are shown in Figures (11,12,13,14) for the evolution of mean temperature, clumping factor, stellar fraction and number of ionizing photons, respectively, as a function of redshift. In Figure (11) we see a sustained ascent in mean temperature of the IGM from up to the redshift of the first reionization . Subsequently, the mean temperature of the IGM is roughly maintained at K, due to the works of two counter-balancing effects: substantial cooling reduces the Jeans mass of the IGM and would increase the star formation rate, which would then provide increased heating by photoionization. Thus, the mean temperature of the IGM is self-regulated due to the competition between the Compton cooling and photoheating. For the cold dark matter cosmological model it happens that the star formation activities are at a level such that the two balancing terms are comparable in magnitude, resulting in a fairly mild evolution of the IGM mean temperature seen in Figure 11.
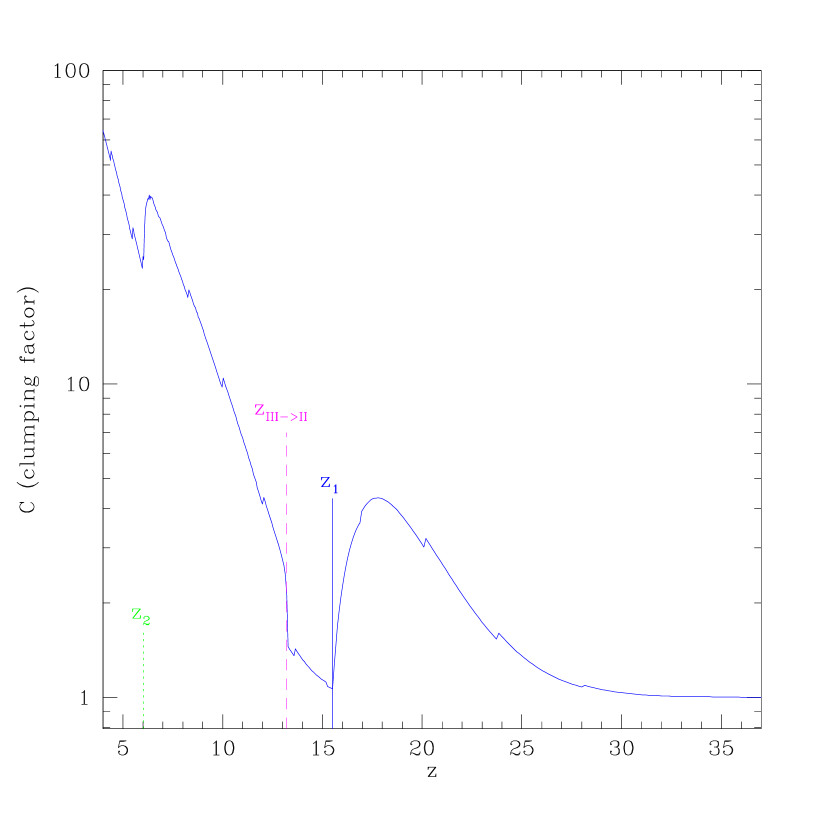
From Figure 12 it is evident that in the period preceding the first reionization from to a large fraction of gas is unable to accrete onto minihalos due to heated temperature of the IGM and results in a large decrease in the clumping factor of the IGM, followed by a mild increase in the clumping factor in the brief ionized state from to . From to the clumping factor of the IGM increases steadily, parallel to the increase in the nonlinear mass scale with time, which is then followed a very brief, moderate drop immediately after when there is an increase in the temperature of the IGM from K to K (see Figure 11) due to the completion of the second reionization.
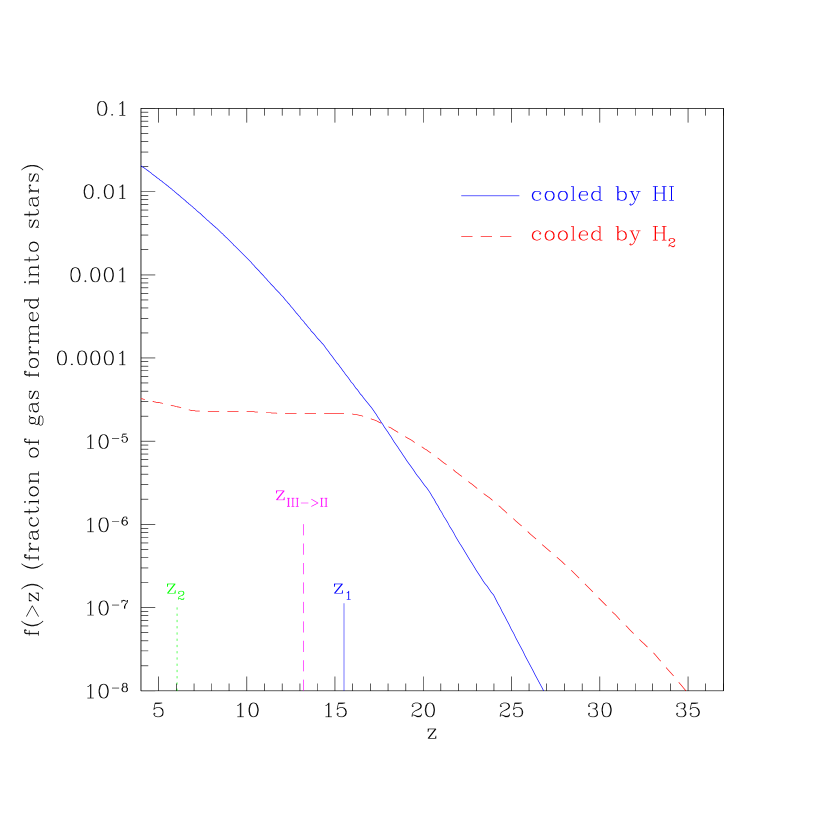
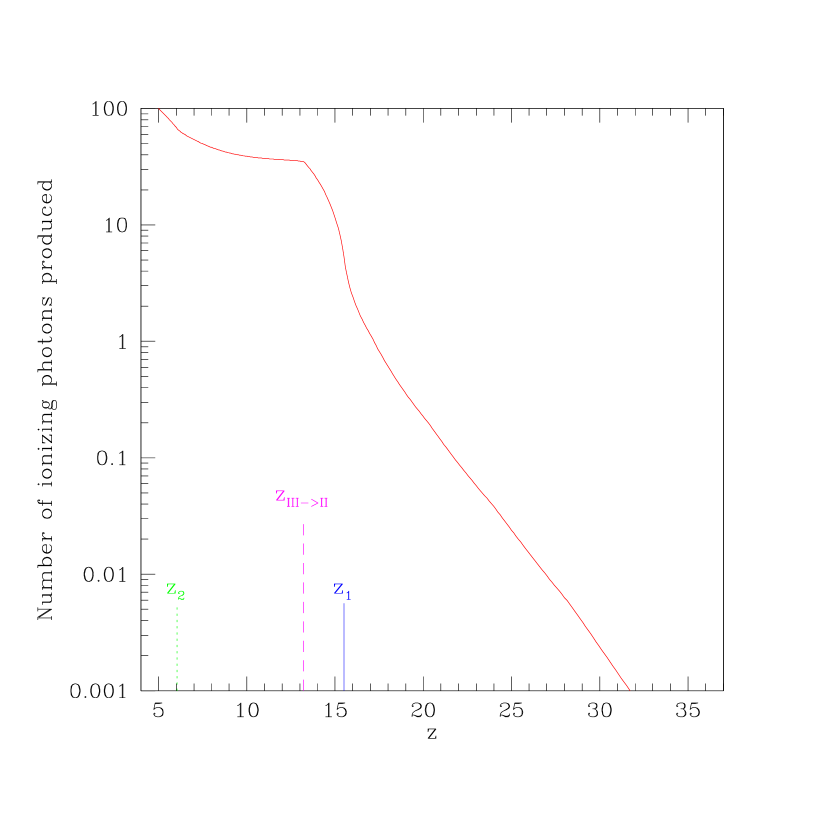
Some interesting features may be found in Figures (13,14). We see in Figure 13 that, although stars formation in minihalos (dashed curve) dominate over that in large halos (solid curve) at , the latter gradually takes over and become dominant at . Therefore, while Pop III stars in minihalos may be a very important source of heavy elements to enrich the IGM, the first cosmological reionization is largely due to Pop III stars in large halos. As a result, at least for this particular case, the first reionization would have occurred even without the validation presented in §2,3 that cooling is sufficient in minihalos during the first reionization process. About of the total gas has formed into Pop III VMS by the time the universe was first reionized. We note that we have adopted a very conservative ratio of for this example. If, for example, the ratio were , then Pop III stars in minihalos would largely be responsible for first reionization. By the time the universe was reionized for the second time. about of the total gas has formed into stars. From Figure 14 we see that at the epoch of the first reionization about 4 ionizing photons per baryon have been produced by Pop III stars. About fraction of gas formed into Pop III stars at a slightly later epoch and the delayed transition from Pop III stars to Pop II stars occur at , clearly seen in Figures (9,11,12). More than 60 ionizing photons per baryon have been produced by the time than the universe is reionized for the second time at .
In summary, the cosmological reionization process has several interesting characteristics. First, the universe was generically reionized twice, one at by Pop III VMS and the other at by normal Pop II stars. Most of the Pop III VMS responsible for the first cosmological reionization would come from large halos if star formation efficiency in minihalos is less than a few percent of that of large halos; in this case, our argument that cooling is efficient in minihalos during the first cosmological reionization, while still true, may not be necessary. Otherwise, most of the Pop III VMS responsible for the first cosmological reionization would come from minihalos, where efficient cooling is required. Second, the IGM is maintained at a rather “warm” temperature K from the first reionization through the second reionization; i.e., the universe is significantly heated up even in this “dark age” preceding the second, complete reionization of the universe at . Third, the IGM is kept at a significantly ionized state throughout the second reionization period. Finally, the overwhelming fraction of star formation activity responsible for producing the ionizing photons in the period from the first reionization through the second reionization are in large halos.
5 Discussion
The possible indication of a more top-heavy initial stellar mass function (IMF) in early galaxies or earlier stages of galaxies than present-day IMF (Salpeter 1955) was suggested five decades ago (Schwarzschild & Spitzer 1953). Cosmological consequences of the first generation, massive stars at high redshift have been discussed in a variety of contexts (e.g., Layzer & Hively 1973; Carr 1977; Rees 1978; Rowan-Robinson, Negroponte, & Silk 1979; Puget & Heyvaerts 1980; Tarbet & Rowan-Robinson 1982; Carr, Bond, & Arnett 1984; Haiman & Loeb 1997; Barkana & Loeb 2001).
The reionization picture presented here would have a wide range of profound implications for many aspects of structure formation. There are many questions that need to be addressed. It is beyond the scope of this paper to explore any of these issues in significant details and we will study these and other relevant issues in subsequent investigations. But we will give some simple estimates or analyses for some selected issues.
5.1 Initial Metal Enrichment of the Intergalactic Medium
Direct observational evidence for massive Pop III stars may be just emerging recently. While Luck & Bond (1985) and others have previously indicated the need for VMS () to explain the overabundant elements, Qian, Wasserburg and collaborators (Wasserburg & Qian 2000; Qian & Wasserburg 2000,2002; Oh et al. 2001) have recently stressed the unique signature of Pop III VMS and suggested that Pop III stars could promptly produce the observed abundance patterns of metal poor stars (McWilliam et al. 1995; Ryan, Norris, & Beers 1996; Rossi, Beers, & Sneden 1999; Norris, Ryan, & Beers 1997,2001; Norris et al. 2002; Hill et al. 2002; Depagne et al. 2002).
Given the shallow potential wells of Pop III galaxies, supernova explosions would likely blow away the ejectas along with a large fraction of the diffuse interstellar gas (Mac Low & Ferrara 1999; Mori, Ferrara & Madau 2002). From Figures (9,11-14) we see that the transition from Pop III stars to Pop II stars occurs a later time than the first reionization; i.e., Pop III stars ionized the universe for the first time. Oh et al. (2001) have suggested this possibility based on the observed transition of abundance pattern at [Fe/H]=-3 in metal poor stars summarized by Qian & Wasserburg (Wasserburg & Qian 2000; Qian & Wasserburg 2000,2002), who found that at lower value VMS dominates the enrichment, whereas at higher value a sharp rise in the abundances of the heavy r-process elements such as Ba and Eu in galactic halo stars with [Fe/H] signifies the occurrence of Type II supernovae of normal stars with masses of .
One may expect to see the Pop III star abundance patterns in low density regions of the universe, such as Ly clouds or voids, where subsequent additional enrichment may be minute. Recent work on Ly clouds suggests that metal enrichment by Pop III stars be consistent with Ly cloud observations and the necessary enrichment occur prior to (the highest epoch for the available Ly cloud data analyzed) (Qian, Sargent, & Wasserburg 2002).
One obvious advantage for Pop III supernovae to enrich the IGM with the first metals at is that it is much easier to relatively uniformly disperse the metals across the IGM for two reasons. First, the disturbances to the density and velocity fields are smaller at high redshift, because each Pop III galaxy needs to fill only a very small IGM volume. Second, any significant large-scale motions would decay away rapidly, in the absence of dynamical support. As a result, the excellent agreement found between simulations and observations with respect to the Ly forest at (Cen et al. 1994; Zhang et al. 1995; Hernquist et al. 1996; Miralda-Escudé et al. 1996; Bond & Wadsley 1997; Theuns et al. 1998) would not be altered, although recent simulations also indicate that low redshift galactic winds would not spoil the main properties of Ly forest produced by previous simulations (Theuns et al. 2002).
5.2 Intergalactic Magnetic Field
Another possible consequence of supernova explosion and expulsion of the gas into the IGM is the magnetic feedback to the IGM. Rees (1994) has first pointed out the importance of resident supernova remnants in galaxies being a substantial large-scale seed field for galactic dynamos. Let us give a simple estimate here for the contribution of the Pop III supernova remnants to the intergalactic magnetic field. Folloing Rees (1994) we should use local observations as a guide. The Crab Nebula (a plerion) has a magnetic field of strength currently occupying a sphere of radius pc, totaling a flux of G cm2. Assuming flux conservation and Pop III magnetic bubble filling factor of unity give , where is the mass of a typical Pop III star, is the zero-age main sequence progenitor star for Crab; is the fraction of baryons formed into Pop III stars (see Figure 14) by redshift when the transition from Pop III to Pop II occurs; is the mean baryonic density at zero redshift; is the redshift of ejection of the magnetic field into the IGM; we have assumed that the magnetic flux is approximately proportional to the stellar mass. Inserting all the numbers gives G at and subsequently G. This magnetic field, having a significantly larger amplitude than that produced by gravitational shocks in the collapse of large-scale structure (Kulsrud et al. 1997), could serve as a seed field for subsequent galaxy formation. The mean separation between Pop III galaxies is of order comoving kpc. Thus, if Pop III supernovae are responsible for enriching the IGM relatively uniformly to a metallicity of about a thousandth of the solar value, it is also likely that the magnetic field lines originating from supernovae remnants would be stretched to fill up the intergalactic space, resulting in an initial magnetic field possibly coherent on scales as large as kpc.
In addition, miniquasars powered by Pop III black holes may produce mini radio jets, as would have been implied by the observational fact that radio jets are observed in accretion disks on a wide range of scales in a wide variety of astrophysical systems. The magnetic field from miniquasars may be as important as or more important than that from the Pop III stars; but a reliable estimate is difficult.
5.3 Pop III Black Holes
Without fine tuning the IMF of Pop III stars, it seems likely that black hole from Pop III stars more massive than and smaller black holes () from Pop III stars less massive than would form. The possible bimodality of the distribution of black hole mass is interesting but the consequences are too complicated to be easily outlined. Those Pop III black holes will be building blocks for subsequent structures and the question is: where will they go? In general, since there is no correlation between the small-scale structures that form Pop III galaxies and later structures, one would expect to find those black holes in all environments, including globular clusters, galactic disks, galaxy halos and intergalactic space. It is possible that the dynamic formation of halos and galaxies in hierarchical structure formation may be significantly altered in the presence of these massive black holes, especially in the cores of the relevant structures, such as globular clusters, galaxies, etc. The number density of Pop III black holes of mass is of order per comoving Mpc3, comparable to the number density of globular clusters and mass density comparable to present mass density in supermassive black holes in the centers of galaxies (e.g., Merritt & Ferrarese 2001). The interesting agreement between this result and that of Madau & Rees (2001) with regard to the mass density of Pop III black holes is traceable to the fact that the density peaks used in Madau & Rees’s (2001) model happen to yield about the same collapsed fraction as ours. From the inferred number density of Pop III black holes it is quite possible that many globular clusters could be seeded by those black holes. There is clearly no shortage of Pop III black holes to provide seeds for later supermassive black holes seen in centers of local galaxies (e.g., Tremaine et al. 2002), AGN and quasars (e.g., Rees 1984,1990).
How could these black holes be observed? Miralda-Escudé & Gould (2000) pointed out the possible existence of stellar black hole clusters at the Galactic center. Their reasoning may be equally applied here. Since Pop III star mass fraction is of order of of total baryonic mass, as our calculation indicates, their should be black holes either having mass or (noting that the mass fraction in black holes will be a factor about 10 lower for less massive black holes). The reader is encouraged to refer to Miralda-Escudé & Gould (2000) and also Sigurdsson & Rees (1997) for a detailed discussion of possible manifestations of such a black cluster, bearing in mind that the black holes here are more massive and may enhance some of the effects discussed.
In the hierarchical structure formation process, these Pop III black holes are expected to grow (there are a large number of e-folding times available) and merge, along with larger cosmic structures. The merger of black holes may be detectable by the gravitational wave experiment Laser Interferometer Space Antenna (LISA) (e.g., Menou, Haiman, & Narayanan 2001; Hughes 2002).
5.4 Detecting Pop III Galaxies and Pop III Hypernovae
We will examine the observability of Pop III galaxies and their associated hypernovae with respect to SIRTF and JWST (James Webb Space Telescope).
The physical sizes of the galaxies in the redshift range is unknown but it seems unlikely that they will be larger than their lower redshift counterparts. Steidel et al. (1996) find that the great majority of objects have a half-light radius kpc, which, if placed at , would subtend (for the adopted model), more than a factor of below the angular resolution of SIRTF. In other words, these high redshift galaxies are point sources to SIRTF. The flux density (the power per unit antenna area and per unit frequency interval) of a point source (without cosmological surface brightness dimming) at frequency is (Weinberg 1972): , where is the source redshift and is the observed photon frequency. is the intrinsic power, the power emitted per unit solid angle and per unit frequency interval, related to the luminosity of the source by , where is the rest frame bandwidth at which the source has a luminosity ; is the comoving distance to the source. Using a rest frame band (corresponding to the observer’s band ) and we obtain
| (23) |
The point source detection sensitivity at level (for relatively long integration time seconds) of the Infrared Array Camera (IRAC) on SIRTF at is (SIRTF Project 1997) Jy, where is the integration time in seconds. The second term inside the square root is the confusion noise limit due to faint unresolved sources, modeled by Franceschini et al. (1991).
The total luminosity of a Pop III galaxy ranges from for minihalos to for large halos; only a small fraction of the total luminosity is in the indicated band. It is clear that no Pop III galaxies hosted by minihalos will be directly detectable by SIRFT, even without the confusion noise limit. Perhaps only the high mass end of Pop III galaxies with mass (which would give Jy) may be detectable by SIRTF, in the presence of confusion sources. The sensitivity of the JWST is close to nJy (Stockman & Mather 2000). Therefore, Pop III galaxies with large halos will be detectable by JWST, whereas Pop III galaxies with minihalos may still be beyond reach of even JWST. Our calculations indicate a large fraction of Pop III galaxies will be detectable by JWST; a more detailed treatment will be reserved for a future paper.
The total number of Pop III hypernovae (HN) is , where for Pop III star mass is used, Mpc is the comoving Hubble radius and is the comoving mean baryonic density. We can estimate the Pop III hypernova surface number density at any given time to be
| (24) |
where is the time duration of each hypernova event in the hypernova restframe and is the age of universe at ; the first parenthesized term in the above equation takes account the finite duration of each supernova event and an intrinsic duration for the hypernovae yr is used; the last term takes into account that the observable redshift interval is of the total volume of the universe then. This HN surface density is comparable to the surface density of SNe derived by Miralda-Escudé & Rees (1997), based on the observed metallicity in the Ly clouds.
Assuming the optical luminosity of a hypernova to be (about times that of the local normal supernovae), the flux density of Pop III hypernovae at will be at a level . Even without background confusion (if the variable source has a variability time scale shorter than the indicated integration time), in order to detect such a flux density at level, an integration time of days on SIRTF IRAC will be required, which seems impractical. Even if this long integration is achievable, the fact that the variability time scale of a hypernovae at the considered redshift may be quite long indicates that it will be extremely difficult to directly detect high redshift hypernovae, unless their flux is significantly amplified.
In Appendix A we derive the probability of strong gravitational lensing by massive clusters of galaxies and find that a random source behind a massive galaxy cluster will have a probability
| (25) |
being magnified by , where is the lensing magnification and is the field of view of a telescope. The number of Pop III hypernovae, magnified by , per field of view centered on a massive cluster is then
| (26) |
In order for the IRAC camera of SIRTF to detect at statistical level a point source, which would have a flux density of in the absence of gravitational lensing magnification, one requires that
| (27) |
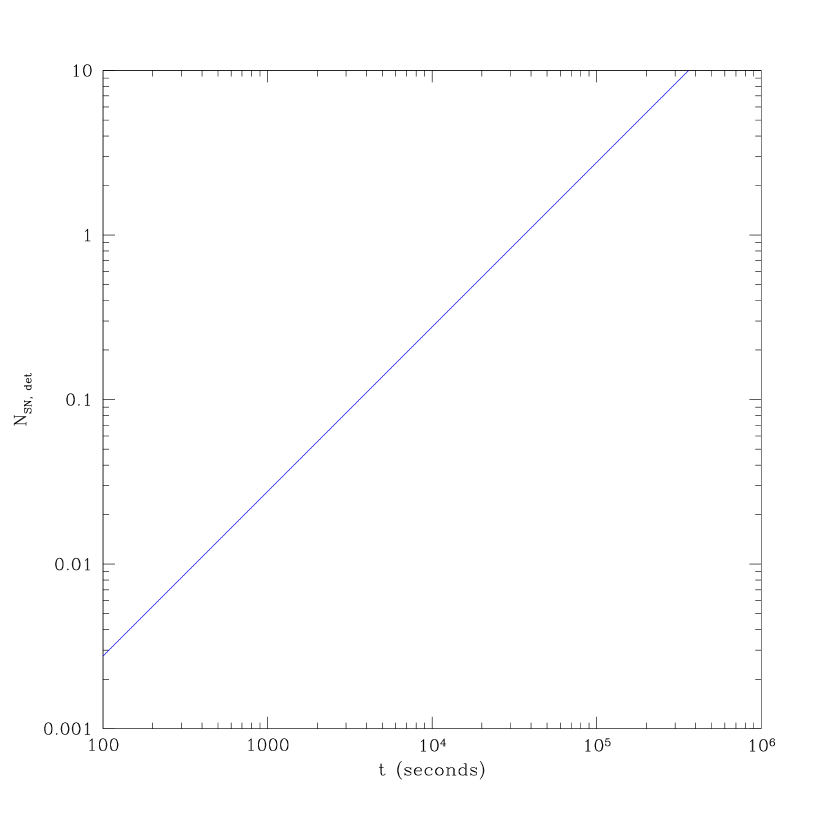
where point source confusion limit is removed; is integration time in seconds. We plot the number of hypernovae, , per field of view detected at confidence level against integration time in Figure 13, assuming giving unlensed flux density of at the observed wavelength of several . To put the matter in perspective, 1,000 target fields each with k-second integration time would detect multiply lensed Pop III hypernovae at confidence level.
We note that since only highly magnified Pop III hypernovae will be observable, the observed candidates should have distinct features: the multiple images will significantly help the identification process. If the cluster lens is known, its lens potential derived independently elsewhere would further constrain the image configurations. Once such images are found, periodic monitoring up to a few years would eventually verify the transient nature of the Pop III hypernovae. Since the total number of detectable hypernovae is just proportional to the total integration time, one could choose an optimal strategy such that the observation is most sensitive to the expected splittings of the images: a shorter exposure will require a higher magnification from a more central region of the lens, where splittings may decrease due to a smaller velocity dispersion at the center of the cluster.
At a flux density of a level nJy, Pop III hypernovae will be detectable by JWST (Stockman & Mather 2000) without gravitational lensing magnification. The possible observable duration of yrs for the initial bright phase of Pop III hypernovae, corresponding to d intrinsic duration (Woosley & Weaver 1996) will be a signature.
5.5 Effects on the Cosmic Microwave Background
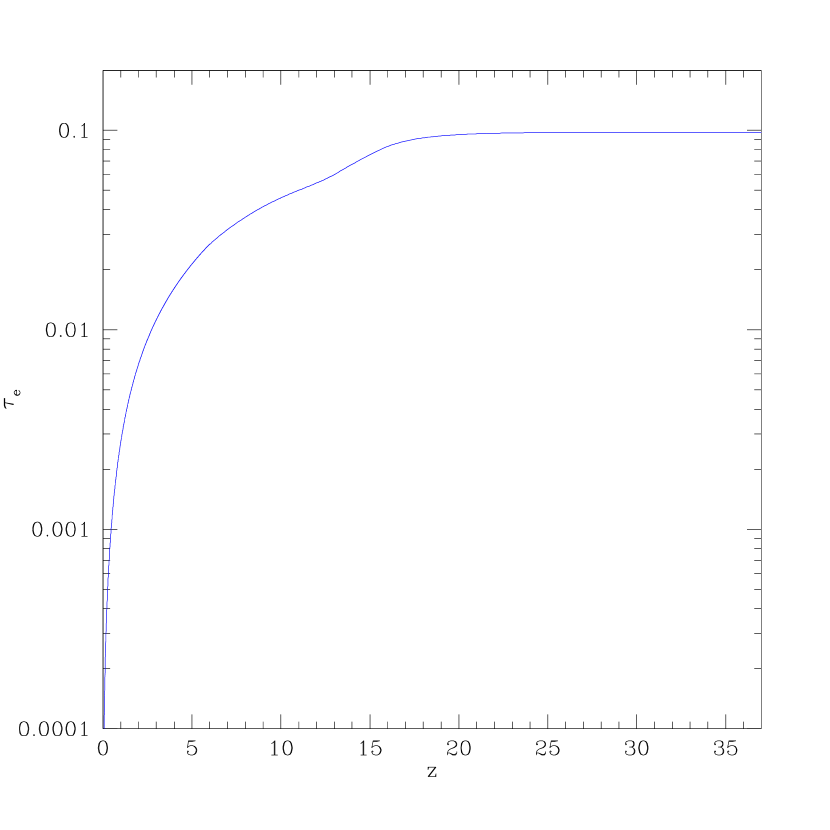
The earlier reionization would significantly increase the electron Thomson scattering optical depth. This is so because the IGM ionization fraction remains appreciable during the period between the first reionization () and the second reionization (). Figure 16 shows the cumulative Thomson scattering optical depth as a function of redshift. We see that the Thomson scattering optical depth increases from to . Evidently, the first reionization boosts the optical depth of the second reionization by a factor of , making the total Thomson optical depth much more significant. Given the narrow allowed range of the first reionization epoch between (Figure 8), our prediction of [where is approximately estimated considering uncertainties on , , and ] is fairly robust, unless the ionizing photon escape fraction from the Pop III galaxies is extremely small compared to what is required at to reionize the universe (Figure 7). The implications for the CMB (for an excellent recent review see Hu & Dodelson 2002), in particular, for polarization of the CMB (e.g., Seljak 1997; Zaldarriaga 1997; Kamionkowski et al. 1997) is significant.
We will follow the recent analysis by Kaplinghat et al. (2002) on the detectability of polarization of the CMB. Kaplinghat et al. (2002) show that the Microwave Anisotropy Probe (MAP) satellite will be able to measure to an accuracy of (). Thus it appears that MAP will be able to distinguish the two reionization scenarios at about confidence level: the standard reionization scenario where the universe is fully ionized at and fully neutral at (giving ) versus the reionization scenario presented here where the universe is fully ionized at and partially ionized at (giving ). According to Kaplinghat et al. (2002) Planck surveyor will probably be able to probe the detailed reionization history in addition to discriminating between the standard reionization model and the current reionization model at a very high confidence level.
5.6 Non-detection of Pop III Stars Locally
There is a long history of search for Pop III stars (Bond 1970,1981; Hills 1982; Bessell & Norris 1984,1987; Carr 1987; Cayrel 1996; McWilliam et al. 1995; Ryan, Norris, & Beers 1996; Rossi, Beers, & Sneden 1999; Beers 2000; Norris, Ryan, & Beers 1997,2001; Norris et al. 2002; Hill et al. 2002; Depagne et al. 2002) or primeval galaxies (Partridge 1974; Davis & Wilkinson 1974). If Pop III stars are as massive as suggested, perhaps it is not surprising that no single Pop III star should have been found, while over 100 metal-poor stars with have been found (Cayrel 1996), since all Pop III stars would end either as supernovae or black holes. The proposed model, unfortunately, would mark the end of search for Pop III stars in the local universe.
5.7 Detectability of Galaxies Beyond
It is interesting to note, from Figure 9, that there is a substantial redshift range beyond the end redshift of the second reionization , where the IGM is already substantially ionized. For example, at . This feature of an extended redshift interval of high ionization appears to be generic. This result would have interesting consequences on the observability of galaxies beyond the second reionization epoch. Taking the result at face value, for a galaxy at , the Strömgren sphere produced by the galaxy will be a factor of about 2 larger than that with the case where the galaxy is embedded in a completely neutral IGM. This would help reconcile the seemingly conflicting observational claims: on one hand, the universe appears to be reionized at when ionizing radiation background is seen to rise sharply (e.g., Fan et al. 2001; Becker et al. 2001, Barkana 2001; Cen & McDonald 2002); on the other hand, Ly galaxies at redshift as high as (Hu et al. 2002; Kodaira et al. 2003) has been detected (see Haiman 2002 for an alternative explanation). The optical depth due to the damping wing of neutral hydrogen outside the Strömgren is in general reduced by a factor of (Miralda-Escude & Rees 1998; Cen & Haiman 2000; Madau & Rees 2000), which is a factor of for . One prediction is that the number of observable Ly galaxies would quickly thin out beyond , due to the combined effect of a rapid increase of neutral fraction beyond (see Figure 9) and a decrease of the number of large Ly galaxies. More detailed treatment of this important subject will be done in a separate paper. Observational campaign by several groups (Hu et al. 2002; Rhoads et al. 2001; Ajiki et al. 2002) to detect high redshift Ly galaxies may be able to probe the detailed reionization structure near the end of the second cosmological reionization.
5.8 Hydrogen 21cm Line due to Minihalos Prior to the Second Cosmological Reionization: A Test
The possibility of probing the high-z universe with hydrogen 21 cm line absorption or emission has been suggested and investigated in various contexts by many authors (Hogan & Rees 1978; Scott & Rees 1990; Subramanian & Padmanabhan 1993; Kumar, Padmanabhan, & Subramanian 1995; Bagla, Nath, & Padmanabhan 1997; Madau, Meikien, & Rees 1997; Shaver et al. 1999; Tozzi et al. 2000; Carilli, Gnedin, & Owen 2002; Iliev et al. 2002; Furlanetto & Loeb 2002). The mean, neutral medium expanding with the Hubble flow at redshift would produce an optical depth for the hydrogen 21 cm resonant absorption is (Shklovsky 1960)
| (28) |
where is the Hubble constant at redshift ; is the mean atomic hydrogen number density at ; and are the statistical weights of the lower and upper hyperfine levels; is the frequency of the hydrogen 21cm line; is the spin temperature of the atomic hydrogen; is the frequency of the 21 cm line; is the speed of light; is the Boltzmann’s constant; is the spontaneous decay rate of the hyperfine transition of atomic hydrogen; and are total matter and baryonic matter density at in units of closure density; km/s/Mpc, where is the Hubble constant at . Clearly, the uniform medium would only cause a very modest absorption at .
Minihalos would cast significantly larger optical depth. For 21cm absorption by atomic hydrogen in virialized minihalos we may rewrite Equation (30) approximately as:
| (29) |
where and are the virial radius and velocity dispersion within the virial radius, respectively; the factor is the relative overdensity of matter within the virial radius. Using relations , [where is the mean total density at ] and the definition of Hubble constant, we can transform Equation (31) to
| (30) |
We see that gaseous minihalos with , if they exist, could produce significant optical depths at 21 cm at a level of (Furlanetto & Loeb 2002; see also Carilli, Gnedin & Owen 2002 for a numerical treatment). Note that the spin temperature would be bracketed by the cosmic microwave background temperature and the kinetic temperature (approximately the virial temperature) of a minihalo.
Furlanetto & Loeb (2002) have pointed out that the 21 cm forest produced by minihalos prior to cosmological reionization will be detectable by the next generation of low-frequency radio telescopes, such as Low Frequency Array (LOFAR) and Square Kilometer Array (SKA). However, this will only be possible, if the minihalos could retain their gas, as they would in the conventional reionization scenario. In the reionization scenario presented here, as indicated in Figure 14, no significant amount of gas will be able to accumulate in minihalos throughout the second reionization period. Consequently, in our scenario, 21 cm forest lines, which would otherwise be produced by minihalos without the first reionization, have been largely wiped out. It is noted that 21 cm absorption measurements would require bright background radio sources to be present at very high redshift.
Similarly, all hydrogen 21 cm emission line forest due to minihalos, as many as lines per unit redshift at , as predicted by Iliev et al. (2002) in the standard reionization scenario, will be absent in the present reionization scenario. In addition, the 21 cm emission spatial and spectral signature at (Madau et al. 1997; Tozzi et al. 2000) will also be significantly altered in the sense that signals due to minihalos will be removed.
Hydrogen 21 cm observations, either in absorption or emission, will be a definitive test to distinguish between the two reionization scenarios.
5.9 Metal Absorption Lines at : A Probe of the Second Reionization Process and Initial Metal Enrichment History
Oh (2002) pointed out that some metal absorption lines may be observable at high redshift. He identified OI () and SiII () lines, longward of the hydrogen Ly line, as the best candidates for tracing neutral hydrogen due to the proximity of their ionizational potentials to the hydrogen ionization potential. Since both these metal species trace closely the neutral hydrogen density, OI and SiII absorption forest may provide a way to probe the reionization history. Two possible utilizations are noted here. First, both OI and SiII absorption forests are expected to thin out at , which could provide a direct probe of the end of the second reionization process. We note that, for IGM which is primarily metal enriched by Pop III stars, the overabundances of -elements such as oxygen and silicon relative to the solar value (Heger & Woosley 2002) would greatly increase the optical depth of the oxygen OI and SiII absorption forests, at the apparent low metallicity (defined by ). This would substantially increase the number of observable OI and SiII absorption lines predicted by Oh (2002). Second, the relative optical depths of OI and SiII absorption lines may shed light on the relative abundance of O to Si, giving useful information on synthesis in Pop III stars (Qian & Wassurberg 2000,2002). In addition, gradually increasing contribution from Pop II supernovae (type II) to the IGM metals with time may also show up in the redshift evolution of the relative optical depths of OI and SiII absorption lines, possibly providing information on the overall metal enrichment history of the universe at those early times.
5.10 Comparisons with Some Other Works
The author was made aware of an earlier paper by Wyithe & Loeb (2002), who investigated the reionization histories due to stars and quasars. They assume that minihalos do not form stars at the redshift of interest but systematically explore the 2-d parameter space spanned by the ionizing photon escape fraction and the transition redshift from a VMS IMF and a normal IMF. They pointed out that, for some restricted region in the parameter space, hydrogen and/or helium II may be reionized twice. The primary differences between their study and the current study are three-fold. First, we show that cooling thus star formation in minihalos takes place unimpeded, as long as gas is able to accrete onto them, whereas they do not consider star formation in minihalos. Second, we constrain the ionizing photon escape fraction directly using Ly forest observations. As a consequence, we show that it seems inevitable that the universe will be reionized first by Pop III stars either in minihalos or in large halos and second by Pop II stars. Finally, we use a new computational method to follow self-consistently the evolution of the entire IGM, including HII regions, HI regions and partially ionized regions. The two studies are, however, complementary in their different approaches.
Venkatesan, Tumlinson, & Shull (2003) also examined the consequences of Pop III metal-free stars on the reionization of the universe. They indicated the possibility of reionizing He II twice with an incomplete first attempt of reionizing He II.
Mackay, Bromm, & Hernquist (2002) presented a three-phase reionization picture. With a top-heavy VMS IMF, they pointed out that the first transition from molecular cooling phase to atomic cooling phase occurs at , when their demand of 10 Lyman-Werner photons per baryon is met. The proposed first transition in Mackay et al. (2002) is dictated by the lack of cooling in minihalos. We pointed out here positive feedback and as a result there is no such transition. Mackay et al. (2002) find that at the IGM has been enriched to a level of that the second transition to a normal IMF occurs. Their assessment of the transition epoch from Pop III to Pop II is consistent with but at a slightly higher redshift than our calculation. Their universe, however, is not reionized until . It is noted in passing that Mackay et al. (2002) pointed out a novel Pop II.5 stellar population associated with cooling shells of Pop III supernovae. In summary, the primary differences between this study and that by of Mackay et al. (2002) are two-fold. First, we indicated that the positive feedback mechanisms on formation allow star formation to occur in minihalos throughout the first reionization period up to . Second, we constrain the ionizing photon escape fraction by the direct Ly forest observations to eliminate this major uncertainty.
5.11 Uncertainties
Perhaps the most uncertain in the chain of derivation is the IMF of the Pop III stars. However, most of the main conclusions, including positive feedback of Pop III star formation and two times of cosmological reionization, are likely to hold for any sufficiently top-heavy IMF. While the simulations with sub-solar mass resolution (Abel et al. 2002; Bromm et al. 2002) have clearly shown the formation of Pop III VMS, it is yet unclear what the angular momentum transport mechanisms are. It is possible, in principle, that hydrodynamic processes, included in the quoted simulations, could transport the unwanted angular momentum outward, as the simulators have advocated. If local star formation is a guide, one could imagine that very massive Pop III stars may form in binaries or multiples, in which case angular momentum removal would be easily achieved. It is also intriguing to note that, if we extrapolate the observed ratio of super massive black hole to bulge mass (e.g., Tremaine et al. 2002), then one would expect to find a black hole of mass at the center of each minihalo of mass . Thus, perhaps one should not be too surprised that nature has managed to form a compact object (star) of mass formed at the center of a minihalo, if the quoted observations are any empirical guide; it may be argued, angular momentum-wise, that it is a less stringent task to collapse a higher density gas cloud at higher redshift to form a star than a lower density gas cloud at lower redshift to form a black hole, as observed.
We have ignored the possible contribution from quasars to the second reionization process. If the emission rate of ionizing photons from quasars is proportional to the star formation rate, as indicated by low redshift observations (Boyle & Terlevich 1998; Cavaliere & Vittorini 1998), then, to zero-th order, all that is needed is to renormalize such that the second reionization completes at and results would remain largely unchanged.
6 Conclusions
The conclusions of this paper consist of two sets.
I) We put forth two new mechanisms for generating a high X-ray background during the Pop III era. namely, X-ray emission from the cooling energy of Pop III supernova blast waves and from miniquasars powered by Pop III black holes. We show, consequently, formation in the cores of minihalos is significantly induced, more than enough to compensate for destruction by Lyman-Werner photons produced by the same Pop III stars. In addition, another, perhaps dominant process for producing a large number of molecules in relic HII regions created Pop III galaxies, first pointed out RGS, is quantified here. We show that molecules produced by this process may overwhelm the Lyman-Werner photons produced by the stars in the same Pop III galaxies. As a result, the Lyman-Werner background may never be able to build up to affect molecules in minihalos. In combination, we suggest that cooling and hence star formation in minihalos can continue to take place largely unimpeded throughout the first reionization period, as long as gas is able to accumulate in them.
II) We show that the intergalactic medium is likely to have been reionized twice, first at and second at . Under a very conservative assumption for the star formation efficiency in minihalos with cooling, the first reionization may be attributable largely to Pop III stars in large halos; in this case, processes promoting formation in the cores of minihalos such as mentioned above in (I) do not really matter. In contrast, if star formation efficiency in minihalos is not more than a factor of ten less efficient than in large halos, then Pop III stars in minihalos may be largely responsible for the first reionization. In either case, it seems likely that Pop III stars in minihalos make a large contribution to the first phase of the metal enrichment of the intergalactic medium approximately up to a level where the transition from Pop III stars to Pop II stars occurs.
This apparent inevitability of twice reionizations is reached, based on a joint constraint by two observational facts: 1) the universe is required to be reionized at and 2) the density fluctuation in the universe at is well determined by the same small-scale power traced by the Ly forest observed and well measured at . As a result, the product of star formation efficiency and ionizing photon escape fraction from galaxies at high redshift is well constrained, dictating the fate of the cosmological reionization process.
The prolonged reionization and reheating history of the IGM is more complicated than usually thought. Because both cooling and recombination time scales are much shorter than the Hubble time at the redshift in question, we devise a new, improved computational method to follow the evolution of the IGM in all phases, including HII regions, HI regions and partially ionized regions. The overall reionization process may be separated into four joint stages.
(1) From to , Pop III stars gradually heat up and ionize the IGM and the first reionization occurs at the end of this stage, when the mean temperature of the IGM reaches K.
(2) The first stage is followed by a brief period with a redshift interval of order , where the IGM stays completely ionized due to sustained ionizing photon emission by forming Pop III stars. During this period, the temperature of the IGM is maintained at K.
(3) The transition from Pop III stars to Pop II stars sets in at the beginning of this stage (). The abruptly reduced (by a factor of ) ionizing photon emission rate causes hydrogen to rapidly recombine and the universe once again becomes opaque to Ly and Lyman continuum photons, marking the second cosmological recombination. From this time until Compton cooling by the cosmic microwave background and photoheating by the stars self-regulate the Jeans mass and the star formation rate. The mean temperature of the IGM is maintained at K from to . Meanwhile, recombination and photoionization balance one another such that the IGM stays largely ionized during this stage with . Most of the star formation in this period occurs in large halos with dominant atomic line cooling.
(4) At , the global star formation rate again surpasses the global recombination rate, resulting in the second reionization of the universe. The second reionization is predominantly due to stars formed in halos where atomic line cooling is efficient.
There is a wide range of interesting implications from this new reionization picture presented here. To highlight a few:
The Pop III stars enrich the IGM with a metallicity of at .
The magnetic field originating from massive stars could pollute the IGM with a large-scale coherent field (kpc comoving) of order G at .
The number density of Pop III massive black holes () is comparable to that of globular clusters and should seed later structure formation.
Direct detection of Pop III hypernovae/supernovae are very difficult but a systematic search for gravitational lensing magnified Pop III hypernovae/supernovae targeted at massive clusters of galaxies may turn out to be fruitful; SIRTF may be able to detect them. SIRTF may also be able to detect some of the large Pop III galaxies. JWST should be able to detect both large Pop III galaxies and Pop III hypernovae.
The Thomson scattering optical depth is increased to (compared to for the case of only one rapid reionization at ), which will have significant implications on the polarization observations of the cosmic microwave background. Upcoming MAP results should be able to distinguish between these two scenarios.
Under the present scenario it would not have been a surprise that no Pop III stars have been found in the local universe.
The IGM, while opaque to Ly photons, is highly ionized () up to redshift . This may reconcile the observation indicating the second reionization at with the detection of Ly galaxies at .
Finally, in contrast to the conventional reionization scenario, 21 cm lines prior to , which would otherwise be produced by minihalos in the absence of the first cosmological reionization, are predicted not to exist. This would provide a definitive test of the scenario.
References
- (1)
- (2) Abel, T., Anninos, P., Zhang, Y., & Norman, M.L. 1997, NewA, 2, 181
- (3) Abel, T., Anninos, P., Norman, M.L., & Zhang, Y. 1998, ApJ, 508, 518
- (4) Abel, T., Norman, M.L., & Madau, P. 1999, ApJ, 523, 66
- (5) Abel, T., Bryan, G.L., & Norman, M.L., 2000, ApJ, 540, 39
- (6) Abel, T., Bryan, G.L., & Norman, M.L., 2002, Science, 295, 93
- (7) Ajiki, M., Taniguchi, Y., et al. 2002, ApJ, 576, L25
- (8) Bagla, J.S., Nath, B., & Padmanabhan, T. 1997, MNRAS, 289, 671
- (9) Bahcall, N.A., et al. 2002, astro-ph/0205490
- (10) Bahcall, N.A., Fan, X., & Cen, R. 1997, ApJ, 485, L53
- (11) Bahcall, N.A., & Cen, R. 1993, Astrophys. Lett., 407, L49
- (12) Barkana, R., & Loeb, A. 1999, ApJ, 523, 54
- (13) Barkana, R., & Loeb, A. 2000, ApJ, 539, 20
- (14) Barkana, R., & Loeb, A. 2001, Phys. Rep., 349, 125
- (15) Barkana, R., 2001, astro-ph/0108431
- (16) Barnes, J., & Efstathiou, G. 1987, ApJ, 319, 575
- (17) Becker, R.H., et al. 2001, astro-ph/0108097
- (18) Beers, T.C. 2000, The First Stars. Proceedings of the MPA/ESO Workshop, eds. A. Weiss, T.G. Abel, V. Hill (Springer).
- (19) Bessell, M.S., & Norris, J. 1984, ApJ, 285, 622
- (20) Bessell, M.S., & Norris, J. 1987, J. Astrophys. Astr., 8, 99
- (21) Bertschinger, E. 1986, ApJ, 304, 154
- (22) Bharadwaj, S., & Sethi, S.K. 2001, JApA, 22, 293
- (23) Blain, A.W., & Natarajan, P. 2000, MNRAS, 312, L35
- (24) Blandford, R.D, Kochanek, C.S., Kovner, I., & Narayan, R. 1989, Science, 245, 824
- (25) Bond, J.R., & Wadsley, J.W. 1997, preprint, astro-ph/9710102
- (26) Bond, J.R., Arnett, W.D., & Carr, B.J. 1984, ApJ, 280, 825
- (27) Bond, H.E. 1970, ApJS, 22, 117
- (28) Bond, H.E. 1981, ApJ, 248, 606
- (29) Bookbinder J, Cowie, L.L., Krolik, J.H., Ostriker, J.P., & Rees, M. 1980, ApJ, 237, 647
- (30) Boyle, B.J., & Terlevich, R.J. 1998, MNRAS, 293, L49
- (31) Bromm, V., Coppi, P.S., & Larson, R.B. 1999, ApJ, 527, L5
- (32) Bromm, V., Coppi, P.S., & Larson, R.B. 2002, ApJ, 564, 23
- (33) Bromm, V., Kudritzki, R.P., & Loeb, A. 2001, ApJ, 552, 464
- (34) Bruzual, A.G. 2000, astro-ph/0011094
- (35) Bullock, J.S., Dekel, A., Kolatt, T.S., Kravtsov, A.V., Klyping, A.A., Porciani, C., & Primack, J.R. 2001, ApJ, 555, 240
- (36) Burke, J.R., & Silk, J. 1974, ApJ, 190, 1
- (37) Carilli, C.L., Gnedin, N.Y., & Owen, F. 2002, ApJ, 577, 22
- (38) Carlberg, R.G. 1981, MNRAS, 197, 1021
- (39) Carr, B.J. 1977, A& A, 60, 13
- (40) Carr, B.J., Bond, J.R., & Arnett, 1984, ApJ, 277, 445
- (41) Carr, B. 1987, Nature, 326, 829
- (42) Cavaliere, A, & Vittorini, V. 1998, in The Young Universe, ed. S. D’Odorico, A. Fontana, & E. Giallongo (Astron. Soc. Pac., San Francisco), p26
- (43) Cayrel, R. 1996, Astron. Astrophys. Rev. 7, 217
- (44) Cen, R. 2002, ApJS, 141, 211
- (45) Cen, R., & Haiman, Z. 2000, ApJ, 542, L75
- (46) Cen, R., & McDonald, P. 2002, ApJ, 570, 457
- (47) Cen, R., & Ostriker, J.P. 1993, ApJ, 417, 404
- (48) Cen, R., Miralda-Escudé, J., Ostriker, J.P., & Rauch, M. 1994, ApJ, 437, L9
- (49) Cen, R., Dong, F., Bode, P.W., & Ostriker, J.P. 2003, in preparation
- (50) Cen, R., Gott, J.R., III, Ostriker, J. P., & Turner, E.L. 1994a, ApJ, 423, 1
- (51) Cen, R., Ostriker, J.P., Prochaska, J.X., Wolfe, A.M. 2001, in preparation
- (52) Chevalier, R.A., 1974, ApJ, 188, 501
- (53) Chevalier, R.A., 1982, ApJ, 258, 790
- (54) Chevalier, R.A., Imamura, J.N. 1982, ApJ, 261, 543
- (55) Cioffi, D.F., McKee, C.F., & Bertschiner, E. 1988, ApJ, 334, 252
- (56) Cole, S., & Lacey, C. 1996, MNRAS, 281, 716
- (57) Cox, D.P. 1972, ApJ, 178, 159
- (58) Couchman, H.M.P., & Rees, M.J. 1986, MNRAS, 221, 53
- (59) Davis, M., & Wilkinson, D.T. 1974, ApJ, 192, 251
- (60) Deharveng, J.-M., Buat, V., Le Brun, B., Milliard, B., Kynth, D., Shull, J.M., & Gry, C. 2001, A&A, 375, 805
- (61) Del Popolo, A. 2001, MNRAS, 325, 1190
- (62) Depagne, E., et al. 2002, A&A, 390, 187
- (63) Dove, J.B., & Shull, J.M. 1994, ApJ, 430, 222
- (64) Dove, J.B., Shull, J.M., & Ferrara, A. 2000, ApJ, 531, 846
- (65) Draine, B.T., & McKee, C.F. 1993, ARAA, 31, 373
- (66) Draine, B.T., & Salpeter, E.E. 1979, ApJ, 231, 438
- (67) Efstathiou, G. 1992, MNRAS, 256, 43
- (68) El Eid, M.F., Fricke, K.J., Ober, W.W. 1983, A& A, 119, 54
- (69) Elvis, M., Wilkes, B.J., McDowell, J.C., Green, R.F., Bechtold, J., Willner, S.P., Oey, M.S., Polomski, E., & Cutri, R. 1994, ApJS, 95, 1
- (70) Falle, S.A.E.G. 1975, MNRAS, 172, 55
- (71) Falle, S.A.E.G. 1981, MNRAS, 195, 1011
- (72) Fan, X., et al. 2001, astro-ph/0108063
- (73) Ferrara, A. 1998, ApJ, 499, L17
- (74) Field, G.B., Somerville, W.B., & Dressler, K. 1966, ARAA, 4, 207
- (75) Franceschini, A., De Zotti, G., Toffolatti, L., Mazzei, P., &, Denese, L. 1991, A & A Suppl., 89, 285
- (76) Fukugita, M., & Kawasaki, M. 1994, MNRAS, 269, 563
- (77) Fukugita, M., & Turner, E.L. 1991, MNRAS, 253, 99
- (78) Fuller, T.M., & Couchman, H.M.P. 2000, ApJ, 544, 6
- (79) Furlanetto, S.R., & Loeb, A. 2002, astro-ph/0206308
- (80) Glatzel, W., Fricke, K.J., & El Eid, M.F. 1985, A& A, 149, 413
- (81) Glover, S.C.O., & Brand, P.W.J.L. 2002, astro-ph/0205308 (GB)
- (82) Gnedin, N.Y. 2000a, ApJ, 535, 530
- (83) Gnedin, N.Y. 2000b, ApJ, 542, 535
- (84) Gnedin, N.Y., & Abel, T. 2001, NewA, 6, 437
- (85) Gnedin, N.Y., & Ostriker, J.P. 1997, ApJ, 486, 581
- (86) Gunn, J.E., & Gott, J.R., III 1972, ApJ, 176, 1
- (87) Haiman, Z. 2002, ApJ, 576, L1
- (88) Haiman, Z., Abel, T., & Rees, M.J. 2000, ApJ, 534, 11 (HAR)
- (89) Haiman, Z., & Loeb, A. 1997, ApJ, 483, 21
- (90) Haiman, Z., Abel, T., & Madau, P. 2001, 551, 599
- (91) Haiman, Z., Rees, M.J., & Loeb, A. 1996, ApJ, 467, 522
- (92) Haiman, Z., Thoul, A.A, & Loeb, A. 1996, ApJ, 464, 538
- (93) Hartquist, T.W., & Cameron, A.G.W. 1977, Astrophys. Space. Sci., 48, 145
- (94) Heckman, T.M., Sembach, K.R., Meurer, G.R., Leitherer, C., Calzetti, D., & Martin, C.L. 2001, ApJ, 558, 56
- (95) Heger, A., & Woosley, S.E. 2002, ApJ, 567, 532
- (96) Helfand, D.J., & Moran, E.C. 2001, ApJ, 554, 27
- (97) Hernquist, L., Katz, N., Weinberg, D.H., & Miralda-Escudé 1996, ApJ, 457, L51
- (98) Hill, V., et al. 2002, A&A, 387, 560
- (99) Hills, J.G. 1982, ApJ, 258, L67
- (100) Hinshaw, G., & Krauss, L.M. 1987, ApJ, 320, 468
- (101) Hirasawa, T., Aizu, K., & Taketani, M. 1969, Prog. Th. Phys. 41, 835
- (102) Hogan, C., & Layzer, D. 1977, ApJ, 212, 360
- (103) Hogan, C., & Rees, M.J. 1979, MNRAS, 188, 791
- (104) Hu, W., & Dodelson, S. 2002, ARAA, 40, 171
- (105) Hu, E.M., COwie, L.L., McMahon, R.G., Capak, P., Iwamuro, F., Kneib, J.-P., Maihara, T., & Motohara, K. 2002, ApJ, 568, L75
- (106) Hughes, S.A. 2002, MNRAS, 331, 805
- (107) Hui, L., & Gnedin, N. Y. 1997, MNRAS, 292, 27
- (108) Hurwitz, M., Jelinsky, P., & Dixon, W.V.D. 1997, ApJ, 481, L31
- (109) Hutchins, J.B. 1976, ApJ, 205, 103
- (110) Iliev, I.T., Shapiro, P.R., Ferrara, A., & Martel, H. 2002, ApJ, 572, L123
- (111) Kaiser, N. 1991, 383, 104
- (112) Kamionkowski, M., Kosowsky, A., & Stebbins, A. 1997, Phys. Rev., D55, 7368
- (113) Kaplinghat, M., Chu, M., Haiman, Z., Holder, G.P., Knox, L., & Skordis, C. 2002, astro-ph/0207591
- (114) Kehoe, R., et al. 2001, ApJ, 554, L159
- (115) Kessel-Deynet, O., & Burkert, A. 2000, MNRAS, 315, 713
- (116) Kochanek, C.S. 1995, ApJ, 453, 545
- (117) Kodaira, K., Taniguchi, Y., et al. 2003, astro-ph/0301096
- (118) Kulsrud, R., Cen, R., Ostriker, J.P., & Ryu, D. 1997, ApJ, 480, 481
- (119) Kumar, A., Padmanabhan, T., & Subramanian, K. 1995, MNRAS, 272, 544
- (120) Larson, R.B. 1986, MNRAS, 218, 409
- (121) Larson, R.B. 1995, MNRAS, 272, 213
- (122) Larson, R.B. 2000, in Star Formation from Small to the Large Scale, ed. F. Favata, A.A. Kaas, & A. Wilson (Noordwijk: ESA), p13
- (123) Lepp, S., & Shull, J.M. 1984, ApJ, 280, 465
- (124) Litz, A., Hui, L., Zaldarriaga, M., & Scoccimarro, R. 2002, astro-ph/0111346, ApJ, in press
- (125) Luck, R.E., & Bond, H.E. 1985, ApJ, 292, 559
- (126) Mac Low, M.-M., & Ferrara, A. 1999, ApJ, 513, 142
- (127) Machacek, M.E., Bryan, B.L., & Abel, T. 2001, ApJ, 548, 509
- (128) Mackay, J., Bromm, V., & Hernquist, L. 2002, astro-ph/0208447
- (129) Madau, P. 2002, astro-ph/0210268
- (130) Madau, P., & Rees, M.J. 2000, ApJ, 542, L29
- (131) Madau, P., & Rees, M.J. 2001, ApJ, 551, L27
- (132) Madau, P., Haardt, F., & Rees, M.J. 1999, ApJ, 514, 648
- (133) Madau, P., Meiksin, A., & Rees, M.J. 1997, ApJ, 475, 429
- (134) Magorrian, J., et al. 1998, AJ, 115, 2285
- (135) Mao, S. 1991, ApJ, 380, 9
- (136) Matsuda, T., Sato, H., & Takeda, H. 1969, Prog. Th. Phys., 42, 219
- (137) McKee, C.F., & Ostriker, J.P. 1977, ApJ, 218, 148
- (138) McWilliam, A., Preston, G.W., Sneden, C., & Searle, L. 1995, AJ, 109, 2757
- (139) Menou, K., Haiman, Z., & Narayanan, V.K. 2001, ApJ, 558, 535
- (140) Merritt, D., & Ferrarese, L. 2001, ApJ, 545, 847
- (141) Miralda-Escudé, J., Cen, R., Ostriker, J.P., & Rauch, M. 1996, ApJ, 471, 582
- (142) Miralda-Escudé, J., Gould, A. 2000, ApJ, 545, 847
- (143) Miralda-Escudé, J., Haehnelt, M., & Rees, M.J. 2000, ApJ, 530, 1
- (144) Miralda-Escudé, J., & Rees, M.J. 1998, ApJ, 497, 21
- (145) Moore, B., et al. 1999, MNRAS, 310, 1147
- (146) Mori, M., Ferrara, A., & Madau, P. 2002, ApJ, 571, 40
- (147) Nakamura, F., & Umemura, M. 1999, ApJ, 515, 239
- (148) Nakamura, F., & Umemura, M. 2001, ApJ, 548, 19
- (149) Nakamura, F., & Umemura, M. 2002, ApJ, 569, 549
- (150) Nakamura, T., Umeda, H., Iwamoto, K., Nomoto, K., Hashimoto, M.-A.,Hix, W.R., & Thielemann, F.-K. 2001, ApJ, 555, 880
- (151) Narayan, R., & Grossman, S. 1989, in Gravitational Lenses, ed. J.M. Moran, J.N. Hewitt, & K.-L. Lo (Berlin: Springer-Verlag), 31
- (152) Narayan, R., & White, S.D.M. 1988, MNRAS, 231, 97
- (153) Navarro, J.F., Frenk, C.S., & White, S.D.M. 1997, ApJ, 490, 493
- (154) Norman, M.L., Paschos, P., & Abel, T. 1998, MmSAI, 69, 455
- (155) Norris, J.E., Ryan, S.G., & Beers, T.C. 1997, ApJ, 488, 350
- (156) Norris, J.E., Ryan, S.G., & Beers, T.C. 2001, ApJ, 561, 1034
- (157) Norris, J.E., Ryan, S.G., Beers, T.C., Aoki, W., & Ando, H. 2002, ApJ, 569, L107
- (158) Ober, W.W., El Eid, M.F., & Fricke, K.J. 1983, A& A, 119, 61
- (159) Oh, S.P. 2001, ApJ, 553, 499
- (160) Oh, S.P. 2002, astro-ph/0201517
- (161) Oh, S.P., & Haiman, Z. 2002, ApJ, 569, 558
- (162) Oh, S.P., Nollett, K.M., Madau, P., & Wasserburg 2001, ApJ, 562, L1
- (163) Omukai, K., & Nishi, R. 1998, ApJ, 508, 141
- (164) Ostriker, J.P., & Cowie, L.L. 1981, ApJ, 243, L127
- (165) Ostriker, J.P., & Gnedin, N.Y. 1996, ApJ, 472, L63
- (166) Ostriker, J.P., & McKee, C.F. 1988, Rev. Mod. Phys. 60, 1
- (167) Ostriker, J.P., & Silk, J. 1973, ApJ, 184, L113
- (168) Padoan, P., Jimenez, R., & Jones, B. 1997, MNRAS, 285, 711
- (169) Palla, F., Salpeter, E.E., & Stahler, S.W. 1983, ApJ, 271, 632
- (170) Panaitescu, A., Kumar, P., & Narayan, R. 2001, ApJ, 561, L171
- (171) Partridge, R.B. 1974, ApJ, 192, 241
- (172) Peebles, P.J.E. 1969, ApJ, 155, 393
- (173) Peebles, P.J.E. 1993, Principles of Physical Cosmology (Princeton: Princeton University Press)
- (174) Peebles, P.J.E. 1997, Proceedings of the National Academy of Sciences of the United States of America, Volume 95, Issue 1, pp. 67-71
- (175) Peebles, P.J.E., & Dicke, R.H. 1968, ApJ, 154, 891
- (176) Press, W.H., & Schechter, P. 1974, ApJ, 187, 425
- (177) Qian, Y.-Z., Sargent, W.L.W., & Wasserburg, G.J. 2002, ApJ, 569, L61
- (178) Qian, Y.-Z., & Wasserburg, G.J. 2001, ApJ, 549, 337
- (179) Qian, Y.-Z., & Wasserburg, G.J. 2002, ApJ, 567, 515
- (180) Rakavy, G., Shaviv, G., & Zinamon, Z. 1967, ApJ, 150, 151
- (181) Razoumov, A.O., & Scott, D. 1999, MNRAS, 309, 287
- (182) Rees, M.J. 1984, ARAA, 22, 471
- (183) Rees, M.J. 1990, Science, 247, 817
- (184) Rees, M.J., & Meszaros, P. 1992, MNRAS, 258, 41p
- (185) Rees, M. 1994, in Cosmical Magnetism, ed. D. Lynden-Bell (Kluwer: Dordrecht), 155
- (186) Rhoads, J.E., Malhotra, S., Dey, A., Stern, D, Spinrad, H., & Jannuzi, B.T. 2001, ApJ, 545, L85
- (187) Ricotti, M., Gnedin, N.Y., & Shull, J.M. 2001, 560, 580 (RGS)
- (188) Ricotti, M., & Shull, J.M. 2000, 542, 548
- (189) Rossi, S., Beers, T.C., & Sneden, C. 1999, in The Third Stromlo Symposium: The Galactic Halo, eds. B.K. Gibson, T.S. Axelrod,and M.E. Putman, p265
- (190) Ryan, S.G., Norris, J.E., & Beers, T.C. 1996, ApJ, 471, 254
- (191) Salpeter, E.E. 1955, ApJ, 121, 161
- (192) Saslaw, W.C., & Zipoy, D. 1967, Nature, 216, 976
- (193) Schaerer, D. 2002, A& A, 382, 28
- (194) Schwarzschild, M., & Spitzer, L. 1953, Observatory, 73, 77
- (195) Scott,D., & Rees, M.J. 1990, MNRAS, 247, 510
- (196) Sedov, L.I. 1959, Similarity and Dimensional Methods in Mechanics (New York: Academic Press)
- (197) Seljak, U. 1997, ApJ, 482, 6
- (198) Shapiro, P.R., & Giroux, M.L. 1987, ApJ, 321, L107
- (199) Shapiro, P.R., & Kang, H. 1987, ApJ, 318, 32
- (200) Shapiro, P.R., Raga, A.C., & Mellema, G. 1997, Structure and Evolution of the Intergalactic Medium from QSO Absorption Line Systems (Proceedings of the 13th IAP Astrophysics Colloquium), eds. P. Petitjean and S. Charlot, pp. 41 -45
- (201) Shaver, P.A., Windhorst, R.A., Madau, P., & de Bruyn, A. 1999, A&A, 345, 380
- (202) Shull, J.M., et al. 1980, AJ, 237, 769
- (203) Shull, J.M., et al. 1999, AJ, 118, 1450
- (204) Shchekinov, Y.A., & Edelman, M.A. 1978, Sov. Astro. Lett., 4, 234
- (205) Shklovsky, I.S. 1960, “Cosmic Radio Waves” (Harvard University Press: Cambridge)
- (206) Shklovsky, I.S. 1968, Supernovae (New York: Interscience Publishers)
- (207) Sigurdsson, S., & Rees, M.J. 1997, MNRAS, 284, 318
- (208) Silk, J. 1977, ApJ, 211, 638
- (209) Stahler, S.W. 1986, PASP, 98, 1081
- (210) Stecher, T.P., & Williams, D.A. 1967, ApJ, 149, L29
- (211) Steidel, C.C., Giavalisco, M., Pettini, M., Dickinson, M., & Adelberger, K.L. 1996, ApJ, 462, L17
- (212) Steinmetz, M., & Bartelmann, M. 1995, MNRAS, 272, 570
- (213) Stockman, H.S., & Mather, J.C. 2000, Imaging the Universe in Three Dimensions: Proceedings from ASP Conference Vol. 195, eds. W. van Breugel and J. Bland-Hawthorn, p 415
- (214) Subramanian, K., Cen, R., & Ostriker, J.P. 2000, ApJ, 538, 528
- (215) Subramanian, K., & Padmanabhan, T. 1993, MNRAS, 265, 101
- (216) Sutherland, R.S., & Dopita, M.A. 1993, ApJS, 88, 253
- (217) Syer, D., & White, S.D.M. 1996, astro-ph/9611065
- (218) Takeda, H., Sato, H., & Matsuda, T. 1969, Prog. Th. Phys., 41, 840
- (219) Tarbet, P.W., & Rowan-Robinson, M. 1982, Nature, 298, 711
- (220) Taylor, G.I. 1950, Proc. Roy. Soc. London, A, 101, 159
- (221) Tegmark, M., Silk, J., Rees, M.J., Blanchard, A., Abel, T., & Palla, F. 1997, ApJ, 474, 1
- (222) Terlevich, R., Tenorio-Tagle, G., Franco, J., & Melnick, J. 1992, MNRAS, 255, 713
- (223) Theuns, T., Leonard, A., Efstathiou, G., Pearce, F.R., & Thomas, P.R. 1998, MNRAS, 301, 478
- (224) Theuns, T.T., Viel, M., Kay, S., Schaye, J., Carswell, R.F., & Tzanavaris, P., 2002, astro-ph/0208418
- (225) Tielens, A.G.G.M., Seab, C.G., Hollenbach, D.J., & McKee, C.F. 1987, 319, L109
- (226) Tohline, J.E. 1980, ApJ, 239, 417
- (227) Tozzi, P., Madau, P., Meiksin, A., & Rees, M.J. 2000, ApJ, 528, 597
- (228) Tremaine, S., et al. 2002, ApJ, 574, 740
- (229) Tumlinson, J., & Shull, J.M. 2000, ApJ, 528, L65
- (230) Turner, E.L. 1980, ApJ, 242, L135
- (231) Turner, E.L., Ostriker, J.P., & Gott, J.R. III 1984, ApJ, 284, 1
- (232) Tyson, J.A. 1983, ApJ, 272, L135
- (233) Ueda, H., Shimasaku, K., Suginohara, T., & Suto, Y. 1994, PASJ, 46, 319
- (234) Umeda, H., & Nomoto, K. 2003, astro-0ph/0301315
- (235) Valageas, P., & Silk, J. 1999, A& A, 347, 1
- (236) Venkatesan, A., Tumlinson, J., & Shull, J.M. 2003, ApJ, in press, astro-ph/0206390
- (237) Vishniac, E. 1983, ApJ, 274, 152
- (238) Wallerstein, G. 1984, ApJ, 278, 663
- (239) Wasserburg, G.J., & Qian, Y.-Z. 2000, ApJ, 529, L21
- (240) Weinberg, S. 1972, ”Gravitation and Cosmology” (New York: John Wiley & Sons), p453
- (241) White, S.D.M. 1984, ApJ, 286, 38
- (242) Woosley, S.E. 1986, in Nucleosynthesis and Chemical Evolution, ed. B. Hauck, A. Maeder and G. Meynet (Switzerland: Geneva Obs), p1
- (243) Woosley, S.E., & Weaver, T.A. 1982, in Supernovae, eds. M.J. Rees and R.J. Stoneham (Dordrecht: Reidel), p79
- (244) Woosley, S.E., & Weaver, T.A. 1995, ApJS, 101, 181
- (245) Woosley, S.E., & Weaver, T.A. 1996, ARAA, 24, 205
- (246) Wyithe, S., & Loeb, A. 2002, astro-ph/0209056
- (247) Yoneyama, T. 1972, PASP, 24, 87
- (248) Yoshii, Y., & Sabano, Y. 1979, PASJ, 31, 505
- (249) Yoshii, Y., & Saio, H. 1986, ApJ, 301, 587
- (250) Zaldarriaga, M. 1997, Phys. Rev., D55, 1822
- (251) Zhang, Y., Anninos, P., & Norman, M.L. 1995, ApJ, 453, L57
- (252)
Appendix A Magnification of Pop III Sources by Gravitational Lensing
We determine the fraction of area in the background source plane at redshift , that is magnified by a factor of by foreground objects, primarily clusters of galaxies. The magnification regime in which we are interested is . We will first derive a general relationship between the magnification () and source plane coordinate (): for any singular density profile. Then, we will use the singular isothermal sphere thanks to its ease of analytic treatment, which has the same relation, to model clusters of galaxies to compute the gravitational lensing cross section at the high end. The computed lensing cross section is cross-checked by observations to ensure consistency.

We express the magnification as a function of , the source plane proper coordinate (Fig 13). It is well known that in the small , high limit, for both a point mass lens (Vietri & Ostriker 1983) and a singular isothermal sphere lens (SIS; Turner, Ostriker & Gott 1984). For simplicity we will consider only axisymmetric lenses. We will generalize this property of in the small , high limit to any lens system as long as the lensing bending angle, , as a function of proper impact parameter, , does not increase as fast as . It is noted that for a uniform mass sheet, constant for a SIS, and for a point mass. From Figure 15 we can readily write down the lens equation as:
| (A1) |
The above equation relates the angular position of the image, , to the position of the source, (both with respect to some reference direction) through the bending angle, . , and are the angular diameter distance between the observer and the source, between the observer and the lens, and between the lens and the source, respectively. is the proper impact parameter relative to the lens center. Expressing the bending angle as (), we can rewrite the above lens equation as:
| (A2) |
In the limit , the solution for the impact parameter is (Einstein radius), and . It is noted that the requirement is to guarantee a solution, i.e., the existence of an Einstein radius. Then, it is straightforward to show that, at small limit, the magnification is
| (A3) |
with the constant , independent of , being
| (A4) |
We note that, for any (centrally) singular density profile, is less than unity. It has been shown by Syer & White (1996) and Subramanian, Cen, & Ostriker (2000) that the density profile in the inner regions of dark matter halos, which are formed through hierarchical gravitational clustering/merging in the conventional Gaussian structure formation models, is , where is the linear power spectrum index at the relevant scales. For the scales of interest, we have to for cold dark matter models, giving to . These inner slopes of halos were borne out in N-body simulations (Navarro, Frenk, & White 1997; Moore et al. 1999). Thus, we should expect at small for halos formed in hierarchical structure formation models, including those of galaxy cluster size. Moreover, cooling and subsequent condensation of baryons in the centers of halos may further steepen the density profiles in the inner regions.
Having deduced the universal relation at the small end, we will now carry out further calculations by adopting the SIS model, because of its analytical simplicity and because of its astrophysical relevance as shown in many statistical studies (Gott & Gunn 1974; Tyson 1983; Turner et al. 1984; Hinshaw & Krauss 1987; Narayan & White 1988; Wu 1989; Fukugita & Turner 1991; Mao 1991). This is further justified if is normalized at a somewhat lower value, where some data from current observations exist. We note that, for individual multiply imaged observed quasars, it is clear that one needs to include ellipticities of the lenses for realistic modeling. For example, one cannot produce quadruples with an axisymmetric lens (Narayan & Grossman 1989; Blandford et al. 1989). However, for our purpose of calculating the magnification cross section at moderate-to-high range , the assumption of axisymmetry of lenses should be adequate. For a SIS the bending angle, , conveniently independent of impact parameter, is (Turner et al. 1984)
| (A5) |
where is the speed of light and is the line of sight velocity dispersion of the SIS lens. With equation (A5) we can solve equation (A2) with the following solution at the limit: and . Inserting this solution into equation (A3) yields the small limit of the relation for a SIS lens:
| (A6) |
A SIS would subtend a solid angle in the source plane within which the luminosity of a source is magnified by : . Thus, the total probability of a random source at of being magnified by can be obtained by adding up all the foreground lenses. This is done by integrating over lenses of all masses and over all redshifts up to the source redshift, , resulting in a double integral:
| (A7) |
where is the mass function of halos at redshift . To make the subsequent calculation more analytically tractable, we assume
| (A8) |
where
| (A9) |
is the differential cluster mass function at , taken from Bahcall & Cen (1993). is the observed cluster mass within the Abell radius (Mpc) and M⊙. The term is intended to approximately describe the evolution of the overall cluster mass function with redshift. The cluster mass, , defined within the Abell radius, , may be related to for the SIS model by
| (A10) |
where is the gravitational constant. Combining equations (A6) and (A10) indicates that . It is instructive to examine the behavior of the following term, , which contains all the dependence of the integrand of the integral in equation (A7) on . Since is constant at the low end and at the high end, the integral over in equation (A7) is convergent on both ends and dominated by massive clusters near the exponential downturn at about . Consequently, for our purpose, we need only to be accurate on the high mass end near the exponential downturn for and its redshift distribution characterized by parameter . Substituting equations (A6, A8, A9, A10) into equation (A7) [and making use of the simple relations in an universe: , , and ] yields
| (A11) | |||||
All constants in equation (A11) are in c.g.s. units, except , which is in Mpc. Note that we have also inserted a constant in equation (A11), which serves to absorb the uncertainties due to other factors which either cannot be accurately treated here or are unknown, including background cosmology, deviations of density profiles from singular isothermal spheres, gravitational lensing due to other astronomical objects and uncertainties in the observed cluster mass function. The normalization of will be set by comparing to observations at . Now expanding all the constants and integrating equation (A11) with respect to (), we obtain
| (A12) |
where . The integral can be done analytically (but the resultant expression is quite lengthy) and here we just give the final numbers for specific and . For , , for , respectively. It shows that only weakly depends on , because the integral is dominated by the moderate redshift range .
It is justified to only consider the large splitting events since the lensing cross section is dominated by massive clusters which give rise to large splittings (). For the sake of concreteness we will adopt , which is consistent with the relatively wild evolution of cluster density up to redshift about unity (e.g., Bahcall, Fan, & Cen 1997). As we will show below, the final results () turn out to be extremely weakly dependent on . Furthermore, we take to normalize :
| (A13) |
which gives . Since we are integrating the observed clusters to obtain the lensing probability and the same clusters are also responsible for observed gravitational lensing events, we can make a consistency check. For the Hewitt & Burbidge (1989) quasar catalog of 4250 quasars there are two confirmed multiple image lens systems with splitting , which corresponds to multiple lensing probability of (), i.e., for (in the singular isothermal sphere case). Thus, our adopted normalization is consistent with the observed value of for . Considering possible selection biases (Turner 1980; Cen et al. 1994a; Kochanek 1995) and the countervailing effect that the observed quasar sample is at significantly lower redshift than considered here, we argue that the adopted normalization is reasonable. From this we see that a random source at has a rather small probability of being very strongly lensed.
We will now examine the case where we do not sample the sky randomly, rather observe a set of selected regions centered on massive clusters. The cross section for magnification in the source plane is , so the solid angle within which the sources will be magnified by is . Integrating over a pre-selected set of clusters with mass in the redshift range to and dividing the integral by the number of clusters pre-selected gives the mean solid angle for source magnification .
| (A14) |
where is the total number of clusters selected (a normalization factor). Dividing the mean solid angle for source magnification by the field of view yields the mean probability of a source in such selected fields which will be magnified by :
| (A15) |
where is a telescope’s field of view. As an example, let us take , and , which yields , for , respectively, in an , km/s/Mpc universe. Similar to equation (A11), we can integrate equation (A14) for , , and and the result is: . Although an adjustment parameter in equation (A14), which is different from in equation (A11) to reflect the fact that the uncertainties involved are somewhat different (for example, since the probability is normalized per cluster, the uncertainty in the amplitude of the observed cluster mass function cancels out), for clarity and simplicity we adopt . The result indicates that is nearly independent of , unlike , which depends on , giving
| (A16) |
Comparing with , for the case with , for example, we see that one gains a factor of in the cluster centered survey compared to a random survey, for a field of view of arcmin2. The relative gain decreases with increasing size of the field of view, and the two probabilities become equal at 838 arcmin2, above which the calculation of is no longer valid due to multiple clusters in a single field. Note that, although the mean probability of a source within the field of view is inversely proportional to , the total number of magnified sources per field of view is (where is the surface density of source , which is either or in this study), which is independent of . The physical reason for having a relative increase in the probability of magnified sources is that the clusters of galaxies are rare targets and hence a random field of view has a small probability of intersecting a cluster. We note that is still valid even in the case of multiple clusters in a single field. However, the calculation of breaks down when multiple clusters are precisely aligned along the line of sight. But such cases are likely to be negligibly few. We further note that the spatial clustering of galaxy clusters would further boost the gain of over , but we will not consider this effect here.