Galaxy spectral parameterisation in the 2dF Galaxy Redshift Survey
Abstract
We investigate the physical significance of a new spectral parameter, . This parameter was defined based on a Principal Component Analysis of the 2dF Galaxy Redshift Survey, to retain astrophysical information while minimising the effect of measurement uncertainties. We find that while is correlated with morphological type, there is a large scatter in this relationship. A tighter empirical relationship is found between and the equivalent width of the H line, suggesting a connection with the star formation rate. We pursue this connection using spectral synthesis models. Using models in which the star formation history is parameterised in terms of an exponentially decreasing function of time, we find that there is a tight correlation between and the ratio of the present to the past-averaged rate of star-formation, often known as the “birthrate” parameter . This correlation also holds in models with much more complicated star formation histories, generated by a semi-analytic model of galaxy formation based upon the hierarchical formation scenario. There are two possible causes for the tight correlations we find, between and , in those galaxies with the most complex star formation histories; Firstly, the spectra themselves may be degenerate to the actual long-term star formation history of each galaxy in the optical wavelength range probed by the 2dFGRS. Secondly, the birthrate parameter may represent a physically fundamental quality of galaxy halos – their over-density relative to the background density – such that small- galaxies form in high peaks (which collapse early) while large- galaxies represent lower peaks, which collapse later. We conclude that the tight connection with makes a physically meaningful, as well as convenient and robust, statistic for galaxy parameterisation and classification.
keywords:
methods: statistical – galaxies: elliptical and lenticular, cD – galaxies: spiral1 Introduction
Galaxy redshift surveys are now probing the galaxy distribution of the local Universe more accurately than ever before, and in so doing they are establishing many fundamental properties of the galaxy population and its large-scale structure. The 2dF Galaxy Redshift Survey (2dFGRS) is one such ambitious project, conceived with the aim of mapping the galaxy distribution to an extinction corrected magnitude limit of . This particular survey is now essentially complete with approximately 230,000 galaxy spectra having already been acquired, and has already started to yield significant results (e.g. Percival et al. 2001; Madgwick et al. 2002 and others). In addition to this survey, the Sloan Digital Sky Survey (Strauss et al., 2002) is also underway, and once complete will obtain up to 1,000,000 individual galaxy spectra.
Apart from the main scientific goals of quantifying the large-scale structure of the Universe, one of the most significant contributions of galaxy redshift surveys is to our understanding of the galaxy population itself, through the information about galaxy properties contained in the observed spectra. Having a data set of 230,000 galaxy spectra — as in the case of the 2dFGRS — allows us to test the validity of galaxy formation and evolution scenarios with unprecedented accuracy. However, the sheer size of the data set presents its own unique problems. Clearly, in order to make the spectral data set more ‘digestible’, some form of data compression is necessary. Familiar statistics such as equivalent width measurements, morphological types, and broad-band colours are really just compression techniques in some sense. These quantities can be compared with theoretical predictions and simulations, and hence can set constraints on scenarios for galaxy formation and biasing.
The approach that has been adopted in Madgwick et al. (2002) is to define a spectral indicator, , based on Principal Component Analysis (PCA). Because of instrumental limitations, the flux calibration of the 2dF spectra is unreliable, and hence robust measurements of the shape of the spectral continua are not possible. For this reason, the statistic was designed to (in a loose sense) preserve the most discriminatory information in the spectra, while being robust to the instrumental uncertainties. Effectively, the parameter measures the strength of absorption and emission lines, while remaining insensitive to the slope of the continuum (or broad band colour).
The motivation of the definition of the statistic was in part pragmatic. The goal of this paper is to address the fundamental question of the physical significance of this parameter, in terms of how it relates to the physical properties of galaxies. A substantial amount of work has been carried out in the past on relating the observed spectra of galaxies to the physical processes occurring in them (see e.g Kennicutt, Tamblyn & Congdon 1994; Ronen, Arágon-Salamanca & Lahav 1999; Carter, Fabricant, Geller & Kurtz 2001 and references therein), and the advent of a large and uniform survey such as the 2dFGRS will result in many more advances in this field. However, for the present analysis we restrict ourselves to relating only the 2dFGRS spectral classification parameter, , to these processes and leave a fuller development of this subject for future works. The investigation presented here is particularly timely as many new results from the 2dFGRS are being presented which make exclusive use of this parameter to characterise and partition the galaxy population (e.g. Madgwick et al. 2002; Norberg et al. 2002; Martinez et al. 2002).
We make use of two kinds of models to pursue this question. In the first approach, we adopt a simple parameterisation to describe the star formation history of each galaxy in terms of an exponentially decreasing function of time. For a given redshift of observation, the star formation history is then characterised by a single parameter: the timescale of the exponential decline. These star formation histories are then convolved with spectral synthesis models, using the PEGASE (Projet d’Etude des GAlaxies par Synthese Evolutive) code, developed by Fioc & Rocca-Volmerange (1997). A particular advantage of this package compared to others available in the literature (e.g. Bruzual & Charlot 1993) is that it is possible to include modelling of nebular emission from star forming regions in each galaxy — an important ingredient in the calculation of the parameter. We refer to these models as the “simple” models, because of the rather simplified nature of the parametrised star formation histories.
The limitation of this simple method is that we must explicitly assume some family of star-formation histories for our galaxy population. We therefore extend this approach to incorporate the cosmological framework of the Cold Dark Matter (CDM) scenario, by using semi-analytic techniques (see e.g. Kauffmann, White & Guiderdoni 1993; Cole et al. 1994; Somerville & Primack 1999). We make use of a mock catalogue of synthetic spectra which was designed to match the selection criteria of the 2dFGRS, analysed previously in Slonim et al. (2001), and created using an updated version of the code described in Somerville & Primack (1999). There are several advantages of using a semi-analytic model to create spectra for this exercise. The star formation history of each galaxy will reflect at least some of the complexity of the interconnected processes of dark matter clustering, gas cooling, galaxy merging, supernova feedback, etc., modelled self-consistently within a specific cosmological framework. In addition, as we can select galaxies so as to reproduce the same redshift and luminosity distributions displayed by the observed 2dF galaxies, the resulting ensemble should contain a mix of galaxies with different sorts of star formation histories that is similar to the actual observed sample. Finally, the semi-analytic model also yields many other physical parameters for each galaxy, giving us the potential to further probe the physical processes that may be related to .
We find that in the simple models, there is essentially a one-to-one relationship between and the ratio of the present rate of star formation to its past time-averaged value. This quantity is sometimes known as the “birthrate” parameter, (Scalo 1986). Even more surprisingly, we find that there is a strong correlation between and even in the spectra produced by the semi-analytic models, despite the complex and diverse nature of the underlying star formation histories. Empirically, the parameter is known to be tightly correlated with morphological type and colour. We therefore argue that the parameter presents a practical and robust means of extracting a fundamental measure of galaxy type from the relatively low-quality spectra typical of present-day large redshift surveys.
Section 2 of this paper briefly reviews the operational definition of and motivation behind the spectral classification parameter , used in the 2dFGRS. In Section 3 we make use of the “simple” models based on exponentially declining star formation histories to show how is related to the star-formation history of a galaxy. Section 4 then generalises these results using formation histories generated with a semi-analytic model. We conclude with a discussion of our results and ways to build upon the results presented here.
2 Spectral Classification in the 2dFGRS
2.1 Principal Component Analysis
Principal component analysis (PCA) is a well established statistical technique which has proved very useful in dealing with high dimensional data sets (see e.g. Murtagh & Heck 1987; Connolly et al. 1995). In the particular case of galaxy spectra we are typically presented with approximately 1000 spectral channels per galaxy, however when used in applications this is usually compressed down to just a few numbers, either by integrating over small line features — yielding equivalent widths — or over broad band filters. The key advantage of using PCA in our data compression is that it allows us to make use of all the information contained in the spectrum in a statistically unbiased way, i.e. without the use of such ad hoc filters.
In order to perform the PCA on our galaxy spectra we first construct a representative volume limited sample of the galaxies. We compute the “mean spectrum” from this ensemble, and subtract this mean from all of the galaxy spectra. When we apply the PCA to this sample an orthogonal set of components (eigenspectra) is constructed, which span the wavelength space occupied by the galaxy spectra. These components have been specifically chosen by the PCA in such a way that as much information (variance) is contained in the first eigenspectrum as possible, and that the amount of the remaining information in all the subsequent eigenspectra is likewise maximised. Therefore, if the information contained in the first eigenspectra is found to be significantly greater than that in the remaining eigenspectra we can significantly compress the data set by swapping each galaxy spectrum (described by 1000 channels) with its projections onto just those eigenspectra.
In the case of the 2dF galaxy spectra we find that approximately two thirds of the total variance (including the noise) in the spectra can be represented in terms of only the first two projections (, ). So, at least to a first approximation, galaxy spectra can be thought of as a two dimensional sequence in terms of these two projections.
In Fig. 1 we show these first two eigenspectra. It can be seen from this figure that whilst the first eigenspectrum contains information from both lines and the continuum, the second is dominated by absorption and emission lines. Because of this it is possible to take two simple linear combinations which isolate either the continuum or the emission/absorption line features. In effect what we are doing when we utilise these linear combinations is rotating the axes defined by the PCA to make the interpretation of the components more straightforward. In so doing we can see that a parameterisation in terms of and is essentially equivalent to a two dimensional sequence in colour (continuum slope) and the average emission/absorption line strength. This ability to isolate the continuum and line components of the galaxy spectra turns out to be very useful, as will be discussed in Section 2.2.

2.2 The Parameter
The 2dF instrument makes use of up to 400 optical fibres with a diameter of 140m (corresponding to on the sky, depending on plate position. See Lewis et al. 2002). The instrument itself was designed to measure large numbers of redshifts in as short an observing time as possible. However, in order to optimise the number of redshifts that can be measured in a given period of time, compromises had to be made with respect to the spectral quality of the observations. Therefore if one wishes to characterise the observed galaxy population in terms of their spectral properties, care must be taken in order to ensure that these properties are robust to the instrumental uncertainties.
The quality and representativeness of the observed spectra can be compromised in several ways and a more detailed discussion of these issues is presented in previous work (see e.g. Madgwick et al. 2002). The net effect is that the uncertainties introduced into the fibre-spectra predominantly affect the calibration of the continuum slope and have relatively little impact on the emission/absorption line strengths. For this reason any given galaxy spectrum which is projected onto the plane defined by (,) will not be uniquely defined in the direction of varying continuum but will be robust in the orthogonal direction (which measures the average line strength).
The linear combination of the first two eigenspectra which is robust to these uncertainties is shown in Fig. 1 (b) and denoted by (ETA_TYPE in the 2dFGRS catalogue111http://www.mso.anu.edu/2dFGRS/). It is simply
| (1) |
where is a constant which we find empirically to be .
We have now identified the single statistically dominant component of the galaxy spectra which is robust to the known instrumental uncertainties. We have therefore chosen to adopt this (continuous) variable as our measure of spectral type. Having defined in this formal and pragmatic manner, however, we are left with the question of whether it is physically meaningful, and how it is to be interpreted. This is the issue that we now address.
2.3 Correlation of with traditional galaxy classifiers
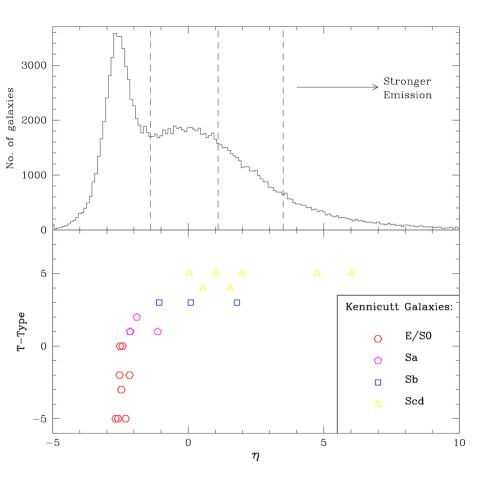
We show the observed distribution of for the 2dF galaxies in Fig. 2. It is rather intriguing that this distribution is strongly bimodal. Fig. 2 also shows the projections of spectra from galaxies in the Kennicutt Atlas (Kennicutt 1992), which have known morphologies. There is a correspondence between morphology and in the expected sense: the value of increases as one moves towards later type objects in the Hubble sequence. Larger values of indicate more dominant emission lines, and it is well-known that later type galaxies have stronger emission lines. From this diagram we see that seems to be correlated with morphological type, at least based on this small sample of galaxies. Norberg et al. (2002) showed the distribution of for a larger sample of galaxies that had been classified into four morphological types (E, S0, Sp and Irr), and showed that while there is a correlation between morphological type and , there is a large scatter. The correspondence between and morphological type is investigated in more detail in Madgwick (2002).
We can also compare the value of derived for each galaxy to the equivalent width of the H emission line, for a sample of high signal-to-noise ratio emission line spectra. This is shown in Fig. 3, from which it can be seen that there is a strong correlation between these quantities. It is well-known that the equivalent width of H is a measure of star formation; indeed it has been used to estimate the birthrate parameter (the ratio of the present rate of star formation to the past averaged value — see e.g. Figure 3 of Kennicutt, Tamblyn & Congdon 1994). We return to this point in Section 3.2, where we use galaxy formation models to investigate how relates to the star-formation history.

3 Comparison with Simple Models
The results shown above suggest that is related both to galaxy morphology and to star formation history. In this section we further explore and test this hypothesis with models produced by combining simple parameterised star formation histories with spectral synthesis models. In this way, we can make a direct connection between a galaxy’s star formation history and the value of our spectral classification statistic, .
3.1 Model Ingredients
Stellar population models combine theoretical temperature-luminosity tracks for stars of various masses with model stellar atmospheres and an assumed Initial Mass Function (IMF) in order to produce synthetic spectra for a “single burst” population of a uniform age and metalicity. In order to use these models to obtain predictions for a composite stellar population (i.e. a galaxy), the “single burst” models must be combined with an assumed star formation history, which provides the distribution of stellar ages and metalicities within the galaxy. Since the classical work on spectral synthesis by Tinsley (1980), many authors have adopted a simple parametrisation of the star formation history in terms of an exponential function of time (e.g. Bruzual 1983):
| (2) |
Here, is the time at which star formation first commences, and is the characteristic timescale of star formation. Most observed spectra can be modelled rather well using this simple function with the appropriate choice of . A typical spiral galaxy spectrum might be well-fit with Gyr, while later type galaxies require larger values and early type galaxies require smaller values of .
Nebular emission lines from ionised HII regions and extinction due to dust also contribute to the appearance of a galaxy spectrum. Modelling these processes is complicated, requiring assumptions about the ionization state, the geometry, the metalicity, the dust mass and the composition of HII regions.
The models presented in this Section are based on this simple but well-defined picture, and are realized using version 2.0 of the PEGASE software package (Fioc & Rocca-Volmerange) In all of the models shown we have adopted a Kennicutt (1983) initial-mass function with stellar masses in the range . In addition, the metalicity of each galaxy is traced in a self-consistent manner using the prescription of Woosley & Weaver (1995), to model the enrichment of the inter-stellar medium.
Nebular emission lines result from light re-emitted by the ionised gas in star-forming regions. A prescription for determining the strengths of these lines is implemented in the PEGASE code. This process involves the absorption of Lyman continuum photons (below 912Å) by the nebular gas, which gets ionised, and reaches recombination equilibrium (Osterbrock 1989). It is assumed that 70% of these photons are absorbed by the gas at solar metalicity. In this approach, the strength of the nebular emission lines is a function of the age of the stellar population only, and metalicity and geometric effects are neglected.
The PEGASE code provides a simple way to model the effects of dust extinction on the synthetic spectra, in which the optical depth is estimated from the mass of gas and the metalicity. The absorption is then estimated using observational data for a mixture of graphites and silicates as in the Milky Way and the Magellanic Clouds (Draine & Lee 1984 and Pei 1992). In making this calculation it is also necessary to make an assumption about the geometry of the galaxy. We investigated models in which we assumed a spheroidal geometry and also an inclination-averaged disk geometry.
The spectra generated by the PEGASE code over the optical wavelength range are generally given in 10Å bins, and the emission line strengths are specified separately in terms of their peak fluxes over the continuum. In order to make comparisons between these spectra and the 2dFGRS we therefore interpolate the synthetic spectra onto the 4Å binned wavelength range of the 2dFGRS. Because the given emission lines are not resolved in this binning we create lines by superposing Gaussian profiles with the specified peak flux and FWHM corresponding to that calculated for the 2dF spectrograph using arc line measurements ( pixels). We convert the given synthetic spectra to units of counts/bin by multiplying the flux (erg/s/Å) by the wavelength. We then normalise each spectrum to have mean counts of over our entire wavelength range. The spectra processed in this way are directly comparable to those of the 2dFGRS.
Spectral histories of a given galaxy are compiled for a range of formation times ( Gyr), and a grid of values of : 0.05, 0.1, 0.2, 0.3, 0.5, 0.7, 1.0, and 2.0 Gyr. We also calculate spectral histories for an instantaneous burst of star-formation at . Because this grid does not comprise a well-defined sample of galaxies, to compare with the results from the 2dFGRS, we first subtract the mean spectrum from the 2dFGRS volume limited sample (described in the previous section) from each spectrum. We then compute the projection of each spectrum on the eigenspectra derived from the 2dFGRS volume limited sample. The first two projections (, ) derived in this manner are shown for our grid of models in Fig. 4, along with the corresponding projections for a random subsample of galaxies in the volume-limited 2dFGRS sample. Model grids are shown both with and without including the effects of dust extinction. It can be seen that dust does not have a dramatic impact on the results, but does seem to improve the agreement between the model tracks and the locus of the observed galaxies.

Already it is interesting that these simple models seem to cover the same range of the (, ) parameter space occupied by the observed galaxy population. Evidently, at least in this simple scheme, galaxies are “born” in the lower right-hand corner of the plot, and progress towards the upper left-hand corner as they age. As well, galaxies in the upper right part of the diagram tend to have smaller values of the characteristic timescale for star formation, , associated with early type galaxies, while as one moves diagonally towards the lower left corner, galaxies have the more extended timescales for star formation associated with late type galaxies. Perhaps unsurprisingly, the vast majority of the 2dF galaxies (which are fairly luminous) are consistent with times since formation between 2–10 Gyr. It should be kept in mind, however, that the instrumental effects discussed in Section 2.2 can introduce random scatter in this diagram. We therefore turn now to the more robust parameter.
3.2 The Physical Significance of
We argued based on a visual inspection of the eigenspectrum used to define the projection that essentially measures the strength of stellar and interstellar absorption line features and the strength of nebular emission line features. The strength of the absorption features mainly indicates the age and metalicity of the stellar population that dominates the optical luminosity of the galaxy, and the emission lines are strongly correlated with star formation activity. The comparison with classical galaxy classification methods such as visual morphology or equivalent width, shown in Section 2.3, suggested that may be connected with a measure of the star formation relative to the existing older stellar population, such as the birthrate parameter, (Scalo 1986). The birthrate parameter is defined as the ratio between the current and past-averaged star-formation rate, which in the case of the simple exponential star formation law is given analytically by
| (3) |
In this section we investigate our hypothesis that might be correlated with the birthrate parameter, .

The relationship between and for the grid of models with simple star formation histories (as before) is shown in Fig. 5. For a fixed formation time, , there is a well-defined relationship between the star formation history, as characterised by the birthrate parameter , and the spectral parameter. This helps in the interpretation of for the observed population of galaxies. At least in this simple scheme, galaxies with small values of formed most of their stars in the past, and are currently evolving rather passively. This fits in well with the classical picture of early type galaxy formation. Galaxies with larger values of have had a significant amount of recent star formation, characteristic of spiral and irregular galaxies. Recalling from Fig. 1 that the 2dFGRS sample spans a range of values of about -5 to 10, this suggests again that most of the observed galaxies in the 2dF require times since formation greater than about 1 Gyr. From this diagram, we arrive at a prediction that the distribution of for galaxies observed at larger look-back times should exhibit a shift towards higher values. We find that the effect of extinction corrections is to slightly lower the calculated for a given star formation scenario, however, this is only a small effect and does not alter the qualitative interpretation that we have suggested.
A limitation of the simple characterisation of the star formation histories that we have adopted here is manifested by the asymptote of the values towards unity: because the star formation rate was assumed to be monotonically decreasing, is always less than one. It is clear that we must be cautious in over-interpreting these results, as real galaxies presumably may have much more complex star formation histories than we have assumed here. We now pursue a similar investigation for models with much more complex star formation histories, generated using a cosmological semi-analytic model of galaxy formation.
4 Comparison with Semi-Analytic Models
In this section, we again extract the parameter from model galaxy spectra created using stellar population synthesis models. The difference is that instead of using a simple parameterisation for the star formation history, the formation history of each galaxy is now modelled based on physical recipes set within the framework of hierarchical structure formation. The ensemble of model spectra that we use here was created using the Somerville et al. semi-analytic models (e.g. Somerville & Primack 1999; Somerville, Primack & Faber 2001) and has been described previously in Slonim et al. (2001). We refer the reader to those works for details, and here sketch the ingredients of the models very briefly.
In the hierarchical picture, present-day galaxies such as the ones observed by the 2dFGRS formed by the merging and accretion of smaller objects over time. In this picture, the star formation history of a galaxy is determined by the mass accretion and merging histories of its host dark matter halo, and the efficiency of gas cooling within those halos. As the hot gas is enriched with heavy elements by metal-rich winds from massive stars and supernovae, the cooling efficiency is increased. Galaxy mergers may trigger powerful bursts of star formation. In turn, violent star formation events may inhibit future star formation by heating the interstellar medium or driving winds that blow it out of the galaxy.
These star formation histories are convolved with stellar population models to produce model spectra in much the same way as in the “simple” models discussed in the previous section. In the models used here, we have used the multi-metalicity GISSEL models (Bruzual & Charlot, 1983) with a Salpeter IMF to calculate the stellar part of the spectra. These models are very similar to the PEGASE stellar population models used in the previous section, and for the purposes of this investigation, this difference should not significantly affect our results. Nebular emission lines are added to the spectra in the same way as before, using the empirical library from PEGASE.
Dust extinction is included using an approach similar to that of Guiderdoni & Rocca-Volmerange (1987), which is also very similar to the approach implemented in the PEGASE package. Here, the mass of dust is assumed to be proportional to the gas fraction times the metalicity of the cold gas. We then use a standard Galactic extinction curve and a “slab” model to compute the extinction as a function of wavelength and inclination.
The recipes for star formation, supernova feedback, and chemical evolution involve free parameters, which we set by requiring a halo with a virial velocity of 220 km/s to host a galaxy with an average I-band luminosity of about , and with an average gas fraction of to , consistent with observations of local spiral galaxies. If we assume that mergers with mass ratios greater than 1:3 form spheroids, we find that the models produce the correct morphological mix of spirals, S0s and ellipticals at the present day. It has previously been shown in numerous works (e.g. Somerville & Primack 1999) that this approach leads to fairly good agreement with numerous key galaxy observations, such as the local luminosity function, colours, and clustering properties.
We construct a “mock 2dF catalogue” of model galaxies with the same magnitude limit, wavelength coverage and spectral resolution, and redshift range as the 2dF survey. The synthetic spectra are expressed in terms of photon counts and the total number of counts in each spectrum is normalised to unity, as in the prepared observed spectra.
The calculation of the strength of the nebular emission features is one of the less precise aspects of the spectral synthesis packages. For this reason in Fig. 6 we show the first two principal components (,) for the semi-analytic model (SAM) ensemble of synthetic spectra. It can be seen that the distribution of the mock catalogue principal components is quite similar to that of the observed 2dFGRS galaxies. To guide the eye, the same set of evolutionary tracks shown in Fig. 4, derived from the “simple” models, is also shown. The most noticeable difference between the observed distribution and that of the mock, is that the former is substantially broader (most likely due to observational effects such as noise, reddening and evolution combined with the fact that the observed galaxies form a much larger sample). It is also interesting that the simple model tracks span the same locus of the (, ) parameter space as the SAM galaxies, despite the fact that as we have emphasised the star formation histories are very different in the two kinds of models.

We can now discover whether the strong connection between and the birthrate parameter that we demonstrated for the simple models hold true for galaxies with more arbitrary star formation histories. In Fig. 7, we show vs. for the mock-2dF ensemble of SAM galaxy spectra. Again we see a strong relationship between and the parameter. Also, it is encouraging to note that the range of spanned by the SAM galaxies (-5 to 15) is similar to that spanned by the 2dF galaxies. The fact that the spectral properties of the galaxies in the SAM ensemble appear similar to those of the real 2dF galaxies enables us to use the results of the SAMs to draw a correspondence between the actual numerical value of and . This leads to the interesting conclusion that the dividing line between the two “bumps” in the bimodal distribution of seen in Fig. 1, , corresponds to galaxies that are forming stars at about 1/10th of their past-averaged rate. Similarly, the other two thresholds adopted by Madgwick et al. (2002) to calculate luminosity functions per spectral type may be matched up with values using Fig. 7.
We have also investigated correlations between and other physical properties of galaxies in the SAMs, such as bulge-to-total ratio or mean stellar age. While other correlations exist, none are as tight as the correlation shown in Fig. 7 between and the birthrate parameter . Of all the correlations we investigated, the connection between and star formation history seems to present the most straightforward interpretation of the parameter. We defer a more detailed investigation of the other physical correlations in the SAMs and comparison with the 2dF and other data sets to a future work.

5 Discussion
In this paper we have studied the physical interpretation of a PCA-based spectral parameter, , defined for the analysis of the 2dFGRS spectra (Madgwick et al. 2002). Although the definition of was motivated by the need to compromise between the desire to extract the maximum amount of statistical information from the spectra (in the sense of PCA’s maximum variance) and the limitations imposed by the instrumental uncertainties of the 2dF, we have argued here that this parameter has a straightforward and physically meaningful interpretation. We find that is an indicator of the star formation history of the galaxy, and is tightly correlated with the birthrate parameter , which characterises the ratio of present to past-averaged star formation.
A first indication of this correspondence is the correlation we find between and and the equivalent width of the H emission line, EW(H), which has been used as a direct measure of the birthrate parameter in previous studies (e.g. Kennicutt, Tamblyn & Congdon 1994). We show that in models with simple star formation histories, parameterised in terms of an exponential function of time, there is a one-to-one correspondence between and the birthrate parameter (for a fixed formation time). Perhaps this is not too surprising in the context of classical spectral synthesis work — it has long been known (e.g. Tinsley 1980) that a simple SF history can be used to interpret spectral appearance, i.e. in this context. More surprisingly, we show also that a strong relationship between and is also exhibited by model galaxies with much more complex star formation histories, created within a hierarchical cosmological framework using a semi-analytic model.
The explanation of this surprisingly simple result must lie in the physical processes that determine the appearance of a galaxy spectrum. First, it is important to remember that at optical wavelengths, where all of this analysis has been carried out, the spectrum is dominated by the most luminous stars, and is therefore biased towards the most recent significant star formation activity. The slope of the optical continuum and the strength of stellar absorption lines evolve on the timescale of the lifetimes of intermediate type main sequence stars, roughly several Gigayears. The strengths of nebular emission features, however, evolve on much shorter timescales, as they require the presence of very hot, short lived O and B type stars. These features therefore depend on the star formation history on the timescale of 5–10 Megayears. The parameter has been defined so as to be insensitive to the continuum slope (for practical reasons), and hence represents a sequence from strong absorption lines to strong emission lines. It is well-known that the strengths of stellar absorption lines (especially Hydrogen recombination lines such as the Balmer series) are good indicators of stellar age, while the strength of the nebular emission lines are indicators of present star formation rate. With all this in mind, we can deduce that the rapid evolution in the value of over the first several hundred Myr of a galaxy’s life (see Fig. 5) reflects the fading of the emission lines as the star formation rate declines and the young stars burn out. Galaxies then tend to “pile up” at low values of as the age of their dominant stellar population exceeds a few Gyr.
In this sense it is straightforward to understand the relationship between and for our “simple” models, of monotonically decreasing star formation activity. However, the star formation histories of galaxies created by the semi-analytic models can be quite complex. The star formation rate fluctuates dramatically and non-monotonically over time as the galaxy exhausts its gas and then accretes a new gas supply, or experiences bursts of star formation triggered by mergers. The issue we must now address is how an optical diagnostic such as , which is dominated by only the most recent events of star-formation, can be so closely related to the birth-rate parameter, , which incorporates the entire formation history of a galaxy.
The basis of the hierarchical picture of galaxy formation — from which our mock catalogue of SAM galaxies has been derived — is that galaxy properties are determined by the merger histories of their host dark matter halos. In essence, the history of a specific halo (or galaxy) can be understood in terms of how the density on the scale of that structure compares to the background density. A region with density much above the average (a “many sigma” peak, in the language of Gaussian random fields) collapses early, while lower density peaks collapse later. It can therefore be conjectured that the early collapse of a dense dark matter halo can be associated with early star formation, early consumption of all available gas, and low present-day star formation rates. Conversely, late-forming objects will have a sustained gas supply and ongoing star formation. This suggests that the birthrate parameter reflects perhaps the most theoretically fundamental property of a galaxy (or of its host halo): small- galaxies represent rare, many-sigma peaks in the primordial density field, while large- galaxies are formed in more common, lower density peaks. This trend is manifested in the numerous empirical correlations between galaxy “type” (as characterised by morphology, colour, or spectral type), luminosity, and environment. We expect this simple picture to be complicated by the details of gas cooling, star formation, feedback, etc., but the results from the semi-analytic models (which include all of these effects at some level, although of course the real Universe is likely to be even more complicated) suggest that this only introduces a moderate amount of scatter on top of the general trend.
We therefore conclude that the parameter represents a promising candidate for galaxy classification in large modern redshift surveys. It was adopted in previous analyses of the 2dFGRS because of its practical advantages: it is straightforward and efficient to compute in an automated fashion, and it is robust to the instrumental uncertainties commonly associated with fibre-based multi-object spectrographs. Here we have shown that also has a straightforward physical interpretation which can be intuitively connected both with traditional classifiers such as morphology, and that it seems to be connected with theoretically fundamental properties of galaxies within the modern hierarchical structure formation paradigm.
Acknowledgments
The efforts of the 2dFGRS collaboration, in preparing and compiling the data used in this analysis, are greatly appreciated. In particular we thank Karl Glazebrook for providing many useful comments and suggestions. DSM was supported by an Isaac Newton studentship from the Institute of Astronomy and Trinity College, Cambridge. RSS thanks the IoA for hospitality during completion of this work, and acknowledges support from the IoA visitor program.
References
- (1) Bruzual A. G., 1983, ApJ, 273, 105
- (2) Bruzual A. G., Charlot S., 1993, ApJ, 405, 538
- (3) Carter B. J., Fabricant D. G., Geller M. J., Kurtz M. J., McLean B., 2001, ApJ, 559, 606
- (4) Cole S., Aragon-Salamanca A., Frenk C. S., Navarro, J. F., Zepf S. E., 1994, MNRAS, 271, 781
- (5) Connolly A.J., Szalay A.S., Bershady M.A., Kinney A.L., Calzetti D., 1995, AJ, 110, 1071
- (6) Draine B. T., Lee H. M., 1984, ApJ, 285, 89
- (7) Fioc M., Rocca-Volmerange B., 1997, A&A, 326, 950
- (8) Guiderdoni G., Rocca-Volmerange B., 1987, A&A, 186, 1
- (9) Kauffmann G., White S. D .M, Guiderdoni B., 1993, MNRAS, 264, 201
- (10) Kauffmann G., et al., 2002, MNRAS submitted, astro-ph/0204055
- (11) Kennicutt R. C. Jr., 1983, ApJ, 272, 54
- (12) Kennicutt R. C. Jr., 1992, ApJS, 79, 255
- (13) Kennicutt R. C. Jr., Tamblyn P., Congdon C. E., 1994, ApJ, 435, 22
- (14) Lejeune T., Cuisinier F., Buser R., 1997, A&AS, 125, 229L
- (15) Lejeune T., Cuisinier F., Buser R., 1998, A&AS, 130, 65L
- (16) Lewis I., et al. (the 2dFGRS Team), 2002, MNRAS, 333, 279
- (17) Madgwick D. S., et al. (the 2dFGRS Team), 2002, MNRAS, 333, 133
- (18) Martinez H. J., Zandivarez A., Dominguez M., Marchan M. E., Lambas D. G., 2002, MNRAS, 333, 31
- (19) Murtagh F., Heck A., 1987, Multivariate Data Analysis. Riedel, Dordrecht
- (20) Norberg P., et al. (the 2dFGRS Team), 2002, MNRAS, 332, 827
- (21) Osterbrock D. E., 1989, Astrophysics of Gaseous Nebulae and Active Galactic Nuclei, University Science Books, Mill Valley, CA.
- (22) Pei Y. C., 1992, ApJ, 395, 130
- (23) Percival W. J. et al. (the 2dFGRS Team), 2002, MNRAS, 327, 1297
- (24) Ronen S., Aragón-Salamanca A., Lahav O., 1999, MNRAS, 303, 197
- (25) Scalo J. M., 1986, Fund. Cos. Phys., 11, 1
- (26) Slonim N., Somerville R., Tishby N., Lahav O., 2001, MNRAS, 323, 270
- (27) Somerville R. S., Primack J. R., 1999, MNRAS, 310, 1087
- (28) Somerville R. S., Primack J. R., Faber S., 2001, MNRAS, 320, 504
- (29) Strauss M. A., et al. (the SDSS collaboration), 2002, AJ, 124, 1810
- (30) Tinsley B. M., 1980, Fund. Cosmic Physics, 5, 287
- (31) Woosley S. E., Weaver T. A., 1995, ApJS, 101, 181