A reinterpretation of Volcano Ranch lateral distribution measurements to infer the mass composition of cosmic rays
Abstract
In the course of its operation, the Volcano Ranch array collected data on the lateral distribution of showers produced by cosmic rays at energies above eV. From these data very precise measurements of the steepness of the lateral distribution function, characterized by the parameter, were made. The current availability of sophisticated hadronic interaction models has prompted a reinterpretation of the measurements. We use the interaction models qgsjet and sibyll in the aires Monte Carlo code to generate showers together with geant4 to simulate the response of the detectors to ground particles. As part of an effort to estimate the primary mass composition of cosmic rays at this energy range, we present the results of our preliminary analysis of the distribution of .
1 Introduction
Over its lifetime, the Volcano Ranch array [1] collected data on the lateral distribution of air showers produced by cosmic rays of energies above eV. This lateral distribution is parameterized by a so-called lateral distribution function. The steepness of this function, given by , is sensitive to the depth of maximum () of the shower, and therefore to the primary composition and to the character of the initial hadronic interactions.
Our analysis of precise Volcano Ranch measurements of is the first analysis of Volcano Ranch data using modern Monte Carlo tools. To simulate the development of the air shower we use the aires [2] code (version 2.4.0), which contains the hadronic interaction generators qgsjet98 [3] and sibyll2.1 [4]. The results of these simulations are convolved with a simulation of the detector response carried out using geant4 [5].
2 Volcano Ranch
The pioneering Volcano Ranch array was an array of scintillation counters in operation from 1959-1974 at the MIT Volcano Ranch station located near Albuquerque, New Mexico. One of its many distinctions was the detection of the first cosmic ray event with an energy estimated at eV [6]. Over its lifetime, the array existed in three distinct configurations. The first configuration consisted of twenty scintillator detectors of surface area 3.26 . Nineteen detectors were spaced 442 m apart. A twentieth detector was placed at various locations and used for the measurement of the density of particles. A second configuration had a larger spacing of 884 .
It is the third configuration which is most significant for our analysis. In this configuration, the number of detectors was quadrupled by splitting up each of the twenty detectors into eighty detectors of surface area 0.815 spaced 147 m apart. This configuration, with many more detectors spaced closer together, allowed for very precise measurements of the lateral distribution of signals in the detectors. The steepness of the lateral distribution, and fluctuations in it, may lead to an estimate of the primary composition.
3 Simulation of detector response
To simulate the detector response of the array to the ground particles, we utilized the general-purpose simulation toolkit geant4. Our procedure follows the prescription found in [9], where the detector response to electrons, gamma, and muons is simulated in the energy range 0.1 to 1.0e5 MeV and for five bins per decade of energy. This detector response is convolved with the results of aires air shower simulations to obtain scintillator yield in minimum ionizing particles per square meter .
4 Lateral distribution function
For Volcano Ranch data, a generalized version of the Nishimura-Kamata-Greisen (NKG) formula was used by Linsley to describe the lateral distribution of particles at ground in [10]. This lateral distribution function is given as
| (1) |
normalized to with
| (2) |
Here is the Moliere radius, which is 100 m at the Volcano Ranch elevation.
From a subset of showers detected by the array in the third configuration, the following form of as a function of zenith angle and shower size was found to fit the data [7]:
| (3) |
with , , and .
5 Preliminary comparison of lateral distribution
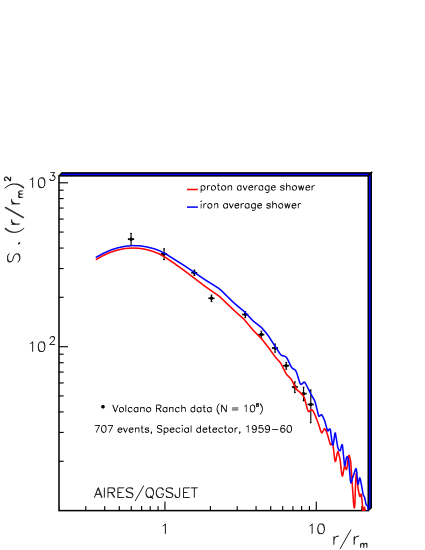
Here we compare the Volcano Ranch lateral distribution with modern Monte Carlo simulations. In Figure 1 we show how well the simulations (aires/qgsjet98 with the detector response included) reproduce the average lateral distribution of 707 showers of estimated size , measured by the array in its first configuration [10].
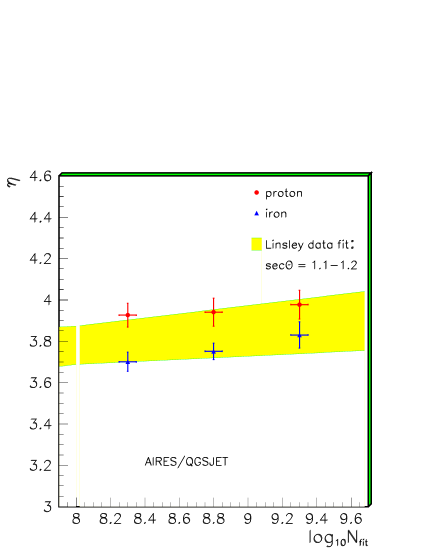
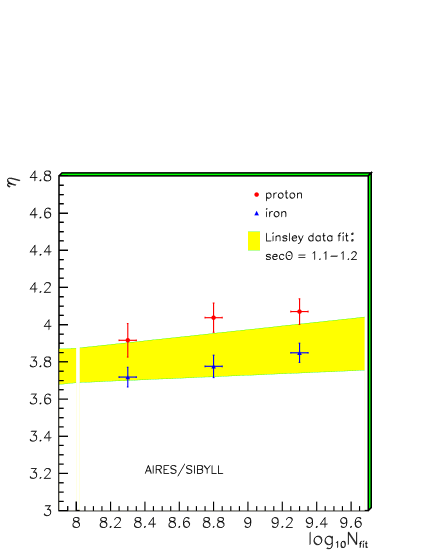
As a further comparison, for fixed bins of zenith angle, we determine the number of particles at ground level from a fit to the lateral distribution function (with ) and compare to the average functional form of given by Equation 3. The results of this comparison for can be seen for proton and iron showers using aires/qgsjet98 and aires/sibyll2.1 in Figures 2 and 3. One can see that the average form of over a realistic range of mass composition, from proton to iron, is reproduced by the simulations. At this stage, any attempt to draw a firm conclusion about composition or the suitability of interaction models is premature; we have limited Monte Carlo statistics and are only comparing to an average functional form of . What we are content to take from this stage of the analysis is encouragement from the fact that the simulation can reproduce the data. A more detailed analysis will follow in a later work.
6 Towards an estimate of primary composition
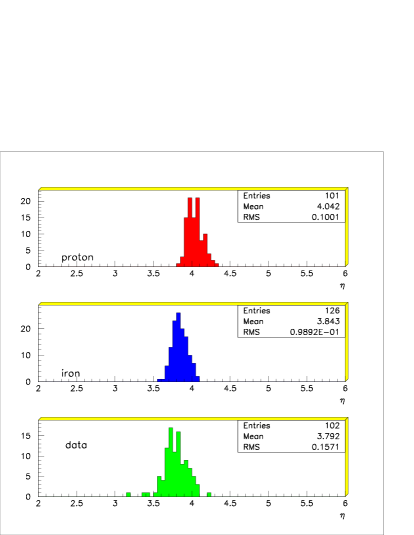
A more robust estimator of primary composition comes from an analysis of the measured fluctuations of , which were found to be significantly greater than that expected from measurement error alone [7]. From our knowledge of the characteristics of showers produced by nucleons and nuclei, one would expect that measured fluctuations in the distribution of would be smaller for a heavier composition. This can be understood if we consider an air shower produced by a nucleus with nucleons as a superposition of showers each with energy . Thus in iron-initiated showers the average fluctuations in shower development are reduced.
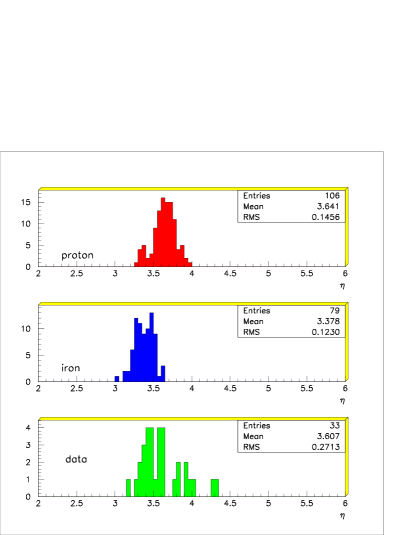
At Volcano Ranch, measurements of were made on a shower-to-shower basis for fixed bins of zenith angle [8]. Our procedure is to simulate showers in these bins of zenith angle, find from a fit to the lateral distribution function, and compare to data. The results of this preliminary comparison can be seen in Figures 4 and 5.
7 Conclusions and future plans
Using modern Monte Carlo tools previously unavailable during its operation we have been able to reproduce lateral distribution measurements taken at the Volcano Ranch array. With an eye towards estimating the primary composition from these measurements, our ability to reproduce them gives us some confidence that our analysis procedure is correct and indicates that current hadronic interaction models can describe the data fairly well. A preliminary analysis of the distribution of the steepness of the lateral distribution function, , indicates that indeed something can be said about primary composition from an analysis of the data, but that further analysis is needed to make any stronger statement. However, it is encouraging that the data from Volcano Ranch may be used to say something useful about mass composition thirty years after its closure.
References
- [1] J. Linsley, L. Scarsi, and B. Rossi, Phys. Rev. Lett. 6 (1961) 485.
- [2] S. Sciutto, Proc. 27th ICRC, Hamburg, (2001).
- [3] N. N. Kalmykov, S. S. Ostapchenko, Yad. Fiz. 56 (1993) 105; N. N. Kalmykov, S. S. Ostapchenko, Phys. At. Nucl. 56 (1993) 346; N. N. Kalmykov, S. S. Ostapchenko, Bull. Russ. Acad. Sci. (Physics) 58 (1994) 1966.
- [4] R. Engel, T. K. Gaisser, T. Stanev, Proc. 26th ICRC, Salt Lake City, 1 (1999) 415.
- [5] http://geant4.web.cern.ch/geant4
- [6] J. Linsley, Phys. Rev. Lett. 10 (1963) 146.
- [7] J. Linsley, Proc. 15th ICRC, Plovdiv, (1977) 56.
- [8] J. Linsley, Proc. 15th ICRC, Plovdiv, (1977) 62.
- [9] T. Kutter, Auger Technical Note, GAP-98-048.
- [10] J. Linsley, Proc. 13th ICRC, Denver, (1973) 3212.